富山県立大学機関リポジトリ
153
0
0
全文
(2) CONTENTS ABBREVIATIONS GENERAL INTRODUCTION. ---------------------------------------------------------------- 1. PART 1 Analysis of vitamin D levels in biological samples CHAPTER 1. -------------------------------------------------------------------------------------------------6. Quantitative analysis of vitamin D and other fat-soluble vitamins in human breast milk CHAPTER 2. ---------------------------------------------------------------------------------------------28. Measurement of serum level of 25-hydroxyvitamin D in Japanese adolescent PART 2 Identification of novel metabolites of vitamin D CHAPTER 1. -----------------------------------------------------------------------------------------46. Identification of C-3 epimers of native vitamin D CHAPTER 2. ----------------------------------------------------------------------------------------- 82. Identification of C-3 epimer and C-25 dehydrates of vitamin D analog, 22oxacalcitriol (maxacalcitriol) CHAPTER 3. ----------------------------------------------------------------------------------------108. Measurement of C-3 Epimerization activity toward vitamin D GENERAL CONCLUSION. --------------------------------------------------------------------134. LIST OF PUBLICATIONS. --------------------------------------------------------------------136. ACKNOWLEDGEMENT. -----------------------------------------------------------------------142.
(3) ABBREVIATIONS ADR. adorenodoxin reductase. ADT. androsterone. ADX. adrenodoxin. AI. adequate intake. AIB. amplified in breast cancer. ANOVA. analysis of variance. BUA. broadband ultrasound attenuation. BMI. body mass index. CE. collision energy. CLIA. chemiluminescence immunoassay. COSY. correlation spectroscopy. CPBA. competitive protein binding assay. CYP. cytochorome P450. CXP. collision cell exit potential. D2. vitamin D2. D3. vitamin D3. 1α(OH)D3. 1α-hydroxyvitamin D3. 1α,20(OH)2D3. 1α,20-dihydroxyvitamn D3. 1α,24,25(OH)3D3. 1α,24,25-trihydroxyvitamin D3. 1α,25(OH)2D2. 1α,25-dihydroxyvitamin D2. 1α,25(OH)2D3. 1α,25-dihydroxyvitamin D3. 20-oxo-1α(OH)D3. hexanor-20-oxo-1α-hydroxyvitamin D3. 24(OH)OCT. 24-hydroxy-OCT. 24,25(OH)2D3. 24,25-dihydroxyvitamin D3. 24,25(OH)2D3. 24,25-dihydroxyvitamin D2. 24-ene-22-oxa-1α(OH)D3. 24-ene-22-oxa-1α-hydroxyvitamin D3. 25(OH)D. 25-hydroxyvitamin D [25(OH)D3+25(OH)D2]. 25(OH)D2. 25-hydroxyvitamin D2. 25(OH)D3. 25-hydroxyvitamin D3. 25-ene-22-oxa-1α(OH)D3. 25ene-22-oxa-1α-hydroxyvitamin D3. d. doublet. DBP. vitamin D binding protein.
(4) dd. doublet of doublets. ddd. doublet of doublets of doublets. DMEM. Dulbecco’s modified Eagle’s medium. DMEQ-TAD. 4-[2-(6,7-dimethoxy-4-methyl-3-oxo-3,4dihydroquinoxalyl)ethyl]-1,2,4-triazoline-3,5-dione. DNA. deoxyribonucleic acid. DP. declustering potential. DRIs. dietary reference Intakes. DTT. dithiothreitol. EDTA. ethylenediaminetetraacetic acid, dihydrate. EIA. enzyme immunoassay. ESI. electrospray ionization. FCS. fetal calf serum. FFQ. food-frequency questionnaire. FP. focusing potential. HEPES. 4-(2-hydroxyethyl)-1-piperazineethanesulfonic acid. Hertz. Hz. HIM. hexane/2-propanol/methanol. HPLC. high-performance liquid chromatography. HPTLC. high performance thin layer chromatography. HS. high school. JHS. junior high school. Km. Michaelis constant. LC-APCI/MS/MS. liquid chromatography-atmospheric pressure chemical ionization/tandem mass spectrometry. LC-MS. liquid chromatography mass spectrometry. LC-MS/MS. liquid chromatography-tandem mass spectrometry. m. multiplet. MEM. minimum essential medium. MK. menaquinone, vitamin K2. MRM. multiple reaction monitoring. NADP. nicotinamide adenine dinucleotide phosphate. NADPH. nicotinamide adenine dinucleotide phosphate, reduced. form NMR. nuclear magnetic resonance.
(5) NOESY. nuclear Overhauser effect correlated spectroscopy. OC. osteocalcin. OCT. 22-oxacalcitriol, maxacalcitriol. 26(OH)OCT. 26-hydroxy-OCT. PBS (−). phosphate-buffered saline without Ca, Mg. pH. hydrogen ion concentration. PK. phylloquinone, vitamin K1. PTH. parathyroid hormone. QUS. quantitative ultrasound. R.T.. retention time. RDAs. recommended daily allowances. RE. retinol. RIA. radio immunoassay. RoDHs. retinol dehydrogenases. S. substrate concentration. s. singlet. SD. standard deviation. SDR. short chain alcohol dehydrogenase family. SE. standard errors. sl. singlet like. SOS. speed of sound. SRC. steroid receptor coactivator. t. triplet. td. triplet of doublets. TIF. transcriptional intermediary factor. α-Toc. α-Tocopherol. UDP. uridine diphosphate. UV. ultraviolet. V. velocity. VDR. vitamin D receptor. VDRE. vitamin D-responsive element. Vmax. maximum velocity. WHO. World Health Organization. 1D. one-dimensional. 1st HS. 1st grade of high school.
(6) 1st JHS. 1st grade of junior high school. 2D. two-dimensional. 3(α→β)-HSE. 3(α→β)-hydroxysteroid epimerase. 3α-HSD. 3α-hydroxysteroid dehydrogenase. 3rd HS. 3rd grade of high school.
(7) GENERAL INTRODUCTION Vitamin D is well known to play an important role in calcium homeostasis and bone metabolism. Vitamin D may also have several nonskeletal functions such as immune system [1, 2], reproduction [3, 4] and cancer prevention [5, 6]. Vitamin D3 (D3) is synthesized in the skin from 7-dehydrocholesterol by exposure to sunlight. D3 is metabolized to 25hydroxyvitamin D3 [25(OH)D3] in the liver and subsequently to 1α,25-dihydroxyvitamin D3 [1α,25(OH)2D3] or 24,25-dihydroxyvitamin D3 [24,25(OH)2D3] in the kidney [7] (Fig.1). 1α,25(OH)2D3 is known to be the most active form and exert its biological actions through binding with the nuclear vitamin D receptor (VDR). 24,25(OH)2D3 is considered to be inactive form of vitamin D3 although there are several reports demonstrating its potentials increasing bone volume and strength at pharmacological doses [8, 9]. 25(OH)D3 is most abundant circulating metabolite of vitamin D and good indicator of the cumulative effects of exposure to sunlight and dietary intake of D3. Vitamin D2 (D2), which is the major naturally occurring form in plants, is also metabolized to 25-hydroxyvitamin D2 [25(OH)D2], 1α,25-dihydroxyvitamin. D2. [1α,25(OH)2D2]. and. 24,25-dihydroxyvitamin. D2. [24,25(OH)2D3] in a similar fashion. To date, in addition to these metabolites, many other vitamin D3 metabolites have been chemically characterized, and another unidentified metabolites are assumed to exist. OH. Liver HO. Vitamin D3 (D3). OH. Kidney HO. HO. 25-hydroxyvitamin D3 [25(OH)D3]. 1α,25-dihydroxyvitamin D3 [1α,25(OH)2D3]. OH. OH OH. HO. HO. 24,25-dihydroxyvitamin D3 [24,25(OH)2D3]. Vitamin D2 (D2). Fig. 1 Structure and metabolic pathway of vitamin D -1-.
(8) In recent epidemiological study, lower serum 25-hydroxyvitamin D [25(OH)D, 25(OH)D3+25(OH)D2] level has been reported to be associated with a higher risk of Alzheimer disease [10], type 2 diabetes [11] and acute respiratory tract infections in newborns [12] in addition to bone fracture risk [13, 14]. These finding suggest that vitamin D is an important nutrient at each stage in life from infancy to old age. Thus, it is important to measure the concentration of vitamin D metabolites and define reference value in biological samples such as serum and breast milk. In addition, it is also important to identify unknown metabolites of vitamin D and to examine their biological activity in explanation of wide-ranging biological activities of vitamin D and their regulation mechanism. In Part 1, we measured vitamin D levels in biological samples and showed reference value of them. In Part 1, Chapter 1, first, a high-sensitive determination method of vitamin D and other fat-soluble vitamins in human breast milk using liquid chromatographyatmospheric pressure chemical ionization/tandem mass spectrometry (LC-APCI/MS/MS) was developed. Then we applied this method to breast milk of Japanese lactating mothers to estimate an infant’s intake of vitamin D and other fat-soluble vitamins. In Part 1, Chapter 2, we measured serum level of 25(OH)D in a large group consisting of over 1300 Japanese adolescents using an automated competitive chemiluminescence immunoassay (CLIA) [15]. The sex differences in the association between serum 25(OH)D concentration and serum parathyroid hormone (PTH) concentration or vitamin D intake were also examined. In Part 2, we examined metabolism of native vitamin D and representative synthetic analog and identified novel metabolites including C-3 epimers and C-25 dehydrates. In Part 2, Chapter 1, we demonstrated that 25(OH)D3 which is the most abundant metabolites of vitamin D is metabolized to its C-3 epimer as well as 1α,25(OH)2D3 and 24,25(OH)2D3. In addition, further metabolism and biological activity of C-3 epimers were examined. In Part 2, Chapter 2, we identified novel three less polar metabolites of representative synthetic analog of vitamin D, 22-oxacalcitriol (OCT, maxacalcitriol) as 3-epi-OCT and two C-25. -2-.
(9) dehydrates and assessed the biological activity of them. Moreover, in Part 2, Chapter 3, we measured C-3 epimerization activity in subcellular fractions prepared from cultured cells and investigated the basic properties of the enzyme responsible for the C-3 epimerization.. -3-.
(10) References [1] C. Aranow, Vitamin D and the immune system, J Investig Med 59(6) (2011) 881–886. [2] B. Prietl, G. Treiber, T.R. Pieber, K. Amrein, Vitamin D and immune function, Nutrients 5(7) (2013) 2502–2521. [3] J. Luk J, S. Torrealday, G. Neal Perry, L. Pal, Relevance of vitamin D in reproduction, Hum Reprod 27(10)(2012) 3015–3027. [4] M. Blomberg Jensen, Vitamin D metabolism, sex hormones, and male reproductive function, Reproduction 144(2) (2012) 135–152. [5] K.C. Chiang, T.C. Chen, The anti-cancer actions of vitamin D, Anticancer Agents Med Chem 13(1) (2013) 126–139. [6] J.C.T. Fleet, M. DeSmet, R. Johnson, Y. Li, Vitamin D and cancer: a review of molecular mechanisms, Biochem J 441(1) (2012) 61–76. [7] H. F. De Luca, Recent advances in our understanding of the vitamin D endocrine system, J Lab Clin Med 87(1) (1976) 7–26. [8] T. Nakamura, T. Kurokawa, H. Orimo, Increase of bone volume in vitamin D-repleted rats by massive administration of 24R,25(OH)2D3, Calcif Tissue Int 43(4) (1988) 235– 243. [9] T. Nakamura, T. Kurokawa, H. Orimo, Increased mechanical strength of the vitamin Dreplete rat femur by the treatment with a large dose of 24R,25(OH)2D3. J Bone Miner Res 29(9) (2014) 2024–2031. [10] C. Balion, L.E. Griffith, L. Strifler, M. Henderson, C. Patterson, G. Heckman, D.J. Llewellyn, P. Raina, Vitamin D, cognition, and dementia: a systematic review and metaanalysis, Am J Clin Nutr, 97(3) (2013) 524–530. [11] S. Lim S, M.J. Kim, S.H. Choi, C.S. Shin, K.S. Park, H.C. Jang, L.K. Billings, J.B. Meigs, Association of vitamin D deficiency with incidence of type 2 diabetes in highrisk Asian subjects, Neurology 79(13) (2012) 1397–1405. [12] N. Dinlen, A. Zenciroglu, S. Beken, A. Dursun, D. Dilli, N. Okumus, Association of vitamin D deficiency with acute lower respiratory tract infections in newborns, J Matern Fetal Neonatal Med 29(6) (2016) 928–932. [13] A.C. Looker, M.E. Mussolino, Serum 25-hydroxyvitamin D and hip fracture risk in older U.S. white adults, J Bone Miner Res, 23(1) (2008) 143–150.. -4-.
(11) [14] K. Bleicher, R.G. Cumming, V. Naganathan, F.M. Blyth, D.G. Le Couteur, D.J. Handelsman, L.M. Waite, M.J. Seibel, U-shaped association between serum 25hydroxyvitamin D and fracture risk in older men: results from the prospective population-based CHAMP study, J Bone Miner Res,. 29(9) (2014) 2024–2031.. [15] D.L. Ersfeld, D.S. Rao, J.J Body, J.L. Sackrison Jr., A.B. Miller, N. Parikh, T.L. Eskridge, A. Polinske, G.T. Olson, G.D. MacFarlane, Analytical and clinical validation of the 25 OH vitamin D assay for the LIAISON automated analyzer, Clin Biochem 37(10) (2004) 867–874.. -5-.
(12) PART 1 Analysis of vitamin D levels in biological samples. CAPTER 1 Quantitative analysis of vitamin D and other fat-soluble vitamins in human breast milk. -6-.
(13) Introduction International agencies including World Health Organization (WHO) and health organizations of various countries recommend breastfeeding as the preferred method of infant feeding for the first several months of life [1]. There is no doubt that breastfeeding is beneficial to the relationship between mother and infant. According to WHO, exclusive breast-feeding is recommended up to six months of age, with continued breast-feeding along with appropriate complementary foods up to two years of age of beyond. Term infants nursed by nutritionally adequate mothers are provided with sufficient energy and the proper profile of nutrients to support normal growth and development during the first six months except for vitamins D and K in the immediate newborn period [2, 3]. Exclusive breastfeeding is a risk factor for rickets in infants. There have been reports of clinical rickets in breastfed infants, especially nursed by mothers who restrict their intake of vitamin D-rich foods (i.e. strict vegetarians) [4]. Also, in countries where climate or custom lead to low levels of exposure of the child or the mother to sunlight, infant serum concentrations of 25(OH)D may be sub-optimal [5, 6]. In previous reports, the concentrations of D3, 25(OH)D3, 24,25(OH)2D3 and 1α,25(OH)2D3 in human breast milk were 0.03–0.12, 0.28–0.57, 0.04–0.28 and 0.005–0.02 ng/mL, respectively [7–10]. These results indicate that most anti-rachitic activity is caused by 25(OH)D3, and the transfer of vitamin D and its metabolites from plasma to milk is limited. Vitamin K is also a possible problem for breast-fed infants. Human breast milk contains only a low concentration of vitamin K and there is strong evidence of increased incidence of late haemorrhagic disease in breastfed infants [11]. It was reported that the vitamin K1 (phylloquinone, PK) concentration of human breast milk ranges from 1 to 9 ng/mL [12, 13]; however, there are few reports associated with other important vitamin K derivatives, -7-.
(14) vitamin K2 (menaquinone, MK), contents [14]. Regional or individual nutritional problems with Vitamin A and E in breast-fed infants are also reported. In the developing countries, subclinical vitamin A deficiency has been observed in infants fed breast milk. The vitamin A content of milk in poorer populations in developing countries such as India, Ceylon and Jordan, where vitamin A intake is marginal, is lower than in North America and Europe [15]. Meanwhile, there has been no report of problems with vitamin E for breast-fed infants. In this manner, surveys of the concentrations of vitamin D and other fat-soluble vitamins in human breast milk have important implications for the promotion of breastfeeding. However, there are several problems in sensitivity, specificity and accuracy with determination of fat-soluble vitamins in breast milk. Especially, it is difficult to determine vitamin D and metabolites using standard assay methods such as high-performance liquid chromatography (HPLC) with ultraviolet (UV) detection [16], competitive protein binding assay (CPBA) [17], radio immunoassay (RIA) [18] and enzyme immunoassay (EIA) [19], because concentrations of them are markedly low. In this study, we have developed a highsensitive quantification method of vitamin D and other fat-soluble vitamins in human breast milk using liquid chromatography-tandem mass spectrometry (LC-MS/MS) and applied to a nutrition survey for lactating mothers.. -8-.
(15) Materials and methods Materials. D3, D2, 25(OH)D3 and 25(OH)D2 were obtained from Solvay Pharmaceuticals B.V. (Veenendaal, The Netherlands). Retinyl palmitate and β-Carotene were purchased from Sigma-Aldrich Co. (St. Louis, MO, USA). α-Tocopherol (α-Toc), PK, MK-4 and MK-7 were kindly provided by Eisai Pharmaceuticals (Tokyo, Japan). Four internal standards, d625-(OH)D3, [18O2]-PK, [18O2]-MK-4 and [18O2]-MK-7 were synthesized as described in our previous reports [20, 21]. D6-retinyl acetate, d6-β-carotene, d7-D3, and d6-α-Toc were synthesized by Dr. Suhara. The chemical structures of the internal standards are shown in Fig.. 1.. Derivatization. reagent,. 4-[2-(6,7-dimethoxy-4-methyl-3-oxo-3,4-. dihydroquinoxalyl)ethyl]-1,2,4-triazoline-3,5-dione (DMEQ-TAD) was purchased from Wako Pure Chemical Industries, Ltd. (Osaka, Japan).. Preparation of Retinol and d6-Retinol. Retinol (RE) and d6-RE solutions were prepared by saponifying retinyl palmitate and d6-retinyl acetate before use. 40 µg of retinyl palmitate and d6-retinyl acetate were dissolved in 1.5 mL of pyrogallol-ethanol (7 %, w/v). After the addition of 0.5 mL of NaCl solution (1 %, w/v) and 0.8 mL of KOH solution (60 %, w/v), the mixture was incubated at 70 ºC for 30 min. RE and d6-RE were extracted with hexane-diethyl ether (90:10, v/v), evaporated under reduced pressure, and the residue was dissolved with 2-propanol.. -9-.
(16) CD3 D CD3. d7-D3. CD3 OH CD3. d6-25(OH)D3. HO. HO CD3. CD3 CH2OH. d6-RE CD3. d6-β-Carotene. CD3 CD3. d6-α-Toc. HO D3C. O 18O. 18O-PK 18O 18O. 18O-MK-4. 18O 18O. 18O-MK-7 18O. Fig.1 Chemical structures of internal standards.. Concentrations of RE and d6-RE were determined spectrophotometrically using a molar extinction coefficient, ε = 52,480. The purity was checked by HPLC consisting of an LC10ADVP pump, a SIL-10ADVP auto injector, a CTO-10ADVP column oven set to 35 ºC, and an RF-10AXL fluorescence detector set to an excitation wavelength of 340 nm and an emission wavelength of 460 nm (Shimadzu, Kyoto, Japan). Separation was performed on a Capcellpak C18 UG120 (4.6 × 250 mm, Shiseido Co. Ltd., Tokyo, Japan) eluted with ethanol: H2O (95:5) at a flow rate of 0.4 mL/min.. - 10 -.
(17) Sample Collections. Human breast milk samples were collected from March 2005 to October 2006 from 82 lactating mothers aged 18–39 y (30.8 ± 4.5 y) at 3–265 d (49.1 ± 57.6 d) post-partum living in Japan. Written informed consent was obtained from each subject prior to enrollment in this study according to the conditions of the Helsinki Declaration and approved by the ethics committee of Kobe Pharmaceutical University. Approximately 50 mL of human breast milk was collected by manual expression at an intermediate time during suckling and immediately frozen at −20 ºC. Before extraction of vitamin D and other fat-soluble vitamins, frozen breast milk was thawed and sonicated in ice water twice for 15 min. For the developmental work on the assay, pooled human breast milk prepared by mixing breast milk from seven healthy mothers was used.. Extraction of Vitamin D, Vitamin A, β-Carotene and Vitamin E. 10.0 mL of breast milk samples was placed in a 50-mL screw-top vial. After the addition of 50 µL of internal standard solution [d7-D3, d6-25(OH)D3, d6-RE, d6-β-carotene and d6-αToc, 50 ng/50 µL ethanol each], 20 mL of pyrogallol-ethanol (7 %, w/v), 6 mL of NaCl solution (1 %, w/v) and 10 mL of KOH solution (60 %, w/v), the mixture was incubated at 70 ºC for 60 min. Then, the mixture was transferred to a 200-mL of separating funnel containing 38 mL of NaCl solution (1 %, w/v) and vitamin D, vitamin A, β-carotene and vitamin E were extracted twice with 30 mL of hexane-ethyl acetate (9:1, v/v), washed with water, and dehydrated with Na2SO4. The eluate was evaporated under reduced pressure, and the residue was dissolved with 2.5 mL of hexane:ethyl acetate (9:1, v/v). For determination of D3, D2, 25(OH)D3 and 25(OH)D2, 1.5 mL of 2.5 mL was concentrated and purified by normal phase HPLC. HPLC was carried out using a model 600 pump and a model 996 - 11 -.
(18) photodiode array detector (Waters Associates, Milford, MA). Elution was performed on a Zorbax SIL column (4.6 × 250 mm, Agilent Technologies, Santa Clara, CA), using hexane:2-propanol:methanol (88:10:2, v/v/v), at a flow rate of 1.0 mL/min. After the eluates corresponding to D3 and D2 (D fraction, 3.5-5.0 min) and 25(OH)D3 and 25(OH)D2 (25D fraction, 5.0-8.0 min) were collected, DMEQ-TAD derivatization was performed by described below. For the determination of RE, β-carotene and α-Toc, another 1.0 mL was evaporated, and the residue was dissolved with 100 µL of ethanol, 50 µL of which was directly subjected to LC-MS/MS.. DMEQ-TAD Derivatization of D and 25(OH)D Fractions. DMEQ-TAD derivatization was performed according to the method of Higashi et al. [22]. D and 25(OH)D fractions were dried and then dissolved in 150 µL of ethyl acetate containing DMEQ-TAD (60 µg). The mixture was kept at room temperature for 30 min, then an additional reagent (60 µg/150 µL of ethyl acetate) was added and the entire mixture was further kept at room temperature for 1 h. After the addition of 1.5 mL of ethanol to decompose excess reagent, the solvent was evaporated and the residue was dissolved in 100 µL of acetonitrile, 30 µL of which was subjected to LC-MS/MS.. Extraction of Vitamin K Derivatives. 3.0 mL of breast milk samples was placed in a 50-mL screw-top vial. After the addition of internal standard solution ([18O2]-PK, [18O2]-MK-4 and [18O2]-MK-7, 25 ng/25 µL ethanol each), 12 mL of phosphate buffer (pH 7.7) and 0.3 g of lipase, the mixture was incubated at 37 ºC for 90 min with stirring. Then, 12 mL of ethanol was added and vitamin K derivatives were extracted twice with 12 mL of hexane. The mixture was shaken for 5 - 12 -.
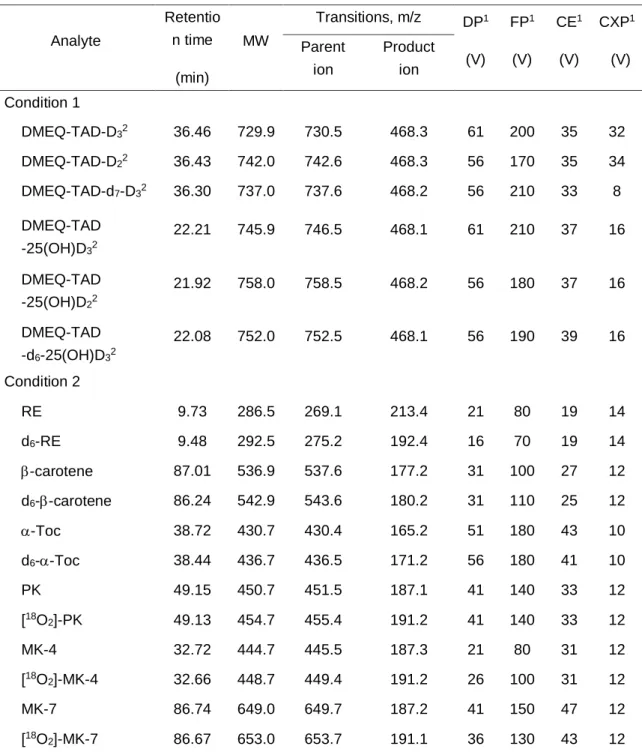
(19) min before centrifuging at 1,940 × g for 5 min. The extracts were combined and evaporated under reduced pressure, and the residue was dissolved with 3 mL of hexane. The resultant extract was passed through a Sep-Pak Vac silica cartridge (Waters, Milford, MA, USA) that was washed with 10 mL of hexane. Vitamin K derivatives were eluted with 5 mL of hexanediethyl ether (97:3). The eluate was evaporated under reduced pressure, and the residue was dissolved with 200 µL of ethanol, 50 µL of which was subjected to LC-MS/MS.. LC-MS/MS Analysis. The HPLC system consisted of a SCL-10ADvp system controller, two LC-10ADvp pumps, a DGC-14A automatic solvent degasser, a SIL-10ADvp auto injector, and a CTO10ADvp column oven set to 35 ºC (Shimadzu). The HPLC system was coupled to an API 3000 triple-quadrupole tandem mass spectrometer (Applied Biosystems/ MDS SCIEX, Foster City, CA, USA) equipped with an atmospheric pressure chemical ionization (APCI) source. Analyst (Ver. 1. 3. 2; Applied Biosystems/MDS SCIEX) was used for data acquisition and analysis. Separations were performed on a Capcellpak C18 UG120 (4.6 × 250 mm). For the determination of DMEQ-TAD derivatives of D and 25(OH)D, a solvent system consisting of a mixture of acetonitrile and H2O (30:70, v/v) in 5 min and then a linear gradient from 30 to 95 % acetonitrile in 30 min was used (Condition 1). The injection volumes of standard and sample solutions were 30 µL. For the determination of RE, βcarotene, α-Toc and vitamin K derivatives, a solvent system consisting of an isocratic solvent A (methanol:H2O, 90:10, v/v) in 10 min and then a linear gradient from 0 to 90 % acetonitrile in 30 min was used (Condition 2). The injection volumes of standard and sample solutions were 50 µL. Acquisition settings were optimized by the infusion of a 1 µg/mL solution of each compound at a rate of 20 µL/min as shown in Table 1. Curtain gas (8 psi), - 13 -.
(20) nebulizer gas (8 psi), collision gas (4 psi), nebulizer current (2 µA) and ion source temperature (400 ºC) were identical for all analytes. The mass spectrometer was operated in the positive ion mode. All analytes were detected in the MS/MS-multiple reaction monitoring (MRM) with unit resolution at both Q1 and Q3.. Table 1. Retention times, molecular weights and optimized instrument settings. Retentio. Analyte. n time. Transitions, m/z MW. (min). Parent. Product. ion. ion. DP1. FP1. CE1. CXP1. (V). (V). (V). (V). Condition 1 DMEQ-TAD-D32. 36.46. 729.9. 730.5. 468.3. 61. 200. 35. 32. DMEQ-TAD-D22. 36.43. 742.0. 742.6. 468.3. 56. 170. 35. 34. DMEQ-TAD-d7-D32. 36.30. 737.0. 737.6. 468.2. 56. 210. 33. 8. DMEQ-TAD. 22.21. 745.9. 746.5. 468.1. 61. 210. 37. 16. DMEQ-TAD -25(OH)D22. 21.92. 758.0. 758.5. 468.2. 56. 180. 37. 16. DMEQ-TAD. 22.08. 752.0. 752.5. 468.1. 56. 190. 39. 16. RE. 9.73. 286.5. 269.1. 213.4. 21. 80. 19. 14. d6-RE. 9.48. 292.5. 275.2. 192.4. 16. 70. 19. 14. β-carotene. 87.01. 536.9. 537.6. 177.2. 31. 100. 27. 12. d6-β-carotene. 86.24. 542.9. 543.6. 180.2. 31. 110. 25. 12. α-Toc. 38.72. 430.7. 430.4. 165.2. 51. 180. 43. 10. d6-α-Toc. 38.44. 436.7. 436.5. 171.2. 56. 180. 41. 10. PK. 49.15. 450.7. 451.5. 187.1. 41. 140. 33. 12. [18O2]-PK. 49.13. 454.7. 455.4. 191.2. 41. 140. 33. 12. MK-4. 32.72. 444.7. 445.5. 187.3. 21. 80. 31. 12. [18O2]-MK-4. 32.66. 448.7. 449.4. 191.2. 26. 100. 31. 12. MK-7. 86.74. 649.0. 649.7. 187.2. 41. 150. 47. 12. [18O2]-MK-7. 86.67. 653.0. 653.7. 191.1. 36. 130. 43. 12. -25(OH)D32. -d6-25(OH)D32 Condition 2. 1. DP, declustering potential; FP, focusing potential; CE, collision energy; CXP, collision cell exit potential 2 The retention times of the derivatives are those of the 6S-isomer.. - 14 -.
(21) Statistical Analysis. All statistical analyses were performed using JMP statistical software (version 5.0.1 J: SAS Institute Inc, Cary, NC, USA). For cross-sectional analyses, simple regression analysis was performed.. - 15 -.
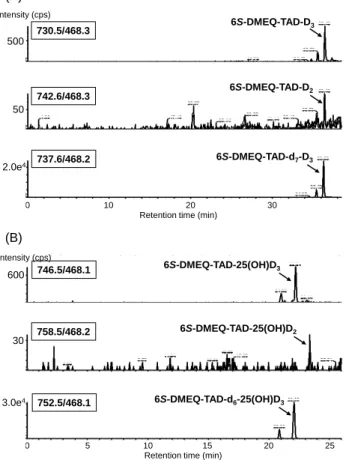
(22) Results Chromatography. LC-MS/MS MRM chromatograms of human breast milk samples after DMEQ-TAD derivatization for the determination of D3, D2, 25(OH)D2 and 25(OH)D3 in Condition 1 are shown in Fig. 2. In the reaction with DMEQ-TAD, vitamin D compounds produce two C6epimeric derivatives. In the case of D3, D2, 25(OH)D3 and 25(OH)D2, the 6S isomer was the main product (6S:6R=3:1). Thus, 6S isomer was used for the determination of each vitamin D compound. The calibration curves of DMEQ-TAD derivatives showed good linearity for D3 (up to 50 ng/mL, r2=0.9999), D2 (up to 50 ng/mL, r2=1.0000), 25(OH)D3 (up to 50 ng/mL, r2=0.9999) and 25(OH)D2 (up to 50 ng/mL, r2=0.9991), respectively. (A) Intensity (cps). 6S-DMEQ-TAD-D3. 730.5/468.3 500. 6S-DMEQ-TAD-D2. 742.6/468.3 50. 2.0e4. 6S-DMEQ-TAD-d7-D3. 737.6/468.2. 0. 10. 20 Retention time (min). 30. (B) Intensity (cps). 746.5/468.1. 600. 758.5/468.2. 30. 3.0e4. 0. 752.5/468.1. 5. 6S-DMEQ-TAD-25(OH)D3. 6S-DMEQ-TAD-25(OH)D2. 6S-DMEQ-TAD-d6-25(OH)D3. 10 15 Retention time (min). 20. 25. Fig. 2 LC-MS/MS MRM chromatograms of human breast milk sample after DMEQ-TAD derivatization for determination of D3 and D2 (A), 25(OH)D2 and 25(OH)D3 (B) in Condition 1. The concentrations of D3, D2, 25(OH)D2 and 25(OH)D3 in this sample are 0.058, 0.005, 0.002 and 0.103 ng/mL, respectively. - 16 -.
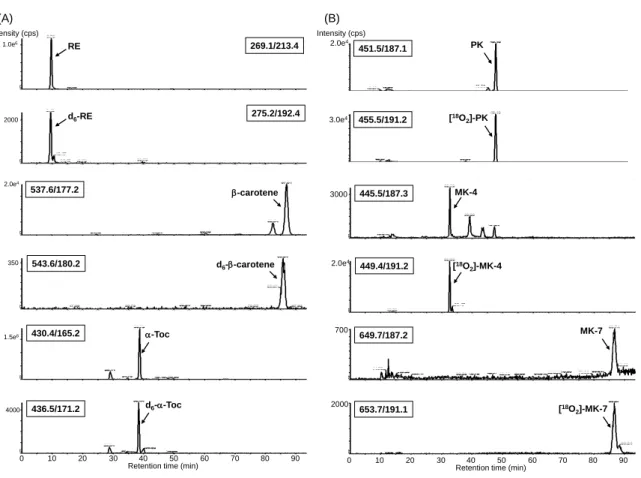
(23) MRM chromatograms of human breast milk sample for the determination of RE, βcarotene, α-Toc, PK, MK-4 and MK-7 in Condition 2 are shown in Fig. 3. Under these conditions, all compounds were successfully detected without interruption of co-eluting compounds in breast milk and interference of their internal standards. The calibration curves showed good linearity for RE (up to 62500 ng/mL, r2=0.9993), β-carotene (up to 2500 ng/mL, r2=0.9989), α-tocopherol (up to 62500 ng/mL, r2=0.9998), PK (up to 2500 ng/mL, r2=1.0000), MK-4 (up to 2500 ng/mL, r2=0.9998) and MK-7 (up to 2500 ng/mL, r2=1.0000), respectively.. (A). (B). Intensity (cps) 1.0e6. RE. 269.1/213.4. 2000. d6-RE. 275.2/192.4. 2.0e4. 537.6/177.2. β-carotene. 350. 543.6/180.2. 1.5e6. 430.4/165.2. α-Toc. 4000. 436.5/171.2. d6-α-Toc. 0. 10. 20. d6-β-carotene. 30. 40 50 60 Retention time (min). Intensity (cps) 2.0e4. 3.0e4. 455.5/191.2. [18O2]-PK. 3000. 445.5/187.3. MK-4. 2.0e4. 449.4/191.2. [18O2]-MK-4. 700. 2000. 70. 80. PK. 451.5/187.1. 90. 0. MK-7. 649.7/187.2. [18O2]-MK-7. 653.7/191.1. 10. 20. 30. 40 50 60 Retention time (min). 70. 80. Fig. 3 LC-MS/MS MRM chromatograms of human breast milk sample for determination of RE, β-carotene and α-Toc (A), PK, MK-4 and MK-7 (B) in Condition 2. The concentrations of RE, β-carotene and α-Toc, PK, MK4 and MK-7 in this sample are 0.244, 0.055 and 2.131 µg/mL, 1.628, 1.462 and 0.344 ng/mL, respectively.. - 17 -. 90.
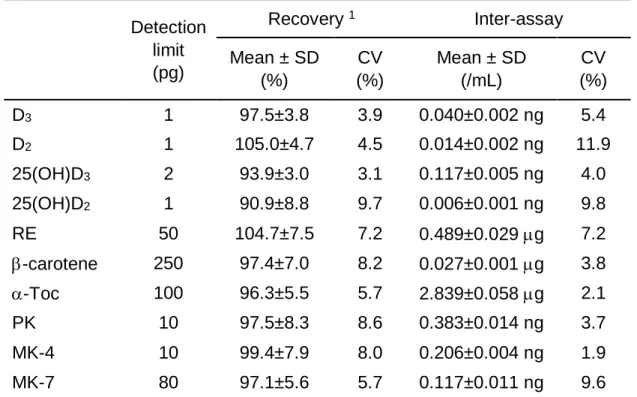
(24) Sensitivity, Recovery and Reproducibility. The detection limits of D3, D2, 25(OH)D3, 25(OH)D2, RE, β-carotene, α-Toc, PK, MK4 and MK-7 based on a signal-to-noise ratio of 3:1, were 1 to 250 pg per injection (Table 2). The recoveries were about 91–105 %. Inter-assay CV values of each vitamin calculated by measurements of pooled human breast milk were 1.9–11.9 %. The sensitivity and overall recovery combined with reproducibility allowed the measurement of fat-soluble vitamins containing vitamins D, A, E and K with 10 mL of breast milk.. Table 2 Accuracy of measurement of fat-soluble vitamins Recovery 1. Inter-assay. Detection limit (pg). Mean ± SD (%). CV (%). Mean ± SD (/mL). CV (%). D3. 1. 97.5±3.8. 3.9. 0.040±0.002 ng. 5.4. D2. 1. 105.0±4.7. 4.5. 0.014±0.002 ng. 11.9. 25(OH)D3. 2. 93.9±3.0. 3.1. 0.117±0.005 ng. 4.0. 25(OH)D2. 1. 90.9±8.8. 9.7. 0.006±0.001 ng. 9.8. RE. 50. 104.7±7.5. 7.2. 0.489±0.029 µg. 7.2. β-carotene. 250. 97.4±7.0. 8.2. 0.027±0.001 µg. 3.8. α-Toc. 100. 96.3±5.5. 5.7. 2.839±0.058 µg. 2.1. PK. 10. 97.5±8.3. 8.6. 0.383±0.014 ng. 3.7. MK-4. 10. 99.4±7.9. 8.0. 0.206±0.004 ng. 1.9. MK-7. 80. 97.1±5.6. 5.7. 0.117±0.011 ng. 9.6. 1. Calculated by measurements of pooled human breast milk spiked with fat-soluble vitamins: D3, 20 ng; D2, 20 ng; 25(OH)D3, 20 ng; 25(OH)D2, 20 ng; RE, 20 µg; β-carotene, 0.6 µg; αToc, 30 µg; PK, 30 ng; MK-4, 20 ng; MK-7, 10 ng/20 mL of human breast milk.. - 18 -.
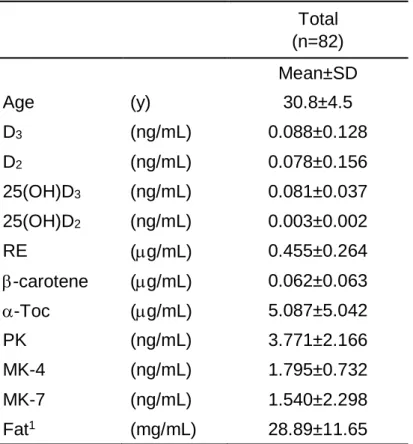
(25) Concentration of Vitamin D and Other Fat-soluble Vitamins in Human Breast Milk. This method was applied to breast milk samples obtained from 82 Japanese lactating mothers. The mean concentration of D3, D2, 25(OH)D3 and 25(OH)D2 were 0.088 (range, 0.010–1.116; median, 0.061) ng/mL, 0.078 (range, 0–1.300; median, 0.021) ng/mL, 0.081 (range, 0.023–0.172; median, 0.078) ng/mL and 0.003 (range, 0–0.012; median, 0.003) ng/mL, respectively. The mean concentration of RE, β-carotene, α-Toc, PK, MK-4 and MK7 were 0.455 (range, 0.097–1.783; median, 0.406) µg/mL, 0.062 (range, 0.002–0.375; median, 0.045) µg/mL, 5.087 (range, 0.387–35.664; median, 3.590) µg/mL, 3.771 (range, 0.953–12.382; median, 3.481) ng/mL, 1.795 (range, 0.720–4.750; median, 1.611) ng/mL and 1.540 (range, 0.074–15.861; median, 1.001) ng/mL, respectively (Table 3).. Table 3 Concentration of fat-soluble vitamins in human breast milk Total (n=82) Mean±SD Age. (y). D3. (ng/mL). 0.088±0.128. D2. (ng/mL). 0.078±0.156. 25(OH)D3. (ng/mL). 0.081±0.037. 25(OH)D2. (ng/mL). 0.003±0.002. RE. (µg/mL). 0.455±0.264. β-carotene. (µg/mL). 0.062±0.063. α-Toc. (µg/mL). 5.087±5.042. PK. (ng/mL). 3.771±2.166. MK-4. (ng/mL). 1.795±0.732. MK-7. (ng/mL). 1.540±2.298. Fat1. (mg/mL). 28.89±11.65. 1. 30.8±4.5. Measured by Röse-Gotlieb method.. - 19 -.
(26) The subjects were stratified into five groups by post-partum days: 0–10, 11–30, 31–90, 91–180 and 181–270 days. The concentrations of many fat-soluble vitamins in human breast milk showed a tendency to decrease as the post-partum days passed (Table 4). The concentrations of 25(OH)D2, RE, β-carotene, and α-Toc in breast milk in the 0–10 day postpartum group were significantly higher than those of the other groups (p<0.05). Fat concentrations were not significantly different between each group.. Table 4 Cross-sectional analyses of fat-soluble vitamins in human breast milk1 Post-partum days. 0–10. 11–30. 31–90. 91–180. 181–270. (n=8). (n=43). (n=18). (n=8). (n=5). Mean±SD. Mean±SD. Mean±SD. Mean±SD. Mean±SD. 27.6±6.3a. 32.0±3.6a. 30.3±4.5a. 30.4±5.6a. 28.6±4.3a. Age. (y). D3. (ng/mL). 0.075±0.046a. 0.103±0.169a. 0.079±0.056a. 0.075±0.079a. 0.035±0.016a. D2. (ng/mL). 0.129±0.076a. 0.073±0.199a. 0.066±0.084a. 0.014±0.005a. 0.181±0.099a. 25(OH)D3. (ng/mL). 0.072±0.047a. 0.085±0.038a. 0.084±0.034a. 0.068±0.037a. 0.073±0.041a. 25(OH)D2. (ng/mL). 0.007±0.003a. 0.003±0.002b. 0.003±0.002b. 0.003±0.003b. 0.003±0.001b. RE. (µg/mL). 1.026±0.398a. 0.418±0.138b. 0.384±0.145b. 0.359±0.219b. 0.267±0.117b. β-carotene. (µg/mL). 0.188±0.112a. 0.059±0.037b. 0.033±0.023b. 0.033±0.031b. 0.043±0.048b. α-Toc. (µg/mL). 16.590±9.635a. 4.079±1.795b. 3.911±1.798b. 3.296±1.962b. 2.454±1.045b. PK. (ng/mL). 5.122±2.561a. 3.938±2.450a. 3.528±1.454a. 2.294±1.220a. 3.409±1.462a. MK-4. (ng/mL). 2.561±1.207a. 1.802±0.664b. 1.785±0.553ab. 1.195±0.343ab. 1.510±0.419b. MK-7. (ng/mL). 3.044±2.901a. 1.675±2.732a. 0.798±0.746a. 1.363±1.292a. 0.917±0.916a. Fat2. (mg/mL). 24.92±11.55a. 32.64±11.52a. 30.24±7.91a. 21.39±14.12a. 20.72±10.08a. 1. Means in the same row bearing different superscripts differ significantly (p<0.05) by Tukey-Kramer HSD test. 2 Measured by Röse-Gotlieb method.. - 20 -.
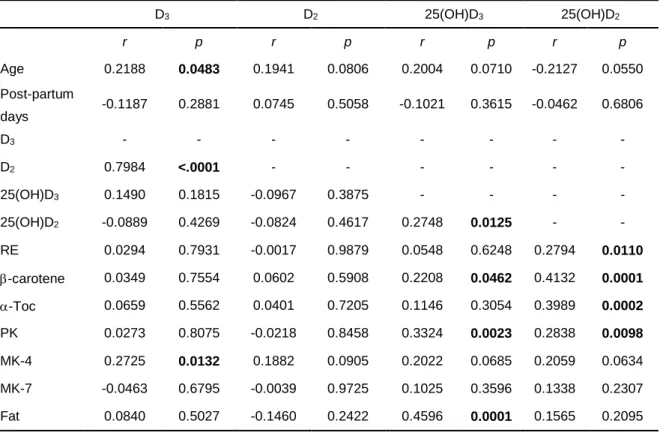
(27) The relations between the concentrations of each fat-soluble vitamin in breast milk and the other parameters are shown in Table 5. Age of lactating mothers correlated significantly and positively with the concentration of D3 in breast milk. The concentration of 25(OH)D3 was positively correlated with β-carotene, PK and fat. The concentration of 25(OH)D2 was also positively correlated with RE, β-carotene, α-tocopherol and PK. It should be noted that correlations between the concentrations of D3 and D2 or 25(OH)D3 and 25(OH)D2 were observed. However, correlations between D and 25(OH)D were not found.. Table 5 Relation between concentrations of vitamin D and metabolites in human milk and the other parameters1 D3. D2. 25(OH)D3. 25(OH)D2. r. p. r. p. r. p. r. p. 0.2188. 0.0483. 0.1941. 0.0806. 0.2004. 0.0710. -0.2127. 0.0550. -0.1187. 0.2881. 0.0745. 0.5058. -0.1021. 0.3615. -0.0462. 0.6806. D3. -. -. -. -. -. -. -. -. D2. 0.7984. <.0001. -. -. -. -. -. -. 25(OH)D3. 0.1490. 0.1815. -0.0967. 0.3875. -. -. -. -. 25(OH)D2. -0.0889. 0.4269. -0.0824. 0.4617. 0.2748. 0.0125. -. -. RE. 0.0294. 0.7931. -0.0017. 0.9879. 0.0548. 0.6248. 0.2794. 0.0110. β-carotene. 0.0349. 0.7554. 0.0602. 0.5908. 0.2208. 0.0462. 0.4132. 0.0001. α-Toc. 0.0659. 0.5562. 0.0401. 0.7205. 0.1146. 0.3054. 0.3989. 0.0002. PK. 0.0273. 0.8075. -0.0218. 0.8458. 0.3324. 0.0023. 0.2838. 0.0098. MK-4. 0.2725. 0.0132. 0.1882. 0.0905. 0.2022. 0.0685. 0.2059. 0.0634. MK-7. -0.0463. 0.6795. -0.0039. 0.9725. 0.1025. 0.3596. 0.1338. 0.2307. Fat. 0.0840. 0.5027. -0.1460. 0.2422. 0.4596. 0.0001. 0.1565. 0.2095. Age Post-partum days. 1. Values listed in bold face showed significant correlation.. - 21 -.
(28) Discussion For the determination of vitamin D, HPLC with ultraviolet detection [16], CPBA [17], RIA [18] and EIA [19] are used widely. However, there are several problems in sensitivity, specificity and accuracy with determination of vitamin D compounds in breast milk because concentrations of them are markedly low. In addition, CPBA, RIA and EIA are unable to distinguish each form of vitamin D. Our proposed method, including two extraction methods and sensitive LC-MS/MS detection using stable isotope-labeled internal standards, makes it possible to determine the principal fat-soluble vitamins in breast milk which contain more interfering compounds compared to plasma or serum samples. D and 25(OH)D could be measured by LC-MS/MS after DMEQ-TAD derivatization with the equivalent of only 6 mL of breast milk. DMEQ-TAD, a reagent originally developed for fluorescence-labeling, is highly sensitive and stable for conjugated dienes [23]. Recently, DMEQ-TAD has been used for the derivatization of vitamin D metabolites to improve ionization efficiency of LC-MS/MS with APCI [22]. In this study, DMEQ-TAD derivatization enhanced the measurement sensitivity of D and 25(OH)D by about 40 times. In addition, other fat-soluble vitamins were also measured sensitively compared to the standard assay methods, HPLC with fluorescence detection for RE [24], tocopherol [25] and vitamin K derivatives [26] and HPLC with visible detection for β-carotene [27]. We applied this method to a nutrition survey for lactating mothers. The mean concentrations of vitamins D were low in breast milk as reported previously [7–10]. The concentrations of 25(OH)D in breast milk [25(OH)D3, 0.081±0.037 ng/mL; 25(OH)D2, 0.003±0.002 ng/mL] were markedly low compared to plasma concentrations of 25(OH)D, which is the most abundant circulating metabolite of vitamin D with a concentration of 2050 ng/mL in normal subjects. In contrast, the concentrations of D in breast milk [D3, - 22 -.
(29) 0.088±0.128 ng/mL; D2, 0.078±0.156 ng/mL] were comparable to 25(OH)D3 although plasma levels of D3 and D2 are normally lower than 25(OH)D (1–5 ng/mL). These are significant correlations between the concentrations of D3 and D2 or 25(OH)D3 and 25(OH)D2; however, correlations between D and 25(OH)D were not found. Fat concentrations also correlated significantly and positively with 25(OH)D3. These results suggest that the rate of secretion of vitamin D compounds from plasma to breast milk may be different depending on their polarity or affinity for plasma protein. Moreover, age of lactating mothers also correlated significantly and positively with the concentration of D3 in breast milk. There is a possibility that higher intake of foods containing vitamin D including fish in older mothers could linked to higher concentration of D3 in breast milk. The amount of biological activity contributed by each vitamin D metabolites was proposed by Reeve et al. [28] as follows: D=1; 25(OH)D=5; 1,25(OH)2D=10; and 24,25(OH)2D=5. Mean content of total vitamin D in breast milk could be calculated using mean concentration of D3, D2, 25(OH)D3 and 25(OH)D2 [D3, 0.088 ng/mL; D2, 0.078 ng/mL; 25(OH)D3, 0.081 ng/mL; 25(OH)D2, 0.003 ng/mL] and Reeve’s conversion factor as approximately 0.6 ng/mL. Suzuki et al. [29] reported that the mean intake of breast milk per day in Japanese breast-fed infants aged 1–5 months old was approximately 780 mL. The average intake of vitamin D in breast-fed infants was estimated to be 0.47 µg/day, which is extremely lower than current Dietary reference Intakes (DRIs) in Japan [adequate intake (AI) of vitamin D for infants 0–5 months, 5 µg/day)]. Thus, supplementation of vitamin D for breast feeding mothers or breastfed infants could be beneficial in improving the vitamin D status of breast fed infants especially during the winter. In this study, post-partum days not correlated significantly with the concentrations of vitamin D in breast milk. Generally, vitamins A and E are high in colostrum, and decreased - 23 -.
(30) and stable in mature breast milk. Sakurai et al. [30] reported that the concentrations of RE, β-carotene and α-Toc in breast milk decreased as the duration of lactation increased; however, clear correlations between the concentration of D3 and the stage of lactation were not observed. Kojima et al. [14] demonstrated that PK and MK-4 concentrations in breast milk were high in colostrum and decreased during the course of lactation. Taken together, these results suggest that the distributions of each fat-soluble vitamin in breast milk might vary according to the duration of lactation and the concentrations of vitamin D in breast milk were not influenced by the stage of lactation unlike vitamins A, E and K. In conclusion, we show a quantification method for fat-soluble vitamins in breast milk by LC-MS/MS. The present method maximizes the sensitivity and selectivity of the latest generation of tandem mass spectrometry and derivatization technique for the measurement of representative compounds of fat-soluble vitamins in human breast milk. The assay includes vitamins with a wide range of polarity, and this method has the advantage of low sample volume requirement. This method can apply the measurement of fat-soluble vitamins in other biological samples such as plasma, and may be useful for nutritional epidemiology studies and the setting of Dietary Reference Intakes of fat-soluble vitamins.. - 24 -.
(31) References [1] M.F. Picciano, Nutrient composition of human milk, Pediatr Clin North Am 48(1) (2001) 53–67. [2] K.G. Dewey, Nutrition, growth, and complementary feeding of the breastfed infant, Pediatr Clin North Am 48(1) (2001) 87–104. [3] F.R. Greer, Do breastfed infants need supplemental vitamins?, Pediatr Clin North Am 48(2) (2001) 415–423. [4] D.V. Edidin, L.L. Levitsky, W. Schey, N. Dumbovic, A. Canpos, Resurgence of nutritional rickets associated with breast-feeding and special dietary practices, Pediatrics 65(2) (1980) 232–235. [5] M. Ala-Houhala, 25-Hydroxyvitamin D levels during breast-feeding with or without maternal or infantile supplementation of vitamin D, J Pediatr Gastroenterol Nutr 4(2) (1985) 220–226. [6] B.L. Specker, B. Valanis, V. Hertzberg, N. Edwards, R.C. Tsang, Sunshine exposure and serum 25-hydroxyvitamin D concentrations in exclusively breast-fed infants, J Pediatr 107(3) (1985) 372–376. [7] A. Takeuchi, T. Okano, N. Tsugawa, M. Katayama, Y. Mimura, T. Kobayashi, S. Kodama, T. Matsuo, Determination of vitamin D and its metabolites in human and cow's milk, J. Micronutrient Anal 4(3) (1988) 193–208. [8] A. Takeuchi, T. Okano, N. Tsugawa, Y. Tasaka, T. Kobayashi, S. Kodama, T. Matsuo, Effects of ergocalciferol supplementation on the concentration of vitamin D and its metabolites in human milk, J Nutr 119(11) (1989) 1639–1646. [9] B.W. Hollis, B.A. Roos, H.H. Draper, P.W. Lambert. Vitamin D and its metabolites in human and bovine milk, J Nutr 111(7) (1981) 1240–1248. [10] H.J. Jan Mohamed, A. Rowan, B. Fong, S.L. Loy, Maternal serum and breast milk vitamin D levels: findings from the Universiti Sains Malaysia Pregnancy Cohort Study, PLoS One 9(7) (2014) e100705. [11] P.A. Lane, W.E. Hathaway, Vitamin K in infancy, J Pediatr 106(3) (1985) 351–359. [12] W.E. Lambert, L. Vanneste, A.P. De Leenheer, Enzymatic sample hydrolysis and HPLC in a study of phylloquinone concentration in human milk, Clin Chem 38(9) (1992) 1743–1748.. - 25 -.
(32) [13] L.M. Canfield, J.M. Hopkinson, A.F. Lima, G.S. Martin, K. Sugimoto, J. Burr, L. Clark, D.L. McGee, Quantitation of vitamin K in human milk, Lipids 25(7) (1990) 406– 411. [14] T. Kojima, M. Asoh, N. Yamawaki, T. Kanno, H. Hasegawa, A. Yonekubo, Vitamin K concentrations in the maternal milk of Japanese women, Acta Pediatr 93(4) (2004) 457–463. [15] D.B. Jelliffe, E.F. Jelliffe, The volume and composition of human milk in poorly nourished communities. A review, Am J Clin Nutr 31(3) (1978) 492–515. [16] G. Jones, Assay of vitamins D2 and D3, and 25-hydroxyvitamins D2 and D3 in human plasma by high-performance liquid chromatography, Clin Chem 24(2) (1978) 287–298. [17] J.G. Haddad, K.J. Chyu, Competitive protein-binding radioassay for 25hydroxycholecalciferol, J Clin Endocrinol Metab 33(6) (1971) 992–995. [18] B.W. Hollis, J.L. Napoli, Improved radioimmunoassay for vitamin D and its use in assessing vitamin D status, Clin Chem 31(11) (1985) 1815–1819. [19] C. Lind, J. Chen, I. Byrjalsen, Enzyme immunoassay for measuring 25hydroxyvitamin D3 in serum, Clin Chem 43(6 Pt 1) (1997) 943–949. [20] N. Tsugawa, Y. Suhara, M. Kamao, T. Okano, Determination of 25-hydroxyvitamin D in human plasma using high-performance liquid chromatography-tandem mass spectrometry, Anal Chem 77(9) (2005) 3001–3007. [21] Y. Suhara, M. Kamao, N. Tsugawa, T. Okano, Method for the determination of vitamin K homologues in human plasma using high-performance liquid chromatographytandem mass spectrometry, Anal Chem 77(3) (2005) 757–763. [22] T. Higashi, D. Awada, K. Shimada, Simultaneous determination of 25hydroxyvitamin D2 and 25-hydroxyvitamin D3 in human plasma by liquid chromatography-tandem mass spectrometry employing derivatization with a Cooksontype reagent, Biol Pharm Bull 24(7) (2001) 738–743. [23] M. Shimizu, S. Kamachi, Y. Nishii, S. Yamada, Synthesis of a reagent for fluorescence-labeling of vitamin D and its use in assaying vitamin D metabolites, Anal Biochem 194(1) (1991) 77–81. [24] C.A. Collins, C.K. Chow. Determination of vitamin A and vitamin A acetate by highperformance liquid chromatography with fluorescence detection, J Chromatogr 317 (1984) 349–354. - 26 -.
(33) [25] V. Piironen, P. Varo, E.L. Syväoja, K. Salminen, P. Koivistoinen. High-performance liquid chromatographic determination of tocopherols and tocotrienols and its application to diets and plasma of Finnish men. I. Analytical method, Int J Vitam Nutr Res 54(1) (1984), 35–40. [26] M. Shino, Determination of endogenous vitamin K (phylloquinone and menaquinonen) in plasma by high-performance liquid chromatography using platinum oxide catalyst reduction and fluorescence detection, Analyst, 113(3) (1988) 393–397. [27] W.A. MacCrehan, E. Schonberger, Determination of retinol, alpha-tocopherol, and beta-carotene in serum by liquid chromatography with absorbance and electrochemical detection, Clin Chem 33(9) (1987) 1585–1592. [28] L.E. Reeve, N.A. Jorgensen, H.F. DeLuca, Vitamin D compounds in cows' milk, J Nutr 112(4) (1982) 667–672. [29] K. Suzuki, S. Sasaki, K. Shinzawa, M. Totani, Milk intake by breast-fed infants before weaning, Jpn J Nutr Diet 62(6) (2004) 369–372. [30] T. Sakurai, M. Furukawa, M. Asoh, T. Kanno, T. Kojima, A. Yonekubo, Fat-soluble and water-soluble vitamin contents of breast milk from Japanese women, J Nutr Sci Vitaminol (Tokyo) 51(4) (2005) 239–247.. - 27 -.
(34) CAPTER 2 Measurement of serum level of 25-hydroxyvitamin D in Japanese adolescent. - 28 -.
(35) Introduction The major roles of Vitamin D are regulation of calcium homeostasis and bone metabolism. Among the vitamin D metabolites, serum 25(OH)D concentration is the best indicator of vitamin D status. Long-term vitamin D insufficiency can cause secondary hyperparathyroidism, which adversely affects bone metabolism in the elderly [1]. Negative correlations between serum 25(OH)D and PTH concentrations in children and adolescents have been reported in Argentina [2], France [3] and other countries [4–7]. However, there is limited evidence regarding the associations between vitamin D status and serum PTH concentration in Japanese adolescents. Serum PTH concentration is known to be regulated not only by vitamin D status, but also by dietary calcium intake [8]. Furthermore, dietary calcium intake in Japanese, including adolescents, is lower than in Europeans and Americans [9, 10]. These information suggest that vitamin D status may be more important for regulating serum PTH concentrations in adolescents with low calcium intake, such as Japanese adolescents. Differences in the importance of vitamin D for bone growth between boys and girls are expected to exist during puberty because of differences in patterns of bone growth. It is known that boys tend to gain greater bone mass and density at a greater speed after age 10 though boys and girls develop bone mass at the same rate before puberty. Girls have a shorter window of time to gain their peak bone mass. However, little is known about sex differences in the associations between vitamin D status and serum PTH concentration and bone metabolism in adolescents. In this study, we measured serum level of 25(OH)D in a large group of Japanese adolescent consisting of Junior and Senior High School students using automated competitive chemiluminescence immunoassay (CLIA) [11]. We provided comparable data - 29 -.
(36) on vitamin D status to allow the establishment of a reference values of serum 25(OH)D concentration or vitamin D intake in adolescents and examined sex differences in the association between serum 25(OH)D concentration and serum PTH concentration or vitamin D intake.. - 30 -.
(37) Materials and methods Subjects. We recruited the adolescents aged 12–18 years (n=1415) through an annual health examination at a Junior and Senior High School located in urban Tokyo. They were all selected from the same Junior and Senior High School. Subjects who had suffered from acute infection or who had chronic diseases such as diabetes mellitus, kidney disease, bone metabolic disease or inheritable metabolic diseases were excluded. Also subjects whose serum parameters could not be measured due to less amount of blood sample were also excluded. Finally, a total of 1,380 healthy adolescents from 1st grade of junior high school (1st JHS) (192 boys and 197 girls, aged 12–13 years), 1st grade of high school (1st HS) (247 boys and 279 girls, aged 15–16 years), and 3rd grade of high school (3rd HS) (223 boys and 242 girls, aged 17–18 years) were enrolled. Health status of the participants was defined based on health history, questionnaire, and serum biochemical parameters. The comprehensive study protocol, including nutritional evaluation, was reviewed by the ethics committee of Kagawa Nutrition University and comprehensive written informed consent was obtained from all participants.. Measurements. Blood samples were obtained in May 2003 and 2004. Fasting blood samples were collected by venipuncture at school in the morning, centrifuged at 1,940 × g for 15 min at 4°C, and the supernatant was stored at −35°C until assayed. Serum 25(OH)D was determined using the LIAISON 25OH Vitamin D TOTAL assay (DiaSorin Inc, Stillwater, MN, USA), which is an automated CLIA [11]. The LIAISON 25OH Vitamin D TOTAL assay is a rapid automated method with first results available in 40 min, and a subsequent - 31 -.
(38) throughput of 180 samples per hour. Circulating level of intact PTH was measured by CLIA (LIAISON® N-TACT® PTH II Assay). Height, weight, and body mass index were measured for all subjects, and they also completed a questionnaire on exercise history, diet, and lifestyle factors. Calcaneal skeletal status was evaluated by quantitative ultrasound (QUS) measurements at the heel, using the Achilles system A-1000 (GE-Lunar, Madison, WI, USA), which measures speed of sound (SOS) in m/s and broadband ultrasound attenuation (BUA) in dB/MHz. The Achilles software was also used to calculate a stiffness index, which is a combination of both BUA and SOS. Calcaneal stiffness Z-score were calculated using Japanese age-matched reference data provided by GE-Lunar (Madison, WI, USA) as follows; Z-score = (calculate a stiffness – reference data) / SD Vitamin D and calcium intake were assessed using a food-frequency questionnaire (FFQ) [12], based on the semi-quantified FFQ developed by the Drafting Committee of the Ministry of Health and Welfare for Health Index. The FFQ has been shown to be a useful tool for evaluating dietary calcium and vitamin D intakes (coefficients of variance of four repeated measurements of intakes throughout 1 year were 14.1% for calcium, 13.6% for vitamin D).. Statistical Analysis. All statistical analyses were performed using statistical software JMP 7.0 J (SAS Institute Inc, Cary, NC, USA). Analysis of variance (ANOVA) was performed to determine the significance of differences in anthropometric parameters, serum 25(OH)D and intact PTH concentrations, and vitamin D and calcium intakes among school grades. Student’s ttests were used to compare parameters between the sexes. - 32 -.
(39) No definite 25(OH)D threshold for defining vitamin D deficiency/insufficiency has yet been established, and the proposed reference value varies among studies [13–15]. The Institute of Medicine of the National Academies in US/Canada recently proposed 50 nmol/L (20 ng/mL) 25(OH)D as a reference value to define vitamin D sufficiency [16]. Based on these reports, we evaluated the frequencies of vitamin D deficiency/insufficiency using the following serum 25(OH)D concentrations: <12.5 nmol/L (<5 ng/mL), severe vitamin D deficiency; 12.5–<25 nmol/L (5–<10 ng/mL), vitamin D deficiency; 25–<50 nmol/L (10– <20 ng/mL), mild vitamin D deficiency; 50–<75 nmol/L (20–<30 ng/mL), vitamin D insufficiency; ≥75 nmol/L (≥30 ng/mL), vitamin D sufficiency. Threshold calcium intake values were based on the recommended daily allowances (RDAs) according to the DRIs for Japanese 2010 [17] (boys: 1000 mg/day (12–14 years), 800 mg/day (15–18 years); girls: 800 mg/day (12–14 years), 650 mg/day (15–18 years)) (<RDA: L-Ca, ≥RDA: H-Ca). Differences in calcaneal stiffness Z-score among the four groups were evaluated by ANOVA and Tukey–Kramer’s honest significant difference test.. - 33 -.
(40) Results The subject characteristics. The subject characteristics are summarized in Table 1. Table 1 Subject characteristics1,2 School grade st. Parameter. All. st. ANOVA rd. 1 JHS. 1 HS. 3 HS. (12–13. (15–16. (17–18. (among age. years). years). years). groups). Boys n Body height (cm). 662 165.3±9.9***. 192 153.8±7.6. 247 169.2±5.9***. 223 171.5±5.4***. <0.001. Body weight (kg). 56.7±12.0***. 45.3±9.0. 59.2±9.4***. 64.7±8.8***. <0.001. 2. BMI (kg/m ). 20.6±3.0. 19.0±2.8. 20.6±2.7. 22.0±2.8***. <0.001. 25(OH)D (nmol/L) Intact PTH (pg/mL). 60.8±18.3*** 39.0±17.1. 58.8±15.5* 44.7±18.1. 61.3±18.5*** 40.1±17.8. 62±19.8*** 32.6±12.8. 0.179 <0.001. Achilles stiffness. 99.2±18.4**. 85.6±11.8***. 100.8±16.1. 109.3±18.3***. <0.001. Achilles Z-score. −0.01±0.16*** −0.05±0.13*** −0.04±0.15***. 0.06±0.18*. <0.001. Vitamin D intake (μg/d). 10.0±2.7. 9.9±2.9. 10.1±2.5. 9.9±2.7. 0.808. Ca intake (mg/d). 554±289***. 555±282. 562±315***. 553±288***. 0.945. 69.7***. 73.9***. 64.5***. 71.9***. 0.071. 69. 73. 74. 58. n Body height (cm). 718 156.9±5.7. 197 153.5±5.4. 279 158.2±5.3. 242 158.1±5.3. <0.001. Body weight (kg). 50.6±7.5. 45.8±7.0. 52.2±7.4. 52.6±6.3. <0.001. BMI (kg/m ). 20.5±2.5. 19.4±2.5. 20.8±2.7. 21.0±2.1. <0.001. 25(OH)D (nmol/L) Intact PTH (pg/mL). 52.8±17.0 38.0±15.4. 55.5±15.0 43.4±17.3. 53.0±16.8 38.8±14.9. 50.3±18.5 32.1±11.8. 0.005 <0.001. Achilles stiffness. 96.4±15.2. 91.4±13.1. 98.5±16.8. 98.1±14.0. <0.001. Achilles Z-score. 0.02±0.16. 0.002±0.14. 0.03±0.17. 0.03±0.15. 0.108. Vitamin D intake (μg/d). 10.1±2.5. 10.2±2.6. 10.0±2.4. 10.1±2.5. 0.783. Ca intake (mg/d). 471±199. 507±221. 459±187. 454±189. 0.01. 48.3. 53.1. 47.5. 44.9. 0.224. 48. 44. 55. 45. Exercise (%) % of outdoor exercise. Girls. 2. Exercise (%) % of outdoor exercise 1 2. Values were calculated as means ± SD. Significant differences between boys and girls are shown with asterisks (*p<0.05, **p<0.001, ***p<0.001).. - 34 -.
(41) Serum 25(OH)D concentrations in boys and girls were 60.8±18.3 nmol/L (24.3±7.3 ng/mL) and 52.8±17.0 nmol/L (21.1±6.8 ng/mL), respectively. Serum 25(OH)D concentrations of girls were significantly lower than those of boys in all age groups.. Distribution of serum 25(OH)D concentration in adolescent. Distribution of serum 25(OH)D concentration in adolescent boys and girls in Fig 1. Approximately 30% of boys and 48% of girls had less than 50 nmol/L of 25(OH)D concentration, and approximately 80% of boys and 90% of girls had less than 75 nmol/L of 25(OH)D concentration. Overall, obvious vitamin D deficiency, defined as serum 25(OH)D concentration <25 nmol/L, was observed in eight boys and 19 girls. There was no significant difference in serum 25(OH)D concentration among school grades in boys, but serum 25(OH)D levels decreased significantly with age in girls (Table 1). In 3rd HS of girls, serum 25(OH)D concentration was 50.3±18.5 nmol/L which was approximately 5 nmol/L lower (B). (A) 60. 49.9% n=330. 40 28.9% n=191. 30 20 10 0. 0.2% n=1 <12.5 <5. 45.0% n=323. 50. 20.1% n=113. Frequency (%). 50 Frequency (%). 60. 40 30 20 10. 1.1% n=7. 42.2% n=303. 10.2% n=73. 2.7% n=19. 0. 12.5 - <25 25 - <50 50 - <75 >=75 (nmol/L) 5 - <10 10 - <20 20 - <30 >=30 (ng/mL). <12.5 12.5 - <25 25 - <50 50 - <75 >=75 (nmol/L) <5 5 - <10 10 - <20 20 - <30 >=30 (ng/mL). 25(OH)D. 25(OH)D. Fig. 1 Distribution of serum 25(OH)D concentration in adolescent boys (A) and girls (B). Vitamin D deficiency/insufficiency was defined using serum 25(OH)D concentration thresholds as follows; <12.5 nmol/L (<5 ng/mL), severe vitamin D deficiency; 12.5–<25 nmol/L (5–<10 ng/mL), vitamin D deficiency; 25–<50 nmol/L (10–<20 ng/mL), mild vitamin D deficiency; 50–<75 nmol/L (20–<30 ng/mL), vitamin D insufficiency; ≥75 nmol/L (≥30 ng/mL), vitamin D sufficiency.. - 35 -.
(42) than concentration of 1st JHS girls, and more than half of girls had less than 50 nmol/L of 25(OH)D concentration. Although vitamin D intake did not differ between boys and girls, serum 25(OH)D concentrations were lower in girls than in boys. On the other hand, exercise habit and the ratio of outdoor exercise were much higher in boys than in girls.. Regression analysis between serum 25(OH)D and intact PTH concentrations. Intact PTH concentration in boys and girls were 39.0±17.1 pg/mL and 38.0±15.4 pg/mL, respectively (Table 1). Intact PTH concentration decreased significantly with age in both boys and girls, with no significant difference between the sexes. Decrements of intact PTH concentration from 1stJHS to 3rdHS in both boys and girls were approximately 10 pg/mL. Although calcaneal stiffness was higher in girls than in boys in 1st JHS (12–13 years), the high rate of bone growth in boys led to a reversal of this phenomenon in 3rd HS (17–18 years). In simple regression analysis, a negative correlation between serum 25(OH)D and PTH concentration was observed in boys (Fig. 2). In girls, however, significant correlation was observed only in 3rd HS. Calcium intake among high school students was higher in boys than in girls (Table 1).. Fig. 2 Simple regression analysis between serum 25(OH)D and intact PTH concentrations in boys (A) and girls in 3rd HS (B). - 36 -.
(43) Regression analysis between serum 25(OH)D and calcaneal stiffness. Negative correlations between serum 25(OH)D and calcaneal stiffness in simple regression analysis were observed in both boys (p=0.029, r2=0.007) and girls (p<0.001, r2=0.049) (Fig. 3).. Fig. 3 Simple regression analysis between serum 25(OH)D and calcaneal stiffness Z score in boys (A) and girls (B).. Associations of vitamin D status and calcium intake with calcaneal stiffness Z-score. Fig. 4 shows the associations of vitamin D status and calcium intake with calcaneal stiffness Z-score. The Z-scores in the H-25(OH)D groups were significantly higher than in the L-25(OH)D groups for boys(Fig. 4A) and girls (Fig. 4B). The difference between L25(OH)D and H-25(OH)D groups was more significant in girls than in boys. Moreover, subgroup analysis identified significant and stronger associations of both vitamin D status and calcium intake in girls compared with boys (Fig.4C, D). These results suggest that calcaneal stiffness might be more susceptible to 25(OH)D concentration and calcium intake in girls than in boys. Also, Fig.4 indicates that vitamin D status has more impact on bone than Ca intake in both sexes.. - 37 -.
(44) Fig. 4 Association between vitamin D status and calcium intake and calcaneal stiffness in boys (A and C) and girls (B and D). Subjects were divided according to serum 25(OH)D concentration and calcium intake. L-25(OH)D and H-25(OH)D; –<50 nmol/L and –≧50 nmol/L serum 25(OH)D concentration, respectively. L-Ca and HCa; –<800 mg/day and –≧800 mg/day calcium intake, respectively. A and B, L25(OH)D and H-25(OH)D groups were compared using Student’s t-test. *p<0.05, ***p<0.001; C and D, Difference in calcaneal stiffness z-score among the four groups were evaluated by ANOVA and Tukey-Kramer’s honest significant difference test. Significant differences are between the groups which are not connected by the same letter (a, b or c). Values given are means and standard errors (SE).. - 38 -.
(45) Discussion We assessed vitamin D status in Japanese adolescents to establish a reference values of serum 25(OH)D concentration. In this study, the mean serum 25(OH)D concentrations in boys and girls were 60.8±18.3 nmol/L (24.3±7.3 ng/mL) and 52.8±17.0 nmol/L (21.1±6.8 ng/mL), respectively. Serum 25(OH)D concentrations in Japanese adolescents were similar to those reported in the US and Europe [3, 4, 8, 18–22], and higher than those in China and India [23–25]. In this study, the serum 25(OH)D concentration in girls was significantly lower than in boys, and decreased significantly with age. However, González-Gross et al. reported that the 25(OH)D concentration was higher in girls than in boys and increased with age [22], while other studies showed a significant reduction in serum 25(OH)D concentration according to increasing age in adolescents [15], or lack of an association between 25(OH)D concentration and age [20]. These inconsistent results in adolescents suggest that region-specific lifestyles may be an important factor influencing 25(OH)D concentration during adolescence. The present study found that serum 25(OH)D concentration was lower in girls than in boys, although vitamin D intake did not differ between boys and girls. One possible explanation for this may be the higher percentage of boys taking exercise, and the higher ratio of outdoor exercise compared with girls. A negative correlation between serum 25(OH)D and PTH concentration was observed in Japanese adolescents, in accordance with other studies [3–7]. A negative correlation between serum 25(OH)D and PTH concentration was observed in boys in all grades tested but only girls in 3rd HS. PTH concentration was more susceptible to serum 25(OH)D concentration in boys than in girls. These results suggest that serum PTH concentration is thought to be a useful marker of vitamin D insufficiency in adolescent Japanese boys aged 12–18 years. In girls, calcium intake had a greater association than serum 25(OH)D - 39 -.
(46) concentration on serum PTH. One possibility is that an extremely low calcium intake (471 ± 199 mg/day) in Japanese adolescents may affect the relationship between PTH and 25(OH)D concentrations. The calcium intake of Japanese girls was approximately one third lower than that of Finnish girls [26]. These results suggest that serum PTH concentration may not be a useful marker of vitamin D insufficiency in girls aged 12–16 years who have a low calcium intake, such as Japanese adolescents. The average vitamin D intake in Japanese adolescents was approximately 10 μg/day. This is two to three times higher than the AI according to the DRIs for the Japanese population (AI: 3.5 μg/day for 12–14-year-olds, 4.5 μg/day for 15–17-year-olds, 5.5 μg/day for 18–29-year-olds) [27]. However, approximately 30% of boys and 48% of girls had a blood concentration less than 50 nmol/L of 25(OH)D. Exposure to sunlight is known as the most important factor affecting serum 25(OH)D concentration. Therefore, the difference in sunlight exposure among subjects would influence serum 25(OH)D concentration. Taken together, higher vitamin D intake or much more sun exposure are needed to improve the status of vitamin D deficiency in Japanese adolescents. The RDA of calcium according to the Dietary Reference Intakes for Japanese 2015 [17] is 1,000 mg/day for 12–14-year-olds and 800 mg/day for 15–18-year-olds in boys, and 800 mg/day for 12–14-year-olds and 650 mg/day for 15–18-year-olds in girls. Thus, the calcium intake of 450–550 mg/day in Japanese adolescents of both sexes was regarded as very low. Improvement of these low calcium status, especially in girls, should be importance for bone health in Japan. Serum 25(OH)D concentration was significantly positively associated with calcaneal stiffness in adolescents. In contrast to the relationship between serum 25(OH)D and PTH concentration, serum 25(OH)D concentration was significantly associated with calcaneal - 40 -.
(47) stiffness in girls of all age groups. The present study also suggested that both vitamin D status and calcium intake would have greater associations with calcaneal stiffness in adolescent girls. The reason why the association between 25(OH)D concentration and calcaneal stiffness was weaker in boys is unclear. After the growth spurt, bone mineral content increments were much higher in boys than in girls [28]. We also observed a much higher increment in calcaneal stiffness in boys. From body height, it could be assumed that ages 12-13 of boys are still in the early stages of puberty while the most of the girls at this age are near menarche. Also it could be assumed that girls reach final height by age 15, but boys don't reach until age 17. Sex differences in these bone growth may therefore be one reason why calcaneal stiffness was hardly affected by 25(OH)D concentration in adolescent boys. To the best of our knowledge, the present study represents the first evaluation of vitamin D status in Japanese adolescents and could thus provide comparable data for establishing reference values of serum 25(OH)D concentration and vitamin D intake. This study is also the first to report a sex difference in the relationships between vitamin D status and PTH concentration and calcaneal stiffness in adolescents. However, the study was a crosssectional study and subjects were recruited from only an urban area in the eastern part of Japan. Further studies involving more subjects of all age groups, from rural as well as urban areas in different parts of the country, are needed to verify the results. Additionally, concentrations of sex hormones and growth hormone and pubertal status would be associated with the sex difference in the relationships between vitamin D status and PTH concentration and calcaneal stiffness. Thus, comprehensive analysis including these hormones and pubertal status are also needed in the future.. - 41 -.
(48) Despite its limitations, the present study was able to conclude that vitamin D deficiency is common in Japanese adolescents. Vitamin D supplementation and sun exposure would be effective in improving vitamin D status in Japanese adolescent. We also confirmed that serum PTH concentration is a useful biomarker of vitamin D deficiency in Japanese adolescents, except in girls aged 12–16 years with low calcium intake. Moreover, the results of present study suggest that vitamin D status has a greater association with calcaneal stiffness in girls than in boys.. - 42 -.
(49) References [1] B. Dawson-Hughes, G.E. Dallal, E.A. Krall, S. Harris, L.J. Sokoll, G. Falconer,. Effect. of vitamin D supplementation on wintertime and overall bone loss in healthy postmenopausal women, Ann Intern Med 115(7) (1991) 505–512. [2] M.B. Oliveri, M. Ladizesky, C.A. Mautalen, A. Alonso, L. Martinez, Seasonal variations of 25-hydroxyvitamin D and parathyroid hormone in Ushuaia (Argentina), the southernmost city of the world, Bone Miner 20(1) (1993) 99–108. [3] J. Guillemant, P. Taupin, H.T. Le, N. Taright, A. Allemandou, G. Pérès, S. Guillemant, Vitamin D status during puberty in French healthy male adolescents, Osteoporos Int 10 (3) (1999) 222–225. [4] T.A. Outila, M.U. Kärkkäinen, C.J. Lamberg-Allardt, Vitamin D status affects serum parathyroid hormone concentrations during winter in female adolescents: associations with forearm bone mineral density, Am J Clin Nutr 74(2) (2001) 206–210. [5] L. Harkness, B. Cromer, Low levels of 25-hydroxy vitamin D are associated with elevated parathyroid hormone in healthy adolescent females, Osteoporos Int 16(1) (2005) 109–113. [6] C.V. Harinarayan, T. Ramalakshmi, U.V. Prasad, D. Sudhakar, P.V. Srinivasarao, K.V. Sarma, E.G. Kumar, High prevalence of low dietary calcium, high phytate consumption, and vitamin D deficiency in healthy south Indians, Am J Clin Nutr 85(4) (2007) 1062– 1067. [7] T.R. Hill, A.A. Cotter, S. Mitchell, C.A. Boreham, W. Dubitzky, L. Murray, J.J. Strain, A. Flynn, P.J. Robson, J.M. Wallace, M. Kiely, K.D. Cashman, Vitamin D status and parathyroid hormone relationship in adolescents and its association with bone health parameters: analysis of the Northern Ireland Young Heart's Project, Osteoporos Int 21(4) (2009) 695–700. [8] M.U. Kärkkäinen, J.W. Wiersma, C.J. Lamberg-Allardt, Postprandial parathyroid hormone response to four calcium-rich foodstuffs, Am J Clin Nutr 65(6) (1997) 1726– 1730. [9] T. Hirota, T. Kusu, K. Hirota, Improvement of nutrition stimulates bone mineral gain in Japanese school children and adolescents, Osteoporos Int 16(9) (2005) 1057–1064.. - 43 -.
(50) [10] The National Health and Nutrition Survey Japan (2007). http://www.nih.go.jp/eiken/ english/index.htm. [11] D.L. Ersfeld, D.S. Rao, J.J Body, J.L. Sackrison Jr., A.B. Miller, N. Parikh, T.L. Eskridge, A. Polinske, G.T. Olson, G.D. MacFarlane, Analytical and clinical validation of the 25 OH vitamin D assay for the LIAISON automated analyzer, Clin Biochem 37(10) (2004) 867–874. [12] K. Uenishi, H. Ishida, K. Nakamura, Development of a simple food frequency questionnaire to estimate intakes of calcium and other nutrients for the prevention and management of osteoporosis, J Nutr Sci Vitaminol (Tokyo) 54(1) (2008) 25–29. [13] M.F. Holick, N.C. Binkley, H.A. Bischoff-Ferrari, C.M. Gordon, D.A. Hanley, R.P. Heaney, M.H. Murad, C.M. Weaver, Evaluation, treatment, and prevention of vitamin D deficiency: an Endocrine Society clinical practice guideline, J Clin Endocrinol Metab 96(7) (2011) 1911–1930. [14] C.J. Rosen, Vitamin D insufficiency, N Engl J Med 364(3) (2011) 248–254. [15] M. Absoud, C. Cummins, M.J. Lim, E. Wassmer, N. Shaw, Prevalence and Predictors of Vitamin D Insufficiency in Children: A Great Britain Population Based Study. PlosOne 6(7) (2011), e22179. [16] A.C. Ross, J.E. Manson, S.A. Abrams, J.F. Aloia, P.M. Brannon, S.K. Clinton, R.A. Durazo-Arvizu, J.C. Gallagher, R.L. Gallo, G. Jones, C.S. Kovacs, S.T. Mayne, C.J. Rosen, S.A. Shapses, The 2011 report on dietary reference intakes for calcium and vitamin D from the Institute of Medicine: what clinicians need to know, J Clin Endocrinol Metab 96(1) (2011) 53–58. [17] K. Uenishi, Y. Ishimi, K. Nakamura, H. Kodama, T. Esashi, Dietary Referemce Intakes for Japanese 2010: Macrominerals, J Nutr Sci Vitaminol (Tokyo) 59(suppl) (2013) S83–S90. [18] F.L. Weng, J. Shults, M.B. Leonard, V.A. Stallings, B.S. Zemel, Risk factors for low serum 25-hydroxyvitamin D concentrations in otherwise healthy children and adolescents, Am J Clin Nutr 86(1) (2007) 150–158. [19] A.C. Looker, C.M. Pfeiffer, D.A. Lacher, R.L. Schleicher, M.F. Picciano, E.A. Yetley, Serum 25-hydroxyvitamin D status of the US population: 1988-1994 compared with 2000-2004, Am J Clin Nutr 88(6) (2008) 1519–1527.. - 44 -.
(51) [20] Y. Dong, N. Pollock, I.S. Stallmann-Jorgensen, B. Gutin, L. Lan, T.C. Chen, D. Keeton, K. Petty, M.F. Holick, H. Zhu, Low 25-hydroxyvitamin D levels in adolescents: race, season, adiposity, physical activity, and fitness, Pediatrics 125(6) (2010) 1104–1111. [21] A.J. Rovner, K.O. O'Brien, Hypovitaminosis D among healthy children in the United States: a review of the current evidence, Arch Pediatr Adolesc Med 162(6) (2008) 513– 519. [22] M. González-Gross, J. Valtueña, C. Breidenassel, L.A. Moreno, M. Ferrari, M. Kersting, S. De Henauw, F. Gottrand, E. Azzini, K. Widhalm, A. Kafatos, Y. Manios, P. Stehle, Vitamin D status among adolescents in Europe: the Healthy Lifestyle in Europe by Nutrition in Adolescence study, Br J Nutr 107(5) (2012) 755–764. [23] K. Zhu, Q. Zhang, L.H. Foo, A. Trube, G. Ma, X. Hu, X. Du, C.T. Cowell, D.R. Fraser, H. Greenfield, Growth, bone mass, and vitamin D status of Chinese adolescent girls 3 y after withdrawal of milk supplementation, Am J Clin Nutr 83(3) (2006) 714–721. [24] X. Du, H. Greenfield, D.R. Fraser, K. Ge, A. Trube, Y. Wang, Vitamin D deficiency and associated factors in adolescent girls in Beijing, Am J Clin Nutr 74(4) (2001) 494– 500. [25] R.K. Marwaha, N. Tandon, D.R. Reddy, R. Aggarwal, R. Singh, R.C. Sawhney, B. Saluja, M.A. Ganie, S. Singh, Vitamin D and bone mineral density status of healthy schoolchildren in northern India, Am J Clin Nutr 82(2) (2005) 477–482. [26] Lehtonen-Veromaa MK, Möttönen TT, Nuotio IO, Irjala KM, Leino AE, Viikari JS (2002) Vitamin D and attainment of peak bone mass among peripubertal Finnish girls: a 3-y prospective study. Am J Clin Nutr 76: 1446–1453. [27] K. Tanaka, J. Terao, Y. Shidoji, H. Tamai, E. Imai, T. Okano, Dietary Reference Intakes for Japanese 2010: Fat-Soluble vitamins, J Nutr Sci Vitaminol (Tokyo) 59(suppl) (2013) S57–S66. [28] S. Krabbe, C. Christiansen, P. Rødbro, I. Transbøl, Effect of puberty on rates of bone growth and mineralization: with observations in male delayed puberty, Arch Dis Child 54(12) (1979) 950–953.. - 45 -.
(52) PART 2 Identification of novel metabolites of vitamin D. CAPTER 1 Identification of C-3 epimers of native vitamin D. - 46 -.
図
+7


関連したドキュメント
Let C be a co-accessible category with weak limits, then the objects of the free 1 -exact completion of C are exactly the weakly representable functors from C
Since the residues of planes are desarguesian for the buildings and the A 7 -geometry, in order to establish the conjecture, we have to eliminate any flag-transitive C 3 - geometry
Then, since S 3 does not contain a punctured lens space with non-trivial fundamental group, we see that A 1 is boundary parallel in V 2 by Lemma C-3 (see the proof of Claim 1 in Case
We also examine the q-partial fraction content of reciprocals of the cyclo- tomic polynomials, and indicate how the technique can be used to facilitate the extraction of
・大都市に近接する立地特性から、高い県外就業者の割合。(県内2 県内2 県内2/ 県内2 / / /3、県外 3、県外 3、県外 3、県外1/3 1/3
The steepness of the LDO’s output voltage rise (soft−start time) is not affected by using of C EN capacitor. 3) Value of the C EN capacitor could be in range from 0 to
The steepness of the LDO’s output voltage rise (soft−start time) is not affected by using of C EN capacitor. 3) Value of the C EN capacitor could be in range from 0 to
静岡大学 静岡キャンパス 静岡大学 浜松キャンパス 静岡県立大学 静岡県立大学短期大学部 東海大学 清水キャンパス
