Structural Study on Hydrocarbon Ionomer
Membranes for Improving Their Fuel Cell
Performance
A Doctoral Thesis
Presented to
Special Doctoral Program for Green Energy Conversion Science
and Technology
Interdisciplinary Graduate School of Medicine and Engineering
University of Yamanashi
March 2016
Chapter 1 General Introduction
1.1 Background ··· 1
1.2 Polymer Electrolyte Fuel Cells ··· 2
1.3 Factor Responsible for PEFC Performances ··· 5
1.4 Proton conducting Ionomer Membranes ··· 7
1.4.1 Role and Issue of Ionomer Membranes in PEFC ··· 7
1.4.2 Perfluorosulfonic Acid and Aromatic Hydrocarbon Ionomer Membranes ·· 9
1.5 Objective of This Research ··· 13
References ··· 14
Chapter 2 Properties and Morphological Analyses of Perfluorosulfonic Acid and Aromatic Hydrocarbon Ionomer Membranes 2.1 Introduction ··· 17
2.2 Experimental ··· 18
2.3 Results and Discussion ··· 22
2.3.1 Water Uptake and Proton Conductivity ··· 22
2.3.2 Nonfreezing- and Weakly Bound Water in Ionomer Membranes ··· 25
2.3.3 Morphology of Ionomer Membranes (TEM) ··· 27 2.3.4 Morphological Changes with Humidity of Ionomer Membranes (SAXS) 29
Chapter 3 Effect of Interlayer Between Hydrocarbon Ionomer Membrane and Catalyst Layer on Fuel Cell Performance
3.1 Introduction ··· 38
3.2 Experimental ··· 39
3.3 Results and Discussion ··· 43
3.3.1 Characterization of Double-Layer Ionomer Membrane ··· 43
3.3.2 Water Uptake and Proton Conductivity ··· 45
3.3.3 Electrochemical Investigations of Double-Layer Ionomer Membrane ··· 46
3.3.4 Fuel Cell Performance of Double-Layer Ionomer Membrane ··· 48
3.4 Conclusion ··· 55
References ··· 56
Chapter 4 Preparation and Characterization of Partially Fluorinated Ionomer Membrane for Improving Interface with Catalyst Layer 4.1 Introduction ··· 57
4.2 Experimental ··· 58
4.3 Results and Discussion ··· 61
4.3.4 Electrochemical Investigations of SPAF Membrane ··· 69
4.3.5 Fuel Cell Performance of SPAF Membrane ··· 72
4.4 Conclusion ··· 77
References ··· 78
Chapter 5 General Conclusions and Future Prospects 5.1 General Conclusions ··· 79
5.2 Future Prospects ··· 82
List of publications ··· 85
Meeting abstracts ··· 86
- 1 -
Chapter 1
General Introduction
1.1 Background
Our life has been changed comfortably due to a lifestyle based on large-scale production and consumption which greatly rely on the fossil fuels. However, large consumption of fossil energies has raised serious environmental problems such as global warming and depletion of fossil fuels. In Japan, the catastrophic accident at Fukushima nuclear power plant in 2011 led to concerns on the safety of nuclear power generation. Therefore, the shift from fossil fuels and nuclear power to renewable energies such as solar, hydro, wind and geothermal power generations are strongly required. Since such renewable energies are, however, unstable and their systems are located in a remote area, hydrogen attracts more attention as candidate for the storage and transportation of energies produced from renewable energy sources in order to effectively use the energy ubiquitously.1 Hydrogen is available by various ways such as reforming of fossil fuels, residual products in industrial process, biomass, and electrolysis of water.2 In such situation, fuel cells are attractive as energy conversion devices using hydrogen.
Fuel cells are devices that directly produce electric power by means of electrochemical reaction of oxygen (in air) and fuels. While hydrogen is commonly used as fuels, fuels are not limited because of various production way of hydrogen as described above. The fuel cells can be classified to polymer electrolyte fuel cells
- 2 -
(PEFCs), phosphoric acid fuel cells (PAFCs), molten carbonate fuel cells (MCFCs), and solid oxide fuel cells (SOFCs). While the PEFCs are often distinguished by their fuels, the PEFCs are defined as those using hydrogen as a fuel in this study. When hydrogen is used as fuel, the only by-product is water. Thus fuel cells are essentially zero-emission devices. Moreover, since fuel cells have a lot of advantages: compact, highly efficient, silent and highly reliable on a long-term basis, some types of fuel cells have been already commercialized. In 2009, stationary fuel cell system called “ENE-FARM” has started to be sold as the residential co-generation fuel cell system (CG-FC) which produces electric power and heat at the same time, by electric manufacturers (Panasonic Co., Ltd. and Toshiba Co., Ltd.) and energy companies (Tokyo Gas Co., Ltd., Osaka Gas Co., Ltd. and JX Nippon Oil & Energy Co., Ltd.), and have been received a broad attention. In 2014, Toyota Motor Co, Ltd. started to sell fuel cell vehicle (FCV) named “MIRAI” as the next generation car for the first time as mass-produced around the world.
1.2 Polymer Electrolyte Fuel Cells
Polymer electrolyte fuel cells (PEFCs) have attracted attentions and have been most researched among the several kinds of fuel cells. PEFCs are used for the CG-FCs and FCVs due to their features such as high power density, quick start-up, low operating temperature (from ambient temperature to 100 °C), and easy maintenance.3,4 Low operating temperature enables wide choices of constituent materials and accordingly cost down. In the PEFCs, membrane electrode assemblies (MEAs) are generally composed of a polymer electrolyte and two electrodes, including catalyst layer (CL) and
- 3 -
gas diffusion layer (GDL), as described in Figure 1-1. At present, proton exchange membranes (PEMs) are widely used as polymer electrolytes than anion exchange membranes (AEMs). The CL has typically consisted of Pt-based catalyst (ca. 1-5 nm in diameter), carbon support (ca. 30-40 nm in diameter), and electrolyte ionomer as proton-conductive binder, where the Pt nanoparticles are highly distributed on the carbon support and the carbon supported Pt catalysts are covered with thin ionomer layer (ca. < 5 nm in thickness) as shown in Figure 1-2. The GDL is porous support medium for gas diffusion and electron conduction, and typically made from carbon paper. The GDLs on CL sides are often water-repellent treated by coating micro porous layer (MPL) containing polytetrafluoroethylene (PTFE) covered carbon powders to control water management in the electrode.5 A single cell consists of an MEA, each two of gaskets, conductive separators (generally made from graphite or metal), current collector plates, and endplates. The electron conductive separators are equipped with gas flow channels such as single-, multi-serpentine or parallel channels.5 Since the potential of a single cell could be up to only 1.23 V, several hundreds of the single cells are stacked for high output in the applications to GC-FCs and FCVs.
In the PEFCs, the fuel cell reactions involve hydrogen oxidation reaction (HOR) at the anode and oxygen reduction reaction (ORR) at the cathode as described in Figure
1-1. Supplied hydrogen is oxidized to protons and electrons on the anode catalyst, and
subsequently protons and electrons move to the cathode via ionomers (membrane and binder) and electronic conductors (carbon support, GDL and external circuit), respectively. Supplied oxygen in the cathode is reduced to water by protons and electrons transferred from the anode on the triple phase boundary on the cathode CL where gas, ions, and electrons meet (Figure 1-2). Generated water in the cathode CL is
- 4 -
evacuated to the outside with cathode exhausted gas (air) or back-diffused into the membrane in accordance with the concentration gradient of water though the MEA.
Figure 1-1. Schematic of typical membrane electrode assembly (MEA) for polymer
electrolyte fuel cells (PEFCs)
Figure 1-2. Schematic of triple phase boundary on a cathode catalyst layer. Dashed
lines are corresponding to the mass transport pathway for proton (blue), electron (orange), and oxygen (green).
- 5 -
1.3 Factors Responsible for PEFC Performances
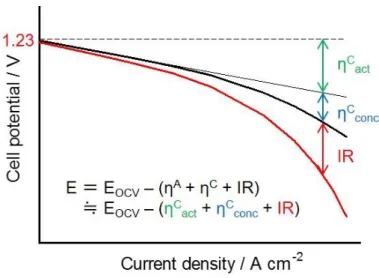
The cell potential (E) under fuel cell operating conditions (loading current conditions) is dependent on open-circuit voltage (OCV, EOCV = 1.23 V), both of anodic
and cathodic overpotentials, and ohmic (IR) loss as described in Figure 1-3. The anodic overpotential (ηA) is negligible when hydrogen is used as fuel due to fast kinetics of hydrogen oxidation reaction on platinum and high diffusivity of hydrogen. Therefore, the IR loss and the cathodic overpotential (ηC) consisting of activation overpotential (ηCact) and concentration overpotential (ηCconc) are main factors responsible for the fuel
cell performances. The ηCact and ηCconc are generally dominated by catalytic activity for
the ORR and mass transport (proton, electron, and oxygen) in the cathode, respectively. The ηCact for the ORR in an acidic environment at the Pt cathode is large, due to the
slow kinetics of the ORR. The mass activity (MA) of a Pt-based catalyst in acid electrolyte solutions for the ORR is defined as follows:
MA (A gPt-1) = js (A m-2) × ECSA (m2 gPt-1) (Eq. 1-1)
where, js is the specific activity (current density per active surface area) for the ORR and ECSA is the electrochemically active surface area. It has been reported for planar electrodes in acid electrolyte solutions that the js values were enhanced at Pt alloyed with transition metals such as Fe,6,7 Co,6-8 Ni,6-8 Mn,6 Cr,8 and V.9 Assuming spherical catalyst particles, the ECSA is inversely proportional to the particle diameter. In order to increase the ECSA, some preparation methods of the Pt-based catalysts with small particle size and its narrow distribution have been developed.
The ηCconc generally increases with an insufficient mass supply (mainly oxygen) and
dissipation of the product water in the cathode. In order to mitigate the ηCconc, the effect
- 6 -
diameter of the GDL,13,14 and flow field designs have been investigated.5 The fuel cell operating conditions such as temperature, gas flow rate, and back-pressure have also been investigated mostly by automotive companies.
The IR loss corresponds to the ohmic resistance of the electrodes, electrolytes, and separators. When the IR loss is measured as high frequency resistance (HFR), proton transport resistance in the polymer electrolyte membrane is dominant. In order to decrease the membrane resistance, the improvement of proton conductivity and the decreasing of membrane thickness are preferable. The detailed relationship between membrane properties and membrane resistance is described in the next section.
Figure 1-3. Relationship of activation and concentration overpotentials and IR loss in
- 7 -
1.4 Proton Conducting Ionomer Membranes
1.4.1 Role and Issue of Ionomer Membranes in PEFCs
The proton-conductive ionomer membranes play a number of roles in PEFCs such as proton transportation, water permeation, gas barrier, electron insulation, and stability (mechanical, chemical, dimensional, and thermal) in an MEA under fuel cell operating conditions. For the membrane properties, the target values for automotive applications have been proposed by fuel cell commercialization conference of Japan (FCCJ)15,16 and these are summarized in Table 1-1. Moreover, their cost reduction, good handling, and improvement of quality are also important for industrial use. At present, the ionomer membranes that fulfill all of the target values have not been obtained. Therefore, the development of high performance ionomer membranes with general versatility is required. The proton conductivity can be considered as the most essential membrane property in the fuel cell performance. For the proton transport in the ionomer membranes, three types of mechanisms (Surface, Grotthuss and vehicle mechanisms)
17,18
have been suggested as described in Figure 1-4. The surface and Grotthuss mechanisms are based on hopping processes of proton mediated by sulfonic acid groups and intermediate water molecules. The vehicle mechanism is based on molecular diffusion process of hydrated proton (hydronium ion with several water molecules). These proton transport processes depend on water content in the membrane. When the number of water molecules per sulfonic acid groups (λ) is greater than 4, the proton transport by the Grotthuss process could become dominant and the activation energy for proton transport drops with increasing of hydrogen bond at higher water content.19,20 Therefore, it is important to obtain a deep insight on water uptake property of the ionomer membranes and the interaction of water molecules with sulfonic acid groups
- 8 -
for the development of the ionomers with high proton conductivity. It should be noted that the excessive hydration causes the deteriorated mechanical and dimensional stability of the membrane.
- 9 -
Figure 1-4. Proton transport mechanisms in the ionomer membrane.
1.4.2 Perfluorosulfonic Acid and Aromatic Hydrocarbon Ionomer Membranes
Perfluorosulfonic acid (PFSA) ionomer membranes such as Nafion (Du Pont) have been commonly used as the polymer electrolyte membranes for PEFCs due to their excellent proton conductivity at wide range of humidity, and mechanical, chemical, and dimensional stability.21,22 The chemical structures of typical commercially available PFSA ionomers are composed of hydrophobic polytetrafluoroethylene (PTFE) main chain and hydrophilic pendant side chains of PFSA groups as shown in Figure 1-5. Since the sulfonic acid groups located in the terminals of the side chains are not cross-linked and thus have high mobility in the polymer matrix, the hydrophilic and hydrophobic components are separated each other which leads to the formation of unique phase-separated morphology. Gierke et al. have suggested ionic cluster model21
- 10 -
as described in Figure 1-6, which have been also supported by morphological analyses using transmission electron microscopy (TEM), and small-angle X-ray or neutron scattering (SAXS and SANS, respectively) techniques.23-25 In that model, it is considered that the protons and water molecules are transferred through these ionic clusters, which results in high proton conductivity for the PFSA ionomers. However, these morphological analyses have not been carried out under conditions relevant to the actual fuel cell operation. Moreover, there are still other issues associated with the PFSA ionomer membranes. High gas permeability is the one of the weak point for the PFSA ionomers, which causes direct reaction of cross-over hydrogen and oxygen at the electrodes and produce the hydrogen peroxide that can chemically decompose the ionomers.26 This would be more crucial for the thinner membranes, which are preferable for low membrane resistance in fuel cell operating conditions. Low thermal stability is also a big issue for the PFSA ionomers. Glass transition temperature (Tg, softening
point) of the PFSA ionomers is ca. 120 °C under dry conditions, above which the mechanically stability may be significantly decreased. While PFSA-based composite membrane with inorganic compounds are claimed to exhibit improved Tg up to ca.
130-140 °C, even higher temperature is required as the target value in 2015-2020 by proposed by FCCJ (Table 1-1). In order for wide spread use of the PEFCs as commercial products, the cost should be reduced from $1000/m2 (present) to $10/m2 (final target). Therefore, there has been a great demand for alternative ionomer membranes that can potentially overcome these issues. One of the most studied alternatives is aromatic hydrocarbon (HC) ionomers.
Sulfonated HC ionomers have many advantages for these issues; easy modification of chemical structure, wide variety of chemical compositions, low gas permeability, and
- 11 -
high thermal stability. A number of HC ionomers such as poly(arylene ether)s, polyimides, polybenzimidazoles, and poly(phenylene)s have been extensively investigated.27,28 Some of them exhibited comparable or higher proton conductivity than that of the PFSA ionomers but the conductivity was more dependent on the humidity. In most cases, the proton conductivity of the HC ionomers was lower than that of the PFSA ionomers under low humidity conditions. In order to improve the proton conductivity of the HC ionomers at low humidities, the introduction of superacid groups, composites membrane, and block copolymer structure have been investigated. It was reported that stronger acids were better for proton conductivity due to easier dissociation of acid groups available for proton conduction. However, described acid dissociation constant (pKa) of the HC ionomers were pKa = ca. -1 which was much
lower than that (pKa = -6) of the PFSA ionomers. Introduction of the pendant superacid
groups into the HC polymers contributed to the improved proton conductivity.29-32 PFSA-based composite membranes with Pt and/or inorganic compounds such as silica, titania, zirconia, and tungsten oxides have also been investigated as discussed above, which improved water uptake, water permeability, dimensional and thermal stability of the composite membranes. However, these approached were not so effective on the proton conductivity for the HC-based membranes compared with those of PFSA-based ones.33,34 Previous HC ionomer membranes that have random copolymer structure exhibited lower proton conductivity than that of the PFSA ionomers due to poor proton pathway in the HC ionomers. In order to promote hydrophilic/hydrophobic phase-separation for the HC ionomers, block copolymer structures have been investigated.35-37 The multiblock copolymers exhibited significantly improved proton conductivity and its smaller dependence on humidity compared with random
- 12 -
copolymers due to well developed phase-separated morphology for the block copolymer.
Figure 1-5. Molecular structure of Perfluorosulfonic acid ionomers.
- 13 -
1.5 Objective of This Research
As described in the last section, aromatic hydrocarbon (HC) ionomer membranes are greatly demanded as alternatives of the perfluorosulfonic acid (PFSA) ionomers used for the harder fuel cell operating conditions required for next generation. However, it has not been particularly understood yet on the hydration process, interaction of water with polymer components, morphological changes with humidity for the HC ionomer membranes, and the differences in these behavior with the PFSA ionomers. In chapter 2, detailed and multilateral analyses were carried out for HC multiblock copolymer membranes and compared with those of the PFSA ionomer membranes under the conditions similar to actual fuel cell operation for high performance HC ionomer membranes.
Moreover, the reason of the lower fuel cell performances, especially cathode catalytic performance, using the HC block copolymers compared with those using the PFSA ionomer membranes even though the same electrodes were employed, will be discussed. The cathode catalytic performance for the oxygen reduction reaction (ORR) could be reflected by the membrane properties. Then the interfacial structure between the ionomer membrane and the cathode catalyst layer is focused in chapter 3. The interfacial structure was modified for the HC membrane and the fuel cell performance was compared with that of the PFSA ionomer membranes.
In chapter 4, I summarize the results from chapter 2 and 3, and discuss newly designed ionomer membrane for high performance fuel cells. The results will give us the new insight in the HC ionomer membranes, which leads to suitable design of the membrane electrode assembly (MEA).
- 14 -
References
(1) Hydrogen energy handbook published by Iwatani Co., Ltd.: http://www.iwatani.co.jp/jpn/h2/pdf/hydrogen_handbook.pdf
(2) New Energy and Industrial Technology Development Organization (NEDO) hydrogen energy white paper published by NEDO:
http://www.nedo.go.jp/library/suiso_ne_hakusyo.html
(3) L. Carrette, K. A. Friedrich and U. Stimming, Fuel Cells 2001, 1, 5-39. (4) H. P. Dhar, J. Electroanal. Chem. 1993, 357, 237-250.
(5) H. Li, Y. Tang, Z. Wang, Z. Shi, S. Wu, D. Song, J. Zhang, K. Fatih, J. Zhang, H. Wang, Z. Liu, R. Abouatallh, A. Mazza, J. Power Sources 2008, 178, 103-117. (6) S. Mukerjee, S. Srinivasan, M. P. Soriage, J. McBreen, J. Electrochem. Soc. 1995,
142, 1409-1422.
(7) T. Toda, H. Igarashi, H. Uchida, M. Watanabe, J. Electrochem. Soc. 1999, 146, 3750-3756.
(8) S. Mukerjee, S. Srinivasan, J. Electroanal. Chem. 1993, 357, 201-224.
(9) E. Antolini, R. R. Passos, E. A. Ticianelli, Electrochim. Acta 2002, 48, 263-270. (10) S. Park, J.-W. Lee, B. N. Popou, Int. J. Hydrog. Energy 2012, 37, 5850-5865. (11) J. H. Chun, K. T. Park, D. H. Jo, J. Y. Lee, S. G. Kim, S. H. Park, E. S. Lee, J. Y.
Jyoung, S. H. Kim, Int. J. Hydrog. Energy 2011, 36, 8422-8428.
(12) S. Hirakata, M. Hara, K. Kakinuma, M. Uchida, D. A. Tryk, H. Uchida, M. Watanabe, Electrochim. Acta 2014, 120, 240-247.
(13) H.-S. Chu, C. Yeh, F. Chen, J. Power Sources 2003, 123, 1-9.
(14) S. Hirakata, T. Mochizuki, M. Uchida, H. Uchida, M. Watanabe, Electrochim.
- 15 -
(15) A. Iiyama, S. Iguchi, A. Daimaru, K. Shinohara, ‘Objectives, R&D Challenge
Topics and Proposed Evaluation Methods for Polymer Electrolyte Fuel Cells’,
FCCJ, 2007.
(16) A. Iiyama, K. Shinohara, S. Iguchi, A. Daimaru, Fuel cells 2009, 6, 905-916. (17) C. J. D. van Grotthuss, Ann. Chem. 1806, 58, 54.
(18) K. D. Kreuer, A. Rebenau, W. Weppner, Angew. Chem. Int. Ed. 1982, 21, 208. (19) K. D. Kreuer, Chem. Mater. 1996, 8, 610.
(20) K. D. Kreuer, S. J. Paddison, E. Spohr, M. Schuster, Chem. Rev. 2004, 104, 910. (21) T. D. Gierke, J. S. Kim, Perfluorinated Ionomer Membranes in ACS Symposium
Series, ed. by A. Eisenberg, H. L. Yeager, American Chemical Society,
Washington DC, 1982, 180
(22) A. Eisenberg, J. S. Kim, Introduction of Ionomers, Wiley Interscience, New York, 1998.
(23) K. A. Mauritz, R. B. Moore, Chem. Rev. 2004, 104, 4535-4586.
(24) A. Kusoglu, A. Hexemer, R. Jiang, C. S. Gittleman, A. Z. Weber, J. Membr. Sci.
2012, 421-422, 283-291.
(25) K. Schmidt-Rohr, Q. Chen, Nat. Mater. 2008, 7, 75-83.
(26) A. B. LaConti, M. Hamdan, R. C. McDonald, handbook of fuel cells 2003, 647-662.
(27) M. G. Dhara, S. Banerjee, Prog. Polym. Sci. 2010, 35, 1022-1077.
(28) C. H. Park, C. H. Lee, M. D. Guiver, Y. M. Lee, Prog. Polym. Sci. 2011, 36, 1443-1498.
(29) K. Miyatake, Y. Chikashige, M. Watanabe, Macromolecules 2003, 36, 9691-9693. (30) K. Nakabayashi, T. Higashihara, M. Ueda, Macromolecules 2011, 44, 1603-1609.
- 16 -
(31) J. Zhang, Q. He, N. Gao, T. Yuan, S. Zhang, H. Yang, J. Power Sources 2014, 261, 38-45.
(32) Y. Chang, A. D. Mohanty, S. B. Smedley, K. Abu-Hakmeh, Y. H. Lee, J. E. Morgan, M. A. Hickner, S. S. Jang, C. Y. Ryu, C. Bae, Macromolecules 2015, 48, 7117-7126.
(33) M. Sakamoto, S. Nohara, K. Miyatake, M. Uchida, M. Watanabe, H. Uchida,
Electrochim. Acta 2014, 137, 213-218.
(34) D. W. Shin, N. R. Kang, K. H. Lee, D. H. Cho, J. H. Kim, W. H. Lee, Y. M. Lee, J.
Power Sources 2014, 262, 162-168.
(35) M. Lee, J. K. Park, H. S. Lee, O. Lane, R. B. Moore, J. E. McGrath, D. G. Baird,
Polymer 2009, 50, 6129-6138.
(36) B. Bae, T. Yoda, K. Miyatake, H. Uchida, M. Watanabe, Angew. Chem. Chem. Int.
Ed. 2010, 49, 317-320.
(37) M. S. Jung, T. H. Kim, Y. J. Yoon, C. G. Kang, D. M. Yu, J. Y. Lee, H. J. Kim, Y. T. Hong, J. Membr. Sci. 2014, 459, 72-85.
- 17 -
Chapter 2
Properties and Morphological Analyses of Perfluorosulfonic
Acid and Aromatic Hydrocarbon Ionomer Membranes
2.1 Introduction
Perfluorosulfonic acid (PFSA) ionomers such as Nafion (Du Pont) have been mostly used as proton exchange membranes for polymer electrolyte fuel cells (PEFCs) because of their high proton conductivity as well as their chemical and mechanical stability. However they are generally gas permeable and become weak at elevated temperature.1,2 The former leads to wasteful consumption of hydrogen and accelerates the generation of H2O2 that can chemically decompose the ionomers. The latter makes PFSA ionomers
decrease their proton conductivity and mechanical stability. Therefore aromatic hydrocarbon (HC) ionomers have been demanded as alternative ionomer membranes for PEFCs. In the last decade, a number of HC ionomer membranes have been developed.3,4 It has been recognized that aromatic block copolymers composed of hydrophilic (sulfonated) and hydrophobic (unsulfonated) components show well-developed nanophase separation, which contributes to significantly enhanced proton conducting properties under high-temperature and low-humidity conditions.5-8
The phase-separated morphology of the ionomer membranes has been well-investigated by transmission electron microscopy (TEM), scanning TEM (STEM), aromatic force microscopy (AFM), and small-angle X-ray or neutron scattering (SAXS and SANS, respectively) techniques.9-12 These morphological studies suggest that the
- 18 -
hydrophilic clusters become larger with increasing water content in the membranes, resulting in the development of ion channels in the PFSA ionomer membranes.5,11,13-17 Cylindrical and spherical ionic domains have been reported, depending on the water content in the membranes.14,15,18 Similar morphological studies have been carried out for some HC ionomer membranes.19-22 However, those analysis were carried out under conditions different from those of actual fuel cell operation. In order to gain deeper insight into changes in morphology and properties of ionomer membranes in operando fuel cells, temperature- and humidity-controlled SAXS analyses simulating practical fuel cell operating conditions was employed. The data are discussed in relation to those obtained by more conventional techniques (TEM, differential scanning calorimetry (DSC), water absorption, and proton conductivity), and compared between PFSA and HC ionomer membranes.
2.2 Experimental Ionomer membranes
The molecular structures of the ionomer membranes used in this chapter are shown in Figure 2-1. Nafion NRE211 is the best-known PFSA ionomer and Aquivion E79-03S is a more recent equivalent with shorter side chains, and they were purchased from Du Pont and Solvey, respectively. SPE-bl-1 is an HC block copolymer with densely sulfonated bulky hydrophilic blocks8 and SPK-bl-1 shares the same hydrophobic block with SPE-bl-1 but contains more compact, densely sulfonated hydrophilic blocks,23 and they were synthesized according to the literature. Their ion exchange capacities (IECs) are 0.91, 1.29, 1.63, and 2.53 meq g-1, respectively.
- 19 -
Figure 2-1. Molecular structures of the ionomer membranes. (a) Nafion NRE211 (Du
Pont), (b) Aquivion (Solvey), (c) SPE-bl-1 (synthesized in-house), and (d) SPK-bl-1 (synthesized in-house).
Water uptake and proton conductivity
Water uptake and proton conductivity of the ionomer membranes were measured with a solid electrolyte analyzer system (MSBAD-V-FC, Bel Japan Co.) equipped with a temperature- and humidity-controlled chamber. For water uptake measurement, the membrane samples (ca. 20-60 mg) were set at suspending sample holder, and made dry-out to obtain the dry-weight (Wdry) of the membrane. The membrane was stabilized
by humidified nitrogen gas at least 4 h before the gravimetry was done, and measured the humidified weight (Wwet). Water uptake (wt. %) was calculated from Eq. 2-1.
- 20 -
For the proton conductivity measurement, the membrane samples (1.0 cm in wide, 3.0 cm in length, and ca. 25-30 µm in thickness) were set at sample holder. The proton conductivities of the membranes were measured in-plane direction with 300 mV of AC amplitude and from 10 to 1 MHz of frequency range using four probes method by Solartron system (1225B frequency response and SI 1287 potentiostat, Solartron Metrology Co.) at 80 °C and varying humidities from 20% to 95% relative humidity (RH). The proton conductivity (σ (S cm-1)) of the ionomer membranes were calculated from Eq. 2-2.
σ = L / (A × Z) (Eq. 2-2)
where, L (cm) is membrane length, A (cm2) is the cross-sectional area of the membrane, and Z (Ω) is the high frequency resistance (HFR).
From the proton conductivity and density data, proton diffusion coefficient (Dσ (cm2
s-1)) was calculated using Nernst-Einstein equation (Eq. 2-3), 𝐷𝜎 = 𝑅𝑇
𝐹2 𝜎
𝑐(𝐻+)
(Eq. 2-3)
where R is gas constant, T is the absolute temperature (K), F is the Faraday constant, σ is the proton conductivity, and c(H+) is the concentration of proton charge carrier
(mol/L).
Differential scanning calorimetry (DSC)
DSC measurement was carried out to classify absorbed water in the ionomer membranes into nonfreezing (strongly bound-) and weakly bound water using a TA instrument 200. The membrane samples (ca. 10 mg) were equilibrated at 80 °C and various humidities from 20% to 95% RH for 12 h and placed in a sealed aluminum pan,
- 21 -
then quickly measured humidified weight (Wwet). The samples were quenched from 25
to -80 °C and then DSC curves were obtained from -80 to 25 °C at a heating rate of 0.2 °C/min with an empty pan as a reference. The lid of the sample pans after evaluation were made a pinhole (ca. 1 mm in diameter) and dried for 12 h in oven at 100 °C in vacuo, subsequently measured dry weight of the membranes (Wdry). From fusion
enthalpy of water which calculated from obtained DSC curves and specific heat for the melting of water (ΔHf = 333 J g-1), the amounts of weakly bound water (Wweak) in the
membranes were calculated. The amounts of nonfreezing water (Wnonfreez) in the
membranes were determined from the difference between Wwet and Wweak.
Transmission electron microscopy (TEM) observation
The membranes were stained with lead ions (Pb2+) by ion exchange of the sulfonic acid groups in 0.5 M of lead acetate aqueous solution, rinsed with deionized water, and dried for 12 h in an oven at 80 °C in vacuo. The stained membranes were embedded in epoxy resin and sectioned to 90 nm in thickness by Leica microtome Ultracut UCT, and placed on copper grid. TEM images were taken using a Hitachi H-9500 at the acceleration voltage of 200-300 kV.
Temperature- and humidity-controlled small-angle X-ray scattering (SAXS)
Small-angle X-ray scattering (SAXS) experiments were performed using a Rigaku NANO-Viewer equipped with a temperature- and humidity-controllable chamber as shown in Figure 2-2. The X-ray wavelength used was λ = 0.154 nm and the scattering patterns were collected using a Rigaku high speed 2D detector PILATUS 100K/R. The range of the scattering vector, q = 4πsin(θ/2)/λ, was from 0.05 to 3 nm-1 (ca. 2 – 120
- 22 -
nm), where θ is the scattering angle. The temperature was set at 80 °C, while the humidity was controlled from 20% to 90% RH with 10% RH step under nitrogen atmosphere. The membrane samples were equilibrated for at least 3 h under each RH condition.
Figure 2-2. Schematic of temperature- and humidity-controlled SAXS system
2.3 Results and Discussion
2.3.1 Water Uptake and Proton Conductivity
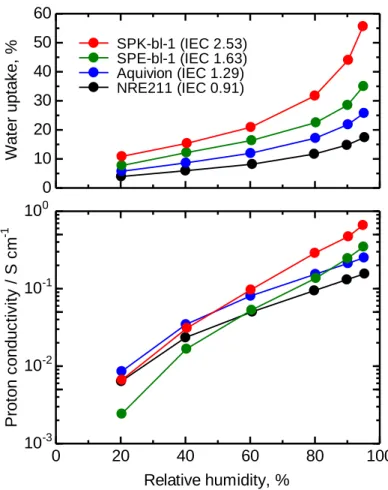
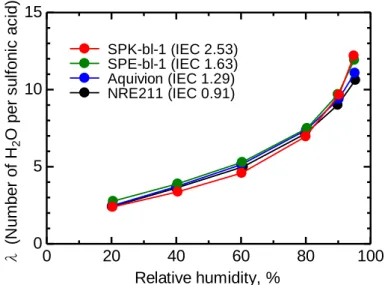
Water uptake and proton conductivity of the ionomer membranes at 80 °C as a function of RH were compared in Figure 2-3. Water uptake increased with increasing IEC value. The SPK-bl-1, with the highest IEC, showed a jump in water uptake above 80% RH because of its highest IEC. When the water uptake was replotted as a function of the absorbed water molecules per sulfonic acid (λ), the differences were smaller, with slightly higher water uptake for the HC ionomer membranes than those for the PFSA ionomer membranes at 95% RH as shown in Figure 2-4. The proton conductivity followed the same trend as those of the IEC value and water uptake at high humidity conditions. The proton conductivity increased significantly for the HC membranes at very high humidity (> 80% RH, see Figure 2-5), which is an indication that the
- 23 - 0 10 20 30 40 50 60 W a te r u p ta k e , % SPK-bl-1 (IEC 2.53) SPE-bl-1 (IEC 1.63) Aquivion (IEC 1.29) NRE211 (IEC 0.91) 0 20 40 60 80 100 10-3 10-2 10-1 100 P ro to n c o n d u c ti v it y / S c m -1 Relative humidity, %
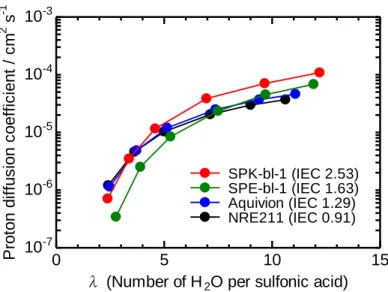
increased water content results in the growth of ionic channels for the HC membranes. However, this was not the case at low humidity: At 20% RH, the three membranes (NRE211, Aquivion, and SPK-bl-1) showed similar conductivity (6.4 × 10⁻³ – 8.6 × 10⁻³ S cm-1), which was higher than that (2.4 × 10⁻³ S cm-1) of the SPE-bl-1. The differences in the proton conductivity among these membranes were well correlated with the proton diffusion coefficient (Dσ) as shown in Figure 2-6. The HC membranes showed proton
diffusion coefficients that were more depending on λ (or humidity). The results indicate that the PFSA membranes utilize water molecules more efficiently for the proton conduction than the HC membranes.
Figure 2-3. Water uptake and proton conductivity of the ionomer membranes as a
- 24 -
Figure 2-4. Number of absorbed water molecules per sulfonic acid group (λ) of the
ionomer membranes as a function of relative humidity at 80 °C.
Figure 2-5. Proton conductivity in linear scale of the ionomer membranes as a function
of relative humidity at 80 °C. 0 20 40 60 80 100 0 0.2 0.4 0.6 0.8 Relative humidity, % P ro to n c o n d u c ti v it y / S c m -1 SPK-bl-1 (IEC 2.53) SPE-bl-1 (IEC 1.63) Aquivion (IEC 1.29) NRE211 (IEC 0.91) 0 20 40 60 80 100 0 5 10 15 Relative humidity, % λ ( N u m b e r o f H2 O p e r s u lf o n ic a c id ) SPK-bl-1 (IEC 2.53) SPE-bl-1 (IEC 1.63) Aquivion (IEC 1.29) NRE211 (IEC 0.91)
- 25 -
Figure 2-6. Proton diffusion coefficient of the ionomer membranes as a function λ at
80 °C.
2.3.2 Nonfreezing- and Weakly Bound Water in Ionomer Membranes
In order to investigate the properties of the absorbed water in more detail, DSC analyses of the humidified ionomer membranes were carried out. Membrane samples had been treated under various humidity conditions at 80 °C prior to the measurements, and DSC curves obtained are shown in Figure 2-7. In all cases, bulk water, which freezes at 0 °C, was not detected. The broad peaks at subzero temperatures, attributed to the melting of weakly bound water to the sulfonic acid groups, were observed only above 70% RH, below which no peaks were detected. The heat of fusion calculated from these peaks and the water uptake values mentioned in the experimental section allowed us to quantify the nonfreezing water and weakly bound water, respectively. Then the amount of absorbed water (Wweak and Wnonfreeze) was described as λ value as
shown in Figure 2-8. In the four ionomer membranes, most of the absorbed water molecules were nonfreezing due to the strong interaction with the sulfonic acid groups.
0 5 10 15 10-7 10-6 10-5 10-4 10-3
λ (Number of H2O per sulfonic acid)
P ro to n d if fu s io n c o e ff ic ie n t / c m 2 s -1 SPK-bl-1 (IEC 2.53) SPE-bl-1 (IEC 1.63) Aquivion (IEC 1.29) NRE211 (IEC 0.91)
- 26 -
The presence of weakly bound water at high RH was unlikely to be associated with the proton diffusion coefficient and the proton conductivity for the PFSA ionomer membranes, indicating that the nonfreezing water plays major role in the proton transport under these conditions.
Figure 2-7. DSC curves for (a) Nafion NRE211, (b) Aquivion, (c) SPE-bl-1, and (d)
SPK-bl-1 ionomer membranes. The samples were equilibrated at the designed humidity and 80 °C for 12 h prior to measurements.
- 27 -
Figure 2-8. Number of absorbed water molecules per sulfonic acid group (λ) for the
ionomer membranes: nonfreezing (solid line) and weakly bound (dashed line).
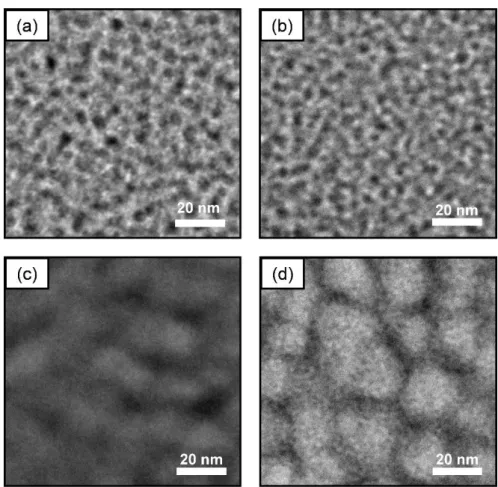
2.3.3 Morphology of Ionomer Membranes (TEM)
TEM images of the ionomer membranes in lead-ion form were shown in Figure 2-9. While the four ionomer membranes show well-developed hydrophilic/hydrophobic nanophase separation, the differences in their chemical structures provoke significant morphological differences. For the PFSA ionomer membranes, the hydrophilic domains (black area) were spheres of 3-6 nm in diameter and were highly distributed throughout the field of view. The hydrophilic domains were slightly smaller for the Aquivion (with higher IEC, and shorter side chains) than those for the Nafion NRE211. In contrast, the hydrophilic domains were more like belts, rather than spheres for the HC ionomer membranes. The hydrophilic domains (ca. 5-10 nm in width) were observed to surround large, spherical hydrophobic domains (ca. 15-40 nm in diameter). The large hydrophilic/ hydrophobic phase-separated morphologies were presumably due to the block structures of the HC ionomer membranes. The interfaces between the hydrophilic and
0 20 40 60 80 100 0 5 10 15 Relative humidity, % λ ( N u mb e r o f H2 O p e r s u lf o n ic a c id ) NRE211 (IEC 0.91) Aquivion (IEC 1.29) SPE-bl-1 (IEC 1.63) SPK-bl-1 (IEC 2.53)
- 28 -
hydrophobic domains were more distinct for the PFSA ionomers than for the HC ionomers because of the more pronounced hydrophilic/hydrophobic differences between the fluorinated polymer chains and the pendant sulfonic acid groups.
Figure 2-9. TEM images of (a) Nafion NRE211, (b) Aquivion, (c) SPE-bl-1, and
SPK-bl-1 membranes. The samples were ion-exchanged with lead (Pb2+) ions prior to the observation so as to stain the hydrophilic domains in black.
- 29 -
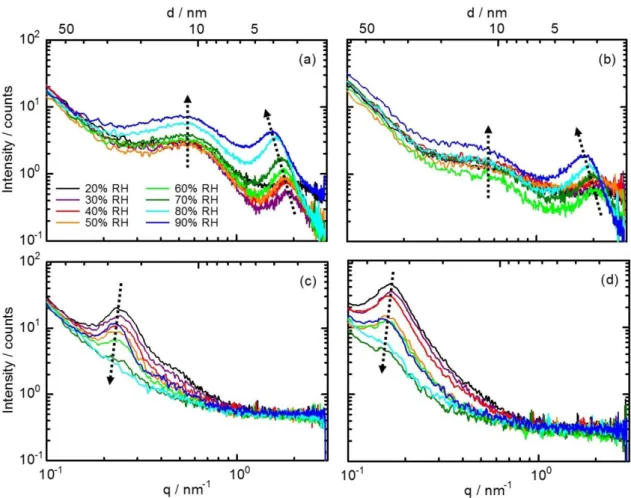
2.3.4 Morphological Changes with Humidity of Ionomer Membranes (SAXS)
The SAXS data were obtained for the ionomer membranes at 80 °C with varying humidity, from 90% to 20% RH (see Figure 2-10 for raw data). Figure 2-11 shows the scattered intensity with respect to the scattering vector (q). For the PFSA ionomer membranes, two diagnostic peaks were observed. It is generally recognized that the peak at higher q can be attributed to the distances of the spherical ionic domains (so-called ionomer peak), and the broader peak at low q corresponds to the crystalline hydrophobic structure of the polymer matrix (so-called matrix knee).11,12,14-18 In the back ground-subtracted SAXS profiles where the signal-to-noise ratios were not so high (see Figure 2-12), the slopes were estimated to be ca. -1 at lower q and ca. -4 at higher
q, respectively, in support of this idea. At 20% RH, the ionomer peak appeared at 1.85
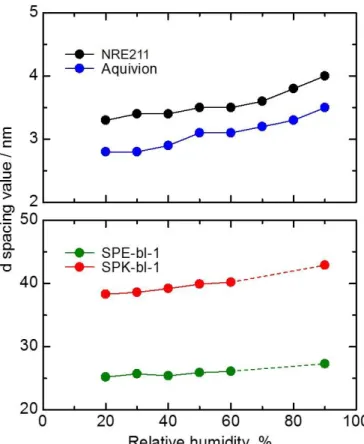
nm-1 (Nafion) and 2.11 nm-1 (Aquivion), which corresponds to the d spacing of 3.3 nm (Nafion) and 2.9 nm (Aquivion), respectively. The slightly smaller ionic domains for the Aquivion than for the Nafion was in accordance with the TEM images discussed above. The ionomer peaks shifted to lower q values (or higher d spacing values) with increasing humidity; the d spacing values were 4.0 nm (Nafion) and 3.5 nm (Aquivion) as shown in Figure 2-13a. In contrast, the lower q peaks did not change with humidity but remained constant at ca. 11 nm for both PFSA ionomer membranes. The results indicate that the absorbed water fills preferentially in the ionic domains and that the crystalline domains remain intact during the wetting processes.
The HC ionomer membranes showed only a single peak at low q in the SAXS profiles and behaved differently in their humidity dependence from that of the PFSA ionomers. Because this predominant peak remained at the same q value but became larger when the cations were ion-exchanged from protons to Na+ and Pb2+ (see Figure
- 30 -
2-14), it is reasonably to assign this peak to the distances of the ionic clusters (not the
hydrophobic domains). A very minor shoulder peak at higher q, ca. 0.3-0.4 nm-1 would be the 2nd-order peak (2q), as suggested by Lee et al.19 In the background-subtracted SAXS profiles (see Figure 2-12), the slopes were roughly estimated to be ca. -2 or -3, which was indicative of planar structure, in accordance with the TEM images. The d spacing values of the ionomer peaks were 25.7 nm (SPE-bl-1) and 38.2 nm (SPK-bl-1) at 20% RH. These values are slightly larger than the distances between the hydrophilic belts observed in the TEM images, due to a difference in the water content in the ionomer membranes in the SAXS and the TEM observation. The ionomer peaks shifted to higher d spacing values with increasing humidity; the d spacing values were 27.8 nm (SPE-bl-1) and 42.8 nm (SPK-bl-1) at 90% RH (Figure 2-13b). It should be noted that the ionomer peaks became smaller with increasing humidity up to 80% RH and developed again at 90% RH, for both the SPE-bl-1 and SPK-bl-1 membranes. Kunimatsu et al. have previously confirmed the hydration of the polar functional (e.g., sulfone and ketone) groups in the sulfonated HC polymer via ATR-FTIR analyses.24 It is considered that the wetting caused the randomization of the ionic clusters rather than the development of uniformly sized clusters. The water might be absorbed not only in the hydrophilic domains but also to some extent in the hydrophobic ones. This means that the absorbed waters were not effectively utilized for the development of the ionic clusters or the ion channels for the HC ionomer membranes. At 90% RH, re-organization would occur in the hydrophilic domains, leading to the formation of more uniformly sized ionic clusters. Such morphological changes could well account for the large increases in the water uptake for the HC ionomer membranes at high RH (Figure 2-3).
- 31 -
Figure 2-10. SAXS profiles as raw data for (a) Nafion NRE211, (b) Aquivion, (c)
SPE-bl-1, and (d) SPK-bl-1 membranes at relative humidity from 20% to 90% RH and 80 °C.
- 32 -
Figure 2-11. SAXS profiles for (a) Nafion NRE211, (b) Aquivion, (c) SPE-bl-1, and (d)
SPK-bl-1 membranes as a function of the scattering vector (q) value at relative humidity from 20% to 90% RH and 80 °C. The dashed arrows indicate increasing humidity.
- 33 -
Figure 2-12. Background-subtracted SAXS profiles for (a) Nafion NRE211, (b)
Aquivion, (c) SPE-bl-1, and (d) SPK-bl-1 membranes as a function of the q value at relative humidity from 20% to 90% RH and 80 °C. The lines with the number indicate roughly estimated slopes.
- 34 -
Figure 2-13. d spacing values of the hydrophilic domains for (a) the perfluorinated
ionomers, and (b) the aromatic hydrocarbon ionomers as a function of relative humidity obtained from Figure 2-11.
Figure 2-14. SAXS profiles of SPK-bl-1 membranes for pristine (black line), Pb2+ form (blue line), and Na+ form (red line) at 20% RH and 80 °C.
- 35 -
2.4 Conclusion
Relationship between the swelling property, proton transport, and morphology between the PFSA polymers and the HC block copolymers were investigated. For the both PFSA and HC ionomer membranes, absorbed water molecules in the ionomer membranes were mostly nonfreezing water which was strongly interacted with sulfonic acid groups for the four ionomer membranes. A temperature- and humidity-controlled SAXS technique was employed to observe morphological changes with humidity for comparing the PFSA and the HC ionomer membranes. In the PFSA ionomer membranes, water molecules were effectively utilized for the development of ionic clusters and phase separation. In the HC ionomer membranes, the ionic clusters became randomized with increasing water content due to the water absorption into the polar functional groups in the hydrophobic blocks. However the ionic clusters were re-organized into better-ordered ones at very high water content. The re-organization of the ionic clusters seems to be well correlated with the large increase in the water uptake and proton conductivity at the very high RH for the HC ionomer membranes. These results should be taken into account when designing better-performing aromatic HC ionomer membranes.
- 36 -
References
(1) M. A. Hickner, H. Ghassemi, Y. S. Kim, B. R. Einsla, J. E. McGrath, Chem. Rev.
2004, 104, 4587-4612.
(2) A.-C. Dupuis, Prog. Mater. Sci. 2011, 56, 289-327.
(3) M. G. Dhara, S. Banerjee, Prog. Mater. Sci. 2010, 35, 1022-1077.
(4) C. H. Park, C. H. Lee, M. D. Guiver, Y. M. Lee, Prog. Polym. Sci. 2011, 36, 1443-1498.
(5) A. Saccà, A. Carbone, R. Pedicini, G. Portale, L. D’Ilario, A. Longo, A. Martorana, E. Passalacqua, J. Membr. Sci. 2006, 278, 105-113.
(6) A. S. Badami, O. Lane, H.-S. Lee, A. Roy, J. E. McGrath, J. Membr. Sci. 2009,
333, 1-11.
(7) Y. A. Elabd, M. A. Hickner, Macromolecules 2010, 44, 1-11.
(8) B. Bae, T. Yoda, K. Miyatake, H. Uchida, M. Watanabe, Angew. Chem. Int. Ed.
2010, 49, 317-320.
(9) K. A. Mauritz, R. B. Moore, Chem. Rev. 2004, 104, 4535-4586.
(10) Elena Aleksandrova, Steffen Hink, Renate Hiesgen, and Emil Roduner, J. Phys.:
Condens. Matter. 2011, 23, 234109.
(11) Y. Liu, J. L. Schlichting, B. R. Caire, M. W. Liberatore, S. J. Hamrock, G. M. Haugen, M. A. Yandrasits, S. Seifert, A. M. Herring, Macromolecules 2012, 45, 7495-7503.
(12) G. Gebel, Macromolecules 2013, 46, 6057-6066.
(13) A. Kusoglu, M. A. Modestino, A. Hexemer, R. A. Segalman, A. Z. Weber, ACS
Macro Lett. 2011, 1, 33-36.
- 37 -
2012, 421-422, 283-291.
(15) A. Kusoglu, S. Savagatrup, K. T. Clark, A. Z. Weber, Macromolecules 2012, 45, 7467-7476.
(16) K.-D. Kreuer, M. Schuster, B. Obliers, O. Diat, U. Traub, A. Fuchs, U. Klock, S. J. Paddison, J. Maier, J. Power Sources 2008, 178, 499-509.
(17) C. Zhao, X. Li, Z. Wang, Z. Dou, S. Zhong, H. Na, J. Membr. Sci. 2006, 280, 643-650.
(18) M. Lee, J. K. Park, H.-S. Lee, O. Lane, R. B. Moore, J. E. McGrath, D. G. Baird,
Polymer 2009, 50, 6129-6138.
(19) E. M. W. Tsang, Z. Shi, S. Holdcroft, Macromolecules 2011, 44, 8845-8857. (20) V. Delhorbe, S. R. Reijerkerk, C. Cailleteau, M. Bathfield, L. Chikh, F. Gouanve,
L. Ogier, E. Espuche, B. Ameduri, S. Vidal, G. Gebel, A. Morin, O. Fichet, J.
Membr. Sci. 2013, 429, 168-180.
(21) T. Miyahara, T. Hayano, S. Matsuno, M. Watanabe, K. Miyatake, ACS Appl. Mater.
Interfaces 2012, 4, 2881-2884.
(22) K. Kunimatsu, K. Yagi, B. Bae, K. Miyatake, H. Uchida, M. Watanabe, J. Phys.
- 38 -
Chapter 3
Effect
of
Interlayer
Between
Hydrocarbon
Ionomer
Membrane and Catalyst Layer on Fuel Cell Performance
3.1 Introduction
Aromatic hydrocarbon (HC) ionomers as proton exchange membranes for polymer electrolyte fuel cells (PEFCs) have been extensively investigated as alternatives to perfluorosulfonic acid (PFSA) ionomers.1-3 It has been reported that some HC ionomer membranes have shown comparable performance and durability compared to the PFSA ionomer membranes in operating fuel cells.4-6 However, their fuel cell performances often drop under low-humidity conditions. Furthermore, it have been observed in my research that the cathode catalytic performance was worse with HC block copolymers than with PFSA ionomers even though the same cathode catalytic layers (same Pt loading and PFSA binder) were used. It is recognized that the interfacial contact between the ionomer membrane and the catalyst layer may affects on the cathode performance. Kim et al. reported that low water uptake interlayer improved compatibility with Nafion-bonded catalyst layers and accordingly enhanced performance and durability of a direct methanol fuel cell with HC ionomer membranes.7 However, the effect of such interlayer on the cathode performance has not been investigated.
In this research, the interfacial structures between the ionomer membrane and the catalyst layers and their impact on the fuel cell performance were investigated. In order
- 39 -
to evaluate those effects, a double-layer ionomer membrane composed of a thin Nafion layer on top of HC block copolymer was prepared. The double-layer membrane was characterized by scanning electron microscopy (SEM), transmission electron microscopy (TEM), water uptake, proton conductivity, and subjected to electrochemical investigations in fuel cells.
3.2 Experimental Ionomer membranes
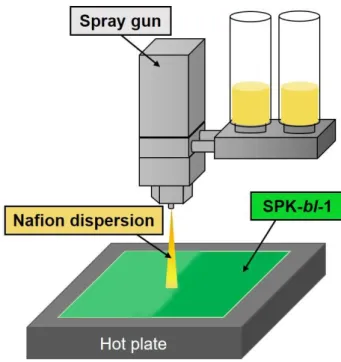
Nafion NRE211 (ion exchange capacity (IEC) = 0.91 meq g-1) was purchased from Du Pont. SPK-bl-1 (IEC = 2.34 meq g-1) was synthesized in house.5 The membrane thicknesses of the NRE211 and SPK-bl-1 were 25 and 24 µm, respectively. The molecular structures of these ionomer membranes are depicted in Figure 3-1. The double-layer ionomer membrane, SPK-Nafion, was prepared with spraying Nafion dispersion solution, which consisted of Nafion ionomer (IEC = 0.95–1.03 meq g-1, D-521, Du Pont), deionized water, and ethanol, onto a SPK-bl-1 ionomer membrane by a pulse-swirl spray (PSS) apparatus (Nordson Co.) as shown in Figure 3-2. The target value of the thickness of the Nafion layer was 0.5 µm, which was the smallest value to ensure the uniform coating with the apparatus. The prepared SPK-Nafion membrane was dried at 60 oC for 6 h, and hot pressed at 140 oC and 10 kgf cm-2 for 3 min.
- 40 -
Figure 3-1. Molecular structures of the ionomer membranes: (a) Nafion NRE211 (Du
Pont) and (b) SPK-bl-1 (synthesized in-house).
Figure 3-2. Schematic of Nafion coating onto SPK-bl-1 membrane by pulse swirl spray
(PSS) apparatus.
Measurements
SEM was carried out for the SPK-Nafion membrane using a Hitachi S-3000N at an acceleration voltage of 20 kV. The membrane sample was frozen and torn in liquid nitrogen prior to the observation. Energy-dispersive X-ray (EDX) analysis was also employed for elemental mapping of fluorine and sulfur. TEM observation, water uptake
- 41 -
and proton conductivity were carried out for the three membranes (NRE211, SPK-bl-1, and SPK-Nafion) with the same setup and sequence as described in chapter 2.
Preparation of catalyst-coated membranes (CCMs)
The catalyst paste was prepared by mixing the Pt/CB catalyst (TEC10E50E, Tanaka Kikinzoku Kogyo K. K.), Nafion ionomer binder (IEC = 0.95-1.03 meq g-1, D-521, Du Pont), deionized water, and ethanol by ball milling for 30 min. The mass ratio of Nafion ionomer to the carbon support (I/C) was adjusted to 0.70. The catalyst-coated membranes (CCMs) were prepared by spraying the catalyst paste on both sides of the three ionomer membranes (NRE211, SPK-bl-1, and SPK-Nafion) by PSS technique. The CCMs were dried at 60 °C for 6 h and hot-pressed at 140 °C and 10 kgf cm-2 for 3 min. The geometric area and the Pt-loading amount of the catalyst layer were 29.2 cm2 and 0.50 ± 0.03 mg cm-2, respectively. The CCMs were sandwiched by two gas diffusion layers (GDL, 25BCH, SGL Carbon Group Co., Ltd.) and mounted into a Japan Automobile Research Institute (JARI) standard cell, which has serpentine flow channels on both the anode and the cathode carbon separators. For the SPK-Nafion membrane, Nafion thin layer was placed on the cathode side. The cells using the NRE211, SPK-bl-1, and SPK-Nafion membranes are denoted as NRE211-cell, SPK-cell, and SPK-Nafion-cell, respectively.
Fuel cell operation
The electrochemically active surface area (ECSA) of the Pt catalyst at the cathode was estimated by cyclic voltammetry at 80 °C and 30%, 53%, 80%, and 100% RH using a potentiostat (PGST30 Autolab System, Eco-Chemie). Prior to the cyclic
- 42 -
voltammogram measurements, hydrogen (100 mL min-1) and nitrogen (150 mL min-1) were supplied to the anode and the cathode, respectively. Before the potential sweep, the cathode potential was maintained at 0.07 V for 3 s. Then, the nitrogen flow was stopped, and the potential swept from 0.07 to 1.0 V at a sweep rate of 20 mV s-1. The ECSA values were calculated from the hydrogen adsorption charge in the negative-going potential scan, referred to ΔQH0 = 0.21 mC cm-2, adopted conventionally for clean
polycrystalline platinum.8 Linear sweep voltammetry (LSV) was measured to investigate the permeability of hydrogen gas flowed from the anode to the cathode through the ionomer membranes. LSV measurement was carried out at 80 °C and 30%, 53%, 80%, and 100% RH. Prior to the LSV measurements, hydrogen (100 mL min-1) and nitrogen (150 mL min-1) were supplied to the anode and the cathode, respectively. The cathode potential was swept from 0.15 to 1.0 V at a sweep rate of 0.5 mV s-1. To evaluate the fuel cell performance, the polarization curves were measured at 80 °C and 30%, 53%, 80%, and 100% RH. Pure hydrogen and air was supplied to the anode and the cathode, respectively. The gas utilization at the anode and the cathode were 70% and 40%, respectively. The high frequency resistance (HFR) of the cell was measured with an AC milliohmmeter (Model 3356 Tsuruga Electric Corporation) at 1.0 kHz.
- 43 -
3.3 Results and Discussion
3.3.1 Characterization of Double-Layer Ionomer Membrane
A double-layer ionomer membrane, thin-layer Nafion on SPK-bl-1, was prepared by a spray-coating method. The cross-sectional SEM images and the elemental mapping of fluorine and sulfur atoms of the double-layer membrane are shown in Figure 3-3. A very thin (ca. 0.55 µm) Nafion layer was observed on the top of 24 µm thick SPK-bl-1 membrane (Figure 3-3a). The Nafion layer was flat with no detectable pinholes throughout the sight. In the EDX analyses, sulfur atoms were detected in both layers while fluorine atoms were detected only in the thin layer. The results indicate the successful preparation of the double-layer ionomer membrane with distinct interfaces between the two components. In Figure 3-4 are compared TEM images of Nafion NRE211, SPK-bl-1, and SPK-Nafion double-layer membranes in lead (Pb2+) ion form, respectively. The NRE211 exhibited a well-known phase-separated morphology with the spherical hydrophilic domains (represented in black) of 3–6 nm in diameter highly distributed throughout the sight (Figure 3-4a). The SPK-bl-1 exhibited belt-like hydrophilic domains of ca. 5-15 nm in width surrounding large hydrophobic domains of ca. 10-20 nm in width (Figure 3-4b). The SPK-Nafion double-layer membrane exhibited two layers, each of whose morphology was very similar to that of the original component (Figure 3-4c). The minor difference in IEC values between NRE211 (0.91 meq g-1) and thin-layer Nafion (0.95-1.03 meq g-1) was unlikely to lead to morphological differences.
- 44 -
Figure 3-3. Cross-sectional SEM image (a) and elemental mapping of (b) fluorine and
(c) sulfur in the SPK-Nafion double-layer ionomer membrane.
Figure 3-4. TEM images of (a) Nafion NRE211, (b) SPK-bl-1, and (c) SPK-Nafion
double-layer ionomer membranes. Samples were ion exchanged with lead (Pb2+) ions prior to observation so as to stain the hydrophilic domains in black.
- 45 -
3.3.2 Water Uptake and Proton Conductivity
Water uptake and proton conductivity of the three ionomer membranes (NRE211, SPK-bl-1, and SPK-Nafion) were measured at 80 °C and different humidities, and are plotted as a function of RH in Figure 3-5. The SPK-Nafion showed very similar water uptake and proton conductivity to those of the SPK-bl-1 membrane within acceptable errors at any RH. The result is reasonable taking into account the fact that the volume content of the thin Nafion layer was as low as 2.3% in the double-layer membrane. It also indicates that the interfacial contact between the thin Nafion layer and the SPK-bl-1 membrane was good as expected from the above mentioned SEM and TEM images.
Figure 3-5. Water uptake and proton conductivity of the ionomer membranes as a
function of relative humidity at 80 °C.
0 10 20 30 40 50 60 W a te r u p ta k e , % NRE211 SPK-bl-1 SPK-Nafion 0 20 40 60 80 100 10-3 10-2 10-1 Relative humidity, % P ro to n c o n d u c ti v it y / S c m -1
- 46 -
3.3.3 Electrochemical Investigations of Double-Layer Ionomer Membrane
MEAs were prepared for the three ionomer membranes (NRE211, SPK-bl-1, and SPK-Nafion) and subjected to fuel cell operating tests. For the MEA using SPK-Nafion double-layer membrane, the thin Nafion layer was placed onto the cathode side. Note that the amounts of platinum and Nafion binder were the same for the three MEAs.
Figure 3-6 shows cyclic voltammograms (CVs) of the cathode for the three cells
(NRE211-cell, SPK-cell, and SPK-Nafion-cell) at 80 °C and varying humidity of 30%, 53%, 80%, and 100% RH. The three cells showed similar CVs typical for polycrystalline platinum at all humidities. The electrochemically active surface areas (ECSAs) were estimated from the hydrogen adsorption charge and are plotted as a function of RH in Figure 3-7. The ECSA values were comparable among the three cells, indicating that the contact between Pt catalysts and ionomers was similar in these catalyst layers. The CVs of the NRE211-cell were shifted upward compared to the other two cells due to the oxidation current of the crossed over hydrogen. The result is reasonable, taking into account the much higher gas permeability of the Nafion than that of the SPK-bl-1 membrane.5 The SPK-Nafion cell exhibited a low hydrogen crossover current, as low as that of the SPK-cell, indicating the very low hydrogen permeability of the double-layer membrane. The differences in hydrogen permeability among the three membranes were further confirmed by LSVs as shown in Figure 3-8. The oxidation current density at 0.4 V of the crossed over hydrogen was ca. 0.1-0.3 mA cm-2 for the SPK- and SPK-Nafion-cells, which were much lower (<20%) than that of the NRE211-cell (ca. 1.2-1.6 mA cm-2) at all humidity conditions.
- 47 -
Figure 3-6. Cyclic volatammograms (CVs) of the NRE211-, SPK-, and
SPK-Nafion-cells at 80 °C under humidity conditions of (a) 100%, (b) 80%, (c) 53%, and (d) 30% RH.
Figure 3-7. Humidity dependence of ECSA for the NRE211-, SPK-, and
- 48 -
Figure 3-8. The oxidation current density at 0.4 V of hydrogen gas permeated through
the membrane for the NRE211-, SPK-, and SPK-Nafion-cells as a function of RH at 80 °C.
3.3.4 Fuel Cell Performance of Double-Layer Ionomer Membrane
The fuel cell performances were investigated for the SPK-Nafion-cell and compared with those of the NRE211- and SPK-cells under the same operating conditions. Figure 3-9 shows polarization curves (ohmic (IR) drop included) and ohmic resistances of the three cells. The three cells showed similar ohmic resistances and their current density dependence at humidities greater than 53% RH, which were in good accordance with the proton conductivities of the three membranes. The SPK- and SPK-Nafion-cells showed higher ohmic resistances than that of the NRE211-cell at 30% RH because of the slightly lower proton conductivity of the former membranes. At 30% RH, the ohmic resistance of the SPK-cell decreased rapidly at low current density but increased gradually when further increasing the current density, due to dehydration of the membrane. The result indicates that the SPK-bl-1 membrane is more likely to
- 49 -
dehydrate than the Nafion membrane in the operating fuel cell. Such dehydration was not observed for the SPK-Nafion-cell, which showed nearly constant ohmic resistance at current density above 0.1 A cm-2. These results indicate that the water content of the membrane was maintained at high level due to effective back-diffusion of generated water from the cathode catalyst layer for the NRE211- and SPK-Nafion-cells. The thin Nafion interlayer was effective in preventing the membranes from drying excessively under low humidity conditions.
The SPK-cell showed lower fuel cell performance than that of the NRE211-cell, although the ohmic resistances were comparable at humidities greater than 53% RH. The differences in the performance between the two cells became larger with decreasing humidity. The higher ohmic resistance of the SPK-cell than that of the NRE211-cell at 30% RH caused even larger performance differences. In order to investigate this issue in more detail, the IR-free polarization curves are shown in Figure 3-10. The SPK-Nafion-cell exhibited improved performance compared to that of the SPK-cell, and the effect of the double-layer membrane was most pronounced at 30% RH, at which humidity the performance of the SPK-Nafion-cell was nearly comparable to that of the NRE211-cell.
The mass activities at 0.85 V, which are regarded as a measure of the effectiveness of Pt catalysts,9 were calculated from the data in Figures 3-10 and are plotted as a function of RH in Figure 3-11. The three cells exhibited the differences in the mass activity outside the scope of error at humidity greater than 53% RH. The mass activity of the NRE211-cell was 108 A gPt-1 at 100% RH and a factor of ca. two higher than that
of the SPK-cell. This indicates that the catalytic performance could be affected by the membrane characteristics even when the same electrode was employed for the three
- 50 -
cells. Then, the IR-free polarization curves are replotted as Tafel plots (Figure 3-12), and their Tafel slopes are summarized as a function of RH in Figure 3-13. There were no practical differences in the Tafel slopes among the three cells at all humidity conditions, indicating the mass transport (proton, oxygen, and electron) to “active” reaction sites in the cathode catalyst layer was not rate-determining step for the oxygen reduction reaction (ORR) for the three cells. Herein, the “active” reaction site is defined as the Pt catalysts actually contributing to the ORR in the cathode catalyst layer. Therefore, the differences of the mass activity in Tafel range should reflect the differences of the effectiveness9 of the Pt catalysts in the cathode catalyst layer. According to this idea, the Pt effectiveness of the SPK-cell was considered to be only ca. half compared to those of the NRE211-cell at humidities greater than 53% RH (Figure
3-11). Furthermore, it is assumed that the proton transport network at the interface of
the membrane and the catalyst layer is responsible. Since the SPK-bl-1 membrane has a large-scale phase-separated morphology (several tens of nanometer), as observed by TEM and SAXS analyses in chapter 2, a portion of the Pt catalyst nanoparticles with Nafion binder might not have contacted well with the proton-conductive hydrophilic domains but attached to non-proton conductive hydrophobic domains as described in
Figure 3-14. Such catalyst particles are covered by Nafion binder and would thus be
active in the CV measurements (under near static conditions) to account for reasonable ECSA values (Figure 3-7), but would not function in the operating fuel cells (under dynamic conditions) because of insufficient proton supply from the membrane.9,10 The Nafion interlayer was effective in improving the interfacial contact in terms of mass transport between the SPK-bl-1 membrane and the cathode catalyst layer. The effect of the interlayer was most striking at 30% RH, presumably because the proton-conductive
- 51 -
path at the surface of the SPK-bl-1 membrane was least developed at low humidity as confirmed by electrochemical AFM analyses.11 The mass activity of the SPK-Nafion-cell was 43.1 A gPt-1 at 30% RH, which was comparable to that of the
NRE211-cell (46.1 A gPt-1).
Figure 3-9. IR included polarization curves and ohmic resistances of the NRE211, SPK-,
and SPK-Nafion-cells at 80 °C under humidity conditions of (a) 100%, (b) 80%, (c) 53%, and (d) 30% RH.
- 52 -
Figure 3-10. IR-corrected polarization curves of NRE211-, SPK-, and SPK-Nafion-cells
at 80 °C under humidity conditions of (a) 100%, (b) 80%, (c) 53%, and (d) 30% RH.
Figure 3-11. Mass activity at 0.85 V of the NRE211-, SPK-, and SPK-Nafion-cells as a
- 53 -
Figure 3-12. Tafel plot of the NRE211-, SPK-, and SPK-Nafion-cells at 80 °C and
relative humidity of (a) 100%, (b) 80%, (c) 53%, and (d) 30% RH.
Figure 3-13. Tafel slope as a function of relative humidity for the NRE211-, SPK-, and