Overview of the 2nd Workshop on Asian Translation
Toshiaki Nakazawa Japan Science and Technology Agency [email protected]
Hideya Mino National Institute of
Information and Communications Technology [email protected]
Isao Goto NHK
[email protected]
Graham Neubig Nara Institute of Science and Technology [email protected]
Sadao Kurohashi Kyoto University
[email protected]
Eiichiro Sumita National Institute of
Information and Communications Technology
[email protected]
Abstract
This paper presents the results of the shared tasks from the 2nd workshop on Asian translation (WAT2015) includ- ing J ↔ E, J ↔ C scientific paper trans- lation subtasks and C → J, K → J patent translation subtasks. For the WAT2015, 12 institutions participated in the shared tasks. About 500 translation results have been submitted to the automatic evalua- tion server, and selected submissions were manually evaluated.
1 Introduction
The Workshop on Asian Translation (WAT) is a new open evaluation campaign focusing on Asian languages. Following the success of the previ- ous workshop WAT2014(Nakazawa et al., 2014), WAT2015 brings together machine translation re- searchers and users to try, evaluate, share and dis- cuss brand-new ideas of machine translation. We are working toward the practical use of machine translation among all Asian countries.
For the 2nd WAT, we adopt new transla- tion subtasks “Chinese-to-Japanese and Korean- to-Japanese patent translation” in addition to the subtasks that were conducted in WAT2014.
WAT is unique for the following reasons:
• Open innovation platform
The test data is fixed and open, so evalua- tions can be repeated on the same data set to confirm changes in translation accuracy over time. WAT has no deadline for auto- matic translation quality evaluation (contin- uous evaluation), so translation results can be submitted at any time.
• Domain and language pairs
WAT is the world’s first workshop that uses scientific papers as the domain, and Chinese↔Japanese and Korean→Japanese as language pairs. In the future, we will add more Asian languages, such as Vietnamese, Indonesian, Thai, Burmese and so on.
• Evaluation method
Evaluation is done both automatically and manually. For human evaluation, WAT uses crowdsourcing, which is low cost and allows multiple evaluations, as the first-stage evalu- ation. Also, JPO adequacy evaluation is con- ducted for the selected submissions accord- ing to the crowdsourcing evaluation results.
2 Dataset
WAT uses the Asian Scientific Paper Excerpt Cor- pus (ASPEC)
1and JPO Patent Corpus (JPC)
2as the dataset.
2.1 ASPEC
ASPEC is constructed by the Japan Science and Technology Agency (JST) in collaboration with the National Institute of Information and Com- munications Technology (NICT). It consists of a Japanese-English scientific paper abstract corpus (ASPEC-JE), which is used for J ↔ E subtasks, and a Japanese-Chinese scientific paper excerpt cor- pus (ASPEC-JC), which is used for J ↔ C subtasks.
The statistics for each corpus are described in Ta- ble1.
1http://lotus.kuee.kyoto-u.ac.jp/ASPEC/
2http://lotus.kuee.kyoto-u.ac.jp/WAT/patent/index.html 1
Proceedings of the 2nd Workshop on Asian Translation (WAT2015), pages 1‒28, Kyoto, Japan, 16th October 2015.
LangPair Train Dev DevTest Test ASPEC-JE 3,008,500 1,790 1,784 1,812 ASPEC-JC 672,315 2,090 2,148 2,107
Table 1: Statistics for ASPEC.
2.1.1 ASPEC-JE
The training data for ASPEC-JE was constructed by the NICT from approximately 2 million Japanese-English scientific paper abstracts owned by the JST. Because the abstracts are comparable corpora, the sentence correspondences are found automatically using the method from (Utiyama and Isahara, 2007). Each sentence pair is accom- panied by a similarity score and the field symbol.
The similarity scores are calculated by the method from (Utiyama and Isahara, 2007). The field sym- bols are single letters A-Z and show the scientific field for each document
3. The correspondence be- tween the symbols and field names, along with the frequency and occurrence ratios for the training data, are given in the README file from ASPEC- JE.
The development, development-test and test data were extracted from parallel sentences from the Japanese-English paper abstracts owned by JST that are not contained in the training data.
Each data set contains 400 documents. Further- more, the data has been selected to contain the same relative field coverage across each data set.
The document alignment was conducted automat- ically and only documents with a 1-to-1 alignment are included. It is therefore possible to restore the original documents. The format is the same as for the training data except that there is no similarity score.
2.1.2 ASPEC-JC
ASPEC-JC is a parallel corpus consisting of Japanese scientific papers from the literature database and electronic journal site J-STAGE of JST that have been translated to Chinese with per- mission from the necessary academic associations.
The parts selected were abstracts and paragraph units from the body text, as these contain the high- est overall vocabulary coverage.
The development, development-test and test data are extracted at random from documents con- taining single paragraphs across the entire cor- pus. Each set contains 400 paragraphs (docu- ments). Therefore, there are no documents sharing
3http://opac.jst.go.jp/bunrui/index.html
LangPair Train Dev DevTest Test JPC-CJ 1,000,000 2,000 2,000 2,000 JPC-KJ 1,000,000 2,000 2,000 2,000
Table 2: Statistics for JPC.
the same data across the training, development, development-test and test sets.
2.2 JPC
JPC was constructed by the Japan Patent Of- fice (JPO). It consists of a Chinese-Japanese patent description corpus (JPC-CJ) and Korean- Japanese patent description corpus (JPC-KJ) with four sections, which are Chemistry, Electricity, Mechanical engineering, and Physics, based on International Patent Classification (IPC). Each corpus is separated into training, development, development-test and test data, which are sentence pairs. This corpus was used for patent subtasks C→J and K→J. The statistics for each corpus are described in Table2.
The Sentence pairs in each data were randomly extracted from a description part of comparable patent documents under the condition that a sim- ilarity score between sentences is greater than or equal to the threshold value 0.05. The simi- larity score was calculated by the method from (Utiyama and Isahara, 2007) as with ASPEC. Doc- ument pairs which were used to extract sentence pairs for each data were not used for the other data. Furthermore, the sentence pairs was ex- tracted to be same number among the four sec- tions. The maximize number of sentence pairs which are extracted from one document pair was limited to 60 for training data and 20 for the devel- opent, development-test and test data. The train- ing data for JPC-CJ was made with sentence pairs of Chinese-Japanese patent documents published in 2012. For JPC-KJ, the training data was ex- tracted from sentence pairs of Korean-Japanese patent documents published in 2011 and 2012.
The development, development-test and test data for JPC-CJ and JPC-KJ were respectively made with 100 patent documents published in 2013.
3 Baseline Systems
Human evaluations were conducted as pairwise
comparisons between the translation results for a
specific baseline system and translation results for
each participant’s system. That is, the specific baseline system was the standard for human eval- uation. A phrase-based statistical machine trans- lation (SMT) system was adopted as the specific baseline system at WAT 2015, which is the same system as that at WAT 2014.
In addition to the results for the baseline phrase- based SMT system, we produced results for the baseline systems that consisted of a hierarchical phrase-based SMT system, a string-to-tree syntax- based SMT system, a tree-to-string syntax-based SMT system, seven commercial rule-based ma- chine translation (RBMT) systems, and two online translation systems. The SMT baseline systems consisted of publicly available software, and the procedures for building the systems and for trans- lating using the systems were published on the WAT web page
4. We used Moses (Koehn et al., 2007; Hoang et al., 2009) as the implementation of the baseline SMT systems. The Berkeley parser (Petrov et al., 2006) was used to obtain syntactic annotations. The baseline systems are shown in Table 3.
The commercial RBMT systems and the online translation systems were operated by the organiz- ers. We note that these RBMT companies and on- line translation companies did not submit them- selves. Because our objective is not to compare commercial RBMT systems or online translation systems from companies that did not themselves participate, the system IDs of these systems are anonymous in this paper.
3.1 Training Data
We used the following data for training the SMT baseline systems.
• Training data for the language model: All of the target language sentences in the parallel corpus.
• Training data for the translation model: Sen- tences that were 40 words or less in length.
(For Japanese–English training data, we only used train-1.txt, which consists of one mil- lion parallel sentence pairs with high similar- ity scores.)
• Development data for tuning: All of the de- velopment data.
3.2 Common Settings for Baseline SMT We used the following tools for tokenization.
4http://lotus.kuee.kyoto-u.ac.jp/WAT/
• Juman version 7.0
5for Japanese segmenta- tion.
• Stanford Word Segmenter version 2014-01- 04
6(Chinese Penn Treebank (CTB) model) for Chinese segmentation.
• The Moses toolkit for English tokenization.
• Mecab-ko
7for Korean segmentation.
To obtain word alignments, GIZA++ and grow- diag-final-and heuristics were used. We used 5- gram language models with modified Kneser-Ney smoothing, which were built using a tool in the Moses toolkit (Heafield et al., 2013).
3.3 Phrase-based SMT
We used the following Moses configuration for the phrase-based SMT system.
• distortion-limit = 20 except for KJ and distortion-limit = 0 for KJ
• msd-bidirectional-fe lexicalized reordering
• Phrase score option: GoodTuring
The default values were used for the other system parameters.
3.4 Hierarchical Phrase-based SMT
We used the following Moses configuration for the hierarchical phrase-based SMT system.
• max-chart-span = 1000
• Phrase score option: GoodTuring
The default values were used for the other system parameters.
3.5 String-to-Tree Syntax-based SMT
We used the Berkeley parser to obtain target lan- guage syntax. We used the following Moses con- figuration for the string-to-tree syntax-based SMT system.
• max-chart-span = 1000
• Phrase score option: GoodTuring
• Phrase extraction options: MaxSpan = 1000, MinHoleSource = 1, and NonTermConsec- Source.
The default values were used for the other system parameters.
5http://nlp.ist.i.kyoto-u.ac.jp/EN/index.php?JUMAN
6http://nlp.stanford.edu/software/segmenter.shtml
7https://bitbucket.org/eunjeon/mecab-ko/
ASPEC JPC
System ID System Type JE EJ JC CJ CJ KJ
SMT Phrase Moses’ Phrase-based SMT SMT ✓ ✓ ✓ ✓ ✓ ✓
SMT Hiero Moses’ Hierarchical Phrase-based SMT SMT ✓ ✓ ✓ ✓ ✓ ✓
SMT S2T Moses’ String-to-Tree Syntax-based SMT and Berkeley parser SMT ✓ ✓
SMT T2S Moses’ Tree-to-String Syntax-based SMT and Berkeley parser SMT ✓ ✓ ✓
RBMT X The Honyaku V15 (Commercial system) RBMT ✓ ✓
RBMT X ATLAS V14 (Commercial system) RBMT ✓ ✓
RBMT X PAT-Transer 2009 (Commercial system) RBMT ✓ ✓
RBMT X J-Beijing 7 (Commercial system) RBMT ✓ ✓ ✓
RBMT X Hohrai 2011 (Commercial system) RBMT ✓ ✓ ✓
RBMT X J Soul 9 (Commercial system) RBMT ✓
RBMT X Korai 2011 (Commercial system) RBMT ✓
Online X Google translate (August, 2015) (SMT) ✓ ✓ ✓ ✓ ✓ ✓
Online X Bing translator (August and September, 2015) (SMT) ✓ ✓ ✓ ✓ ✓ ✓
Table 3: Baseline Systems
3.6 Tree-to-String Syntax-based SMT
We used the Berkeley parser to obtain source lan- guage syntax. We used the following Moses con- figuration for the baseline tree-to-string syntax- based SMT system.
• max-chart-span = 1000
• Phrase score option: GoodTuring
• Phrase extraction options: MaxSpan = 1000, MinHoleSource = 1, MinWords = 0, NonTermConsecSource, and AllowOnlyU- nalignedWords.
The default values were used for the other system parameters.
4 Automatic Evaluation
4.1 Procedure for Calculating Automatic Evaluation Score
We calculated automatic evaluation scores for the translation results by applying two popular met- rics: BLEU (Papineni et al., 2002) and RIBES (Isozaki et al., 2010). BLEU scores were cal- culated using multi-bleu.perl distributed with the Moses toolkit (Koehn et al., 2007); RIBES scores were calculated using RIBES.py version 1.02.4
8. All scores for each task were calculated using one reference. Before the calculation of the automatic evaluation scores, the translation results were tok- enized with word segmentation tools for each lan- guage.
For Japanese segmentation, we used three dif- ferent tools: Juman version 7.0 (Kurohashi et al., 1994), KyTea 0.4.6 (Neubig et al., 2011) with Full SVM model
9and MeCab 0.996 (Kudo, 2005)
8http://www.kecl.ntt.co.jp/icl/lirg/ribes/index.html
9http://www.phontron.com/kytea/model.html
with IPA dictionary 2.7.0
10. For Chinese segmen- tation we used two different tools: KyTea 0.4.6 with Full SVM Model in MSR model and Stanford Word Segmenter version 2014-06-16 with Chi- nese Penn Treebank (CTB) and Peking University (PKU) model
11(Tseng, 2005). For Korean seg- mentation we used mecab-ko
12. For English seg- mentation we used tokenizer.perl
13in the Moses toolkit.
Detailed procedures for the automatic evalua- tion are shown on the WAT2015 evaluation web page
14.
4.2 Automatic Evaluation System
The participants submit translation results via an automatic evaluation system deployed on the WAT2015 web page, which automatically gives evaluation scores for the uploaded results. Fig- ure 1 shows the submission interface for partici- pants. The system requires participants to provide the following information when they upload trans- lation results:
• Subtask:
– Scientific papers subtask (J ↔ E, J ↔ C);
– Patents subtask (C → J , K → J);
• Method (SMT, RBMT, SMT and RBMT, EBMT, Other);
10http://code.google.com/p/mecab/downloads/detail?
name=mecab-ipadic-2.7.0-20070801.tar.gz
11http://nlp.stanford.edu/software/segmenter.shtml
12https://bitbucket.org/eunjeon/mecab-ko/
13https://github.com/moses-smt/mosesdecoder/tree/
RELEASE-2.1.1/scripts/tokenizer/tokenizer.perl
14http://lotus.kuee.kyoto-u.ac.jp/WAT/evaluation/index.html
Figure 1: The submission web page for participants
• Use of other resources in addition to ASPEC or JPC;
• Permission to publish the automatic evalua- tion scores on the WAT2015 web page.
The server for the system stores all submitted in- formation, including translation results and scores, although participants can confirm only the infor- mation that they uploaded. Information about translation results that participants permit to be published is disclosed on the web page. In addi- tion to submitting translation results for automatic evaluation, participants submit the results for hu- man evaluation using the same web interface. This automatic evaluation system will remain available even after WAT2015. Anybody can register to use the system on the registration web page
15. 5 Human Evaluation
In WAT2015, we conducted 2 kinds of human evaluations: pairwise crowdsourcing evaluation and JPO adequacy evaluation.
5.1 Pairwise Crowdsourcing Evaluation The pairwise crowdsourcing evaluation is the same as the last year. We used Lancers as the crowdsourcing platform. There are two reasons of choosing Lancers. One is that we can set the cat- egory of the crowdsourcing task (’Translation’ in this case). We can reach the appropriate workers by choosing the appropriate categories. The other reason is that we can assign the task to identity- verified workers. This function guaranteed the quality of the workers. These two advantages en- sure a high evaluation quality.
We used the same sentences as the last year for the pairwise crowdsourcing evaluation. We ran- domly chose documents from the Test set from the ASPEC data, for a total of 400 sentence pairs for JE and JC. We excluded documents contain- ing sentences longer than 100 Japanese characters.
Each submission is compared with the baseline translation (Phrase-based SMT, described in Sec- tion 3) and given a Crowd score
16.
5.1.1 Pairwise Evaluation of Sentences We conducted pairwise evaluation of each of the 400 test sentences. The input sentence and two translations (the baseline and a submission) are
15http://lotus.kuee.kyoto-u.ac.jp/WAT/registration/index.html
16It was called HUMAN score in WAT2014.
shown to the workers, and the workers are asked to judge which of the translation is better, or if they are of the same quality. The order of the two trans- lations are at random. Figure 2 illustrates the eval- uation.
5.1.2 Voting
The crowdsourcing workers are not specialists, and thus the quality of the judgments are not nec- essarily precise. To guarantee the quality of the evaluations, each sentence is evaluated by 5 dif- ferent workers and the final decision is made de- pending on the 5 judgements
17. We define each judgement j
i(i = 1, · · · , 5) as:
j
i=
1 if better than the baseline
−1 if worse than the baseline 0 if the quality is the same The final decision D is defined as follows using S = ∑
j
i:
D =
win (S ≥ 2) loss (S ≤ −2) tie (otherwise)
5.1.3 Crowd Score Calculation
Suppose that W is the number of wins compared to the baseline, L is the number of losses and T is the number of ties. The Crowd score can be calculated by the following formula:
Crowd = 100 × W − L W + L + T
From the definition, the Crowd score ranges be- tween -100 and 100.
5.1.4 Confidence Interval Estimation
There are several ways to estimate a confidence interval. We chose to use bootstrap resampling (Koehn, 2004) to estimate the 95% confidence in- terval. The procedure is as follows:
1. randomly select 300 sentences from the 400 human evaluation sentences, and calculate the Crowd score of the selected sentences 2. iterate the previous step 1000 times and get
1000 Crowd scores
3. sort the 1000 scores and estimate the 95%
confidence interval by discarding the top 25 scores and the bottom 25 scores
17We used 3 judgements in WAT2014.
Figure 2: Illustration of the crowdsourcing evaluation. The workers are asked to judge which translation is better, or the same.
5.1.5 Cost
A major benefit of using crowdsourcing is that it reduces the cost of evaluations. In WAT2015, one judgment costs 5 JPY. The evaluation of a submis- sion requires 5 (judgments) × 400 (sentence pairs)
= 2,000 judgments and costs 5 × 2,000 = 10,000 JPY. The time for the evaluation differs depend- ing on the translation direction. On average, one evaluation takes a couple of days.
5.2 JPO Adequacy Evaluation
The participants’ systems, which achieved the top 3 highest scores among the pairwise crowd- sourcing evaluation results of each subtask, were also evaluated with the JPO adequacy evaluation.
The JPO adequacy evaluation was carried out by translation experts with a quality evaluation cri- terion for translated patent documents which the Japanese Patent Office (JPO) decided. In addi- tion to the top 3 systems, the Sense 1 system of the JPC-KJ subtask, which was the lower score on the pairwise crowdsourcing evaluation despite the high score on the automatic evaluation, was eval- uated exceptionally. For each system, two anno- tators evaluate the test sentences to guarantee the quality.
5.2.1 Evaluation of Sentences
The number of test sentences for the JPO adequacy evaluation is 200. The 200 test sentences were ran- domly selected from the 400 test sentences of the pairwise evaluation. The test sentence include the input sentence, the submitted system’s translation and the reference translation.
5 All important information is transmitted correctly.
(100%)
4 Almost all important information is transmitted cor- rectly. (80%–)
3 More than half of important information is trans- mitted correctly. (50%–)
2 Some of important information is transmitted cor- rectly. (20%–)
1 Almost all important information is NOT transmit- ted correctly. (–20%)
Table 4: The JPO adequacy criterion
5.2.2 Evaluation Criterion
Table 4 shows the JPO adequacy criterion from 5 to 1. The evaluation is performed subjectively.
“Important information” represents the technical factors and their relationships. The degree of importance of each element is also considered to evaluate. The percentages in each grade are rough indications for the transmission degree of the source sentence meanings. The detailed cri- terion can be found on the JPO document (in Japanese)
18.
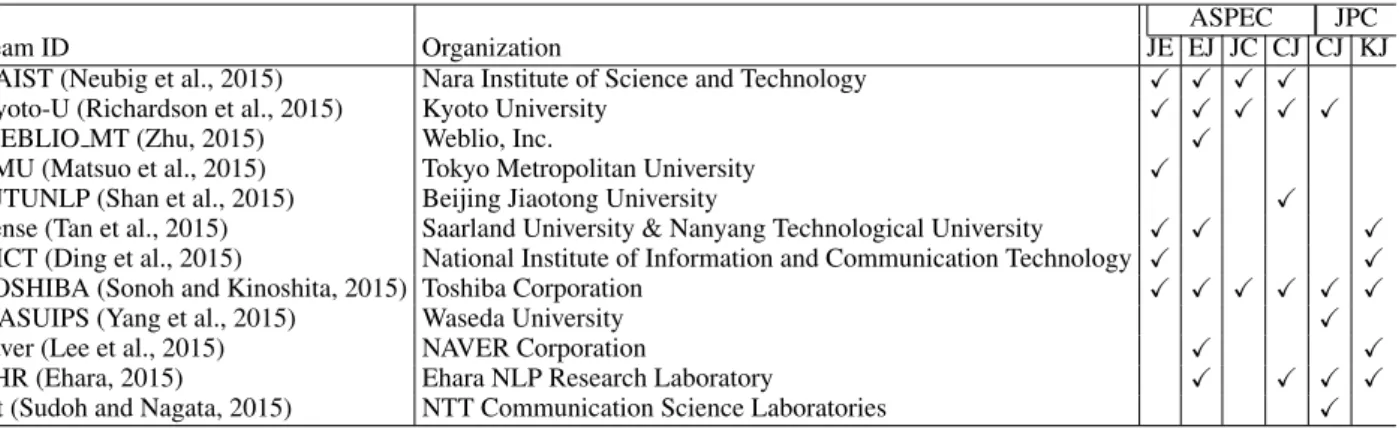
6 Participants List
Table 5 shows the list of participants for WAT2015. This includes not only Japanese orga- nizations, but also some organizations from out- side Japan. 12 teams submitted one or more translation results to the both automatic evaluation server and human evaluation.
18http://www.jpo.go.jp/shiryou/toushin/chousa/
tokkyohonyaku hyouka.htm
ASPEC JPC
Team ID Organization JE EJ JC CJ CJ KJ
NAIST (Neubig et al., 2015) Nara Institute of Science and Technology ✓ ✓ ✓ ✓
Kyoto-U (Richardson et al., 2015) Kyoto University ✓ ✓ ✓ ✓ ✓
WEBLIO MT (Zhu, 2015) Weblio, Inc. ✓
TMU (Matsuo et al., 2015) Tokyo Metropolitan University ✓
BJTUNLP (Shan et al., 2015) Beijing Jiaotong University ✓
Sense (Tan et al., 2015) Saarland University & Nanyang Technological University ✓ ✓ ✓ NICT (Ding et al., 2015) National Institute of Information and Communication Technology ✓ ✓
TOSHIBA (Sonoh and Kinoshita, 2015) Toshiba Corporation ✓ ✓ ✓ ✓ ✓ ✓
WASUIPS (Yang et al., 2015) Waseda University ✓
naver (Lee et al., 2015) NAVER Corporation ✓ ✓
EHR (Ehara, 2015) Ehara NLP Research Laboratory ✓ ✓ ✓ ✓
ntt (Sudoh and Nagata, 2015) NTT Communication Science Laboratories ✓
Table 5: List of participants who submitted translation results to WAT2015 and their participation in each subtasks.
7 Evaluation Results
In this section, the evaluation results for WAT2015 are reported from several perspectives. Some of the results for both automatic and human evalu- ations are also accessible at the WAT2015 web- site
19.
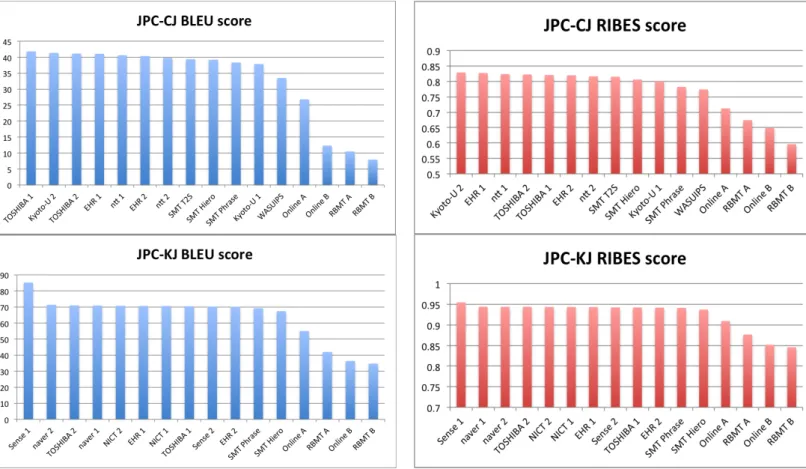
7.1 Official Automatic Evaluation Results Figures 3 and 4 show the official automatic evalua- tion results for the representative submissions and baseline systems. The automatic evaluation results for all the submissions are shown in Section Ap- pendix A.
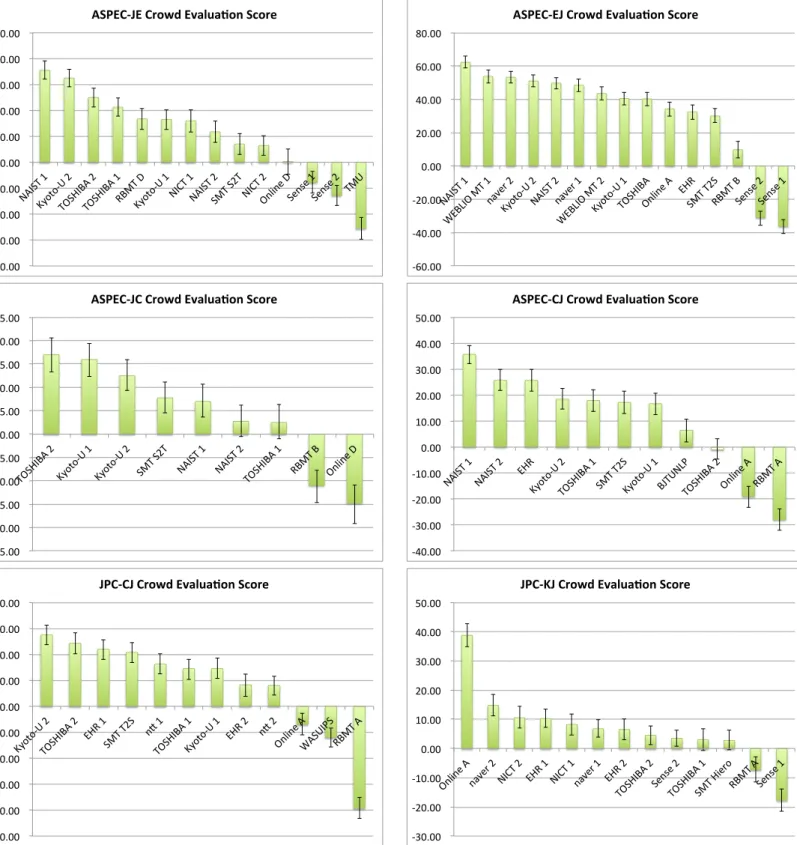
7.2 Official Crowdsourcing Evaluation Results
Crowd Score
Figure 5 shows the official crowdsourcing evalu- ation results. The error bars in the figures show the 95% confidence interval (see Section 5.1.4).
Note that overlapping error bars between two sub- missions do not necessarily mean that there is no significant difference. If an error bar crosses the x-axis (Crowd score = 0), it means that there is no significant difference between the submission and the baseline (SMT Phrase).
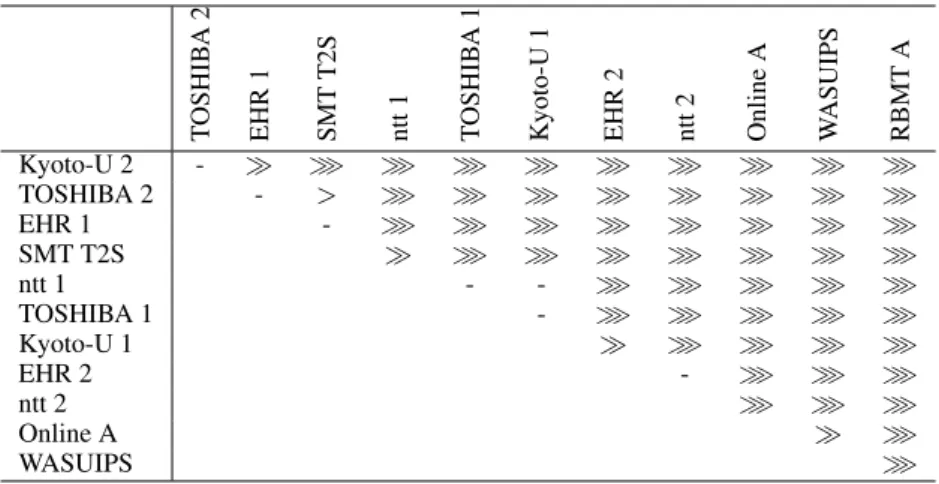
Statistical Significance Testing between Submissions
Tables 6, 7, 8, 9, 10 and 11 show the results of sta- tistical significance testing for the JE, EJ, JC and CJ translations respectively where all the pairs of submissions are tested. ≫ , ≫ and > mean that the system in the row is better than the system in
19http://lotus.kuee.kyoto-u.ac.jp/WAT/evaluation/index.html
the column at a significance level of p < 0.01, 0.05 and 0.1 respectively. Testing is also done by the bootstrap resampling as follows:
1. randomly select 300 sentences from the 400 crowdsourcing evaluation sentences, and cal- culate the Crowd scores on the selected sen- tences for both systems
2. iterate the previous step 1000 times and count the number of wins (W ), losses (L) and ties (T )
3. calculate p =
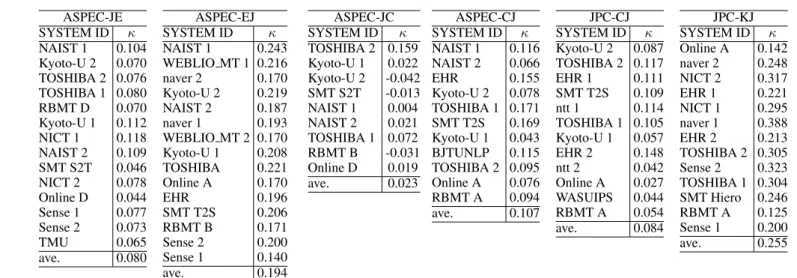
W+LLInter-annotator Agreement
To assess the reliability of agreement between the crowdsourcing workers, we calculated the Fleiss’
κ (Fleiss and others, 1971) values. The results are shown in Table 12. We can see that the κ val- ues are larger for X → J translations than for J
→ X translations. This may be because we used a Japanese crowdsourcing service for the evaluation and so the majority of the crowdsourcing workers are Japanese, and the evaluation of one’s mother tongue is much easier than for other languages in general. Also, K → J evaluations seem to be more consistent than the other directions. This may be because the quality of K → J translations are much better than the other directions.
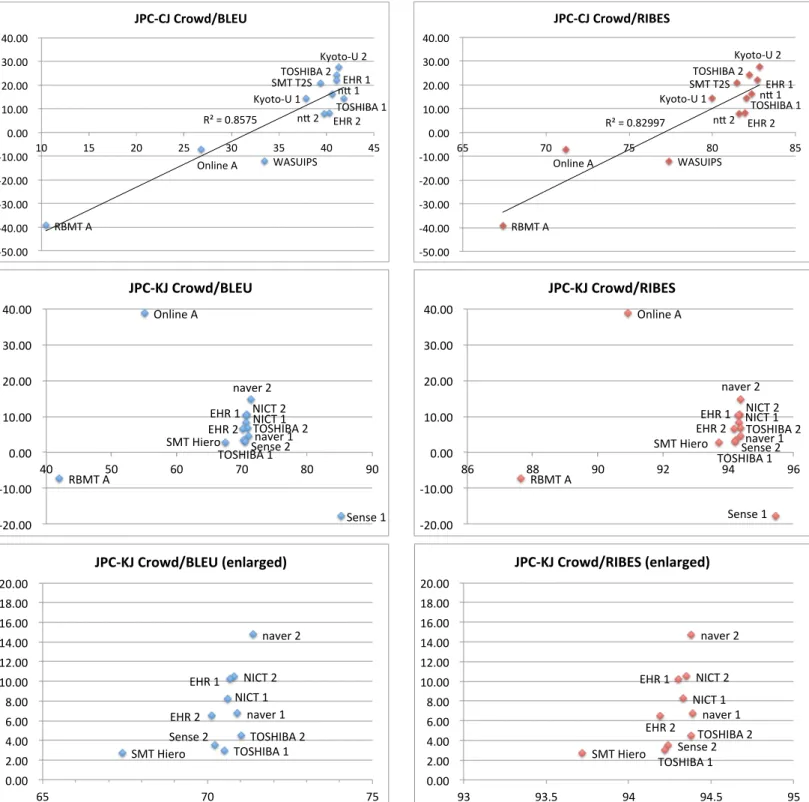
Correlation between Automatic and Crowdsourcing Evaluations
Figure 6 and 7 show the correlations between the
automatic evaluation measures (BLEU/RIBES)
and the Crowd score.
Kyoto-U2 TOSHIBA2 TOSHIBA1 RBMTD Kyoto-U1 NICT1 NAIST2 SMTS2T NICT2 OnlineD Sense1 Sense2 TMU
NAIST 1 - ≫ ≫ ≫ ≫ ≫ ≫ ≫ ≫ ≫ ≫ ≫ ≫
Kyoto-U 2 ≫ ≫ ≫ ≫ ≫ ≫ ≫ ≫ ≫ ≫ ≫ ≫
TOSHIBA 2 ≫ ≫ ≫ ≫ ≫ ≫ ≫ ≫ ≫ ≫ ≫
TOSHIBA 1 ≫ ≫ ≫ ≫ ≫ ≫ ≫ ≫ ≫ ≫
RBMT D - - ≫ ≫ ≫ ≫ ≫ ≫ ≫
Kyoto-U 1 - ≫ ≫ ≫ ≫ ≫ ≫ ≫
NICT 1 ≫ ≫ ≫ ≫ ≫ ≫ ≫
NAIST 2 ≫ ≫ ≫ ≫ ≫ ≫
SMT S2T - ≫ ≫ ≫ ≫
NICT 2 ≫ ≫ ≫ ≫
Online D ≫ ≫ ≫
Sense 1 ≫ ≫
Sense 2 ≫
Table 6: Statistical significance testing of the ASPEC-JE Crowd scores.
WEBLIOMT1 naver2 Kyoto-U2 NAIST2 naver1 WEBLIOMT2 Kyoto-U1 TOSHIBA OnlineA EHR SMTT2S RBMTB Sense2 Sense1
NAIST 1 ≫ ≫ ≫ ≫ ≫ ≫ ≫ ≫ ≫ ≫ ≫ ≫ ≫ ≫
WEBLIO MT 1 - > ≫ ≫ ≫ ≫ ≫ ≫ ≫ ≫ ≫ ≫ ≫
naver 2 - > ≫ ≫ ≫ ≫ ≫ ≫ ≫ ≫ ≫ ≫
Kyoto-U 2 - > ≫ ≫ ≫ ≫ ≫ ≫ ≫ ≫ ≫
NAIST 2 - ≫ ≫ ≫ ≫ ≫ ≫ ≫ ≫ ≫
naver 1 ≫ ≫ ≫ ≫ ≫ ≫ ≫ ≫ ≫
WEBLIO MT 2 > > ≫ ≫ ≫ ≫ ≫ ≫
Kyoto-U 1 - ≫ ≫ ≫ ≫ ≫ ≫
TOSHIBA ≫ ≫ ≫ ≫ ≫ ≫
Online A - ≫ ≫ ≫ ≫
EHR - ≫ ≫ ≫
SMT T2S ≫ ≫ ≫
RBMT B ≫ ≫
Sense 2 ≫
Table 7: Statistical significance testing of the ASPEC-EJ Crowd scores.
7.3 Chronological Evaluation
Figure 8 shows the chronological evaluation re- sults of ASPEC. The x-axis indicates the BLEU score and the y-axis indicates the Crowd score.
Note that the first 3 annotations among 5 by the crowdsourcing were used, and the decision for each sentence is made by the same criteria in WAT2014 for calculating the Crowd score of WAT2015 submissions.
7.4 Official JPO Adequacy Evaluation Results
Table 13 and Figure 9 show the JPO Adequacy Evaluation results for the selected submissions.
The weights for the weighted κ (Cohen, 1968) is defined as | Evaluation1 − Evaluation2 | /4.
As described in Section 5.2, we selected top 3
teams per subtask for the JPO adequacy evaluation according to the pairwise crowdsourcing evalua- tion results. However, for JPC K → J, we excep- tionally selected 4 teams including the top 3 teams and the Sense team. This is because the Sense team achieved notably better automatic evaluation scores, but got the worst crowdsourcing evaluation result, and we thought this is a very interesting case.
Figure 10 shows the summary of automatic and human evaluations for the selected submis- sions. We can see that all of Crowd, BLEU and RIBES scores partially correlate to the JPO ade- quacy score, but none of them perfectly correlates.
Especially, for JPC-KJ, both BLEU and RIBES
failed to correctly evaluate the quality of Sense
team.
Kyoto-U1 Kyoto-U2 SMTS2T NAIST1 NAIST2 TOSHIBA1 RBMTB OnlineD
TOSHIBA 2 - ≫ ≫ ≫ ≫ ≫ ≫ ≫
Kyoto-U 1 > ≫ ≫ ≫ ≫ ≫ ≫
Kyoto-U 2 ≫ ≫ ≫ ≫ ≫ ≫
SMT S2T - ≫ ≫ ≫ ≫
NAIST 1 ≫ ≫ ≫ ≫
NAIST 2 - ≫ ≫
TOSHIBA 1 ≫ ≫
RBMT B >
Table 8: Statistical significance testing of the ASPEC-JC Crowd scores.
NAIST2 EHR Kyoto-U2 TOSHIBA1 SMTT2S Kyoto-U1 BJTUNLP TOSHIBA2 OnlineA RBMTA
NAIST 1 ≫ ≫ ≫ ≫ ≫ ≫ ≫ ≫ ≫ ≫
NAIST 2 - ≫ ≫ ≫ ≫ ≫ ≫ ≫ ≫
EHR ≫ ≫ ≫ ≫ ≫ ≫ ≫ ≫
Kyoto-U 2 - - - ≫ ≫ ≫ ≫
TOSHIBA 1 - - ≫ ≫ ≫ ≫
SMT T2S - ≫ ≫ ≫ ≫
Kyoto-U 1 ≫ ≫ ≫ ≫
BJTUNLP ≫ ≫ ≫
TOSHIBA 2 ≫ ≫
Online A ≫
Table 9: Statistical significance testing of the ASPEC-CJ Crowd scores.
From the evaluation results, the following can be observed (see Figure 10):
• Neural Network based re-ranking is effective (NAIST, Kyoto-U, naver).
• The top SMT outperformed RBMT for CJ and KJ patent translation.
• K→J patent translation achieved high scores for automatic and human evaluations.
• A new problem of automatic evaluation was found in the KJ evaluation.
8 Submitted Data
The number of published automatic evaluation re- sults for the twelve teams exceeded 400 before the start of WAT2015, and 56 translation results for pairwise crowsdourcing evaluation were submit- ted by twelve teams. Furthermore, we selected 3 translation results from each subtask and eval- uated them for JPO adequacy evaluation. We will organize the all of the submitted data for human evaluation and make this public.
9 Conclusion and Future Perspective This paper summarizes the WAT2015 machine translation evaluation campaign. We had 12 par- ticipants worldwide, and collected a large num- ber of useful submissions for improving the cur- rent machine translation systems by analyzing the submissions and identifying the issues.
For the next WAT workshop, we plan to conduct context-aware MT evaluations. The test data for WAT are prepared using the paragraphs as the unit, while almost all other evaluation campaigns use the sentences as the unit. Therefore, it is suitable to investigate the importance of context in transla- tion.
We would also be very happy to include other languages if the resources are available.
Appendix A Submissions
Tables 14, 15, 16, 17, 18, 19, summarize all
the submissions listed in the automatic evalua-
tion server at the time of the WAT2015 work-
shop (16th, October, 2015). The OTHER RE-
SOURCES column shows the use of resources
such as parallel corpora, monolingual corpora and
TOSHIBA2 EHR1 SMTT2S ntt1 TOSHIBA1 Kyoto-U1 EHR2 ntt2 OnlineA WASUIPS RBMTA
Kyoto-U 2 - ≫ ≫ ≫ ≫ ≫ ≫ ≫ ≫ ≫ ≫
TOSHIBA 2 - > ≫ ≫ ≫ ≫ ≫ ≫ ≫ ≫
EHR 1 - ≫ ≫ ≫ ≫ ≫ ≫ ≫ ≫
SMT T2S ≫ ≫ ≫ ≫ ≫ ≫ ≫ ≫
ntt 1 - - ≫ ≫ ≫ ≫ ≫
TOSHIBA 1 - ≫ ≫ ≫ ≫ ≫
Kyoto-U 1 ≫ ≫ ≫ ≫ ≫
EHR 2 - ≫ ≫ ≫
ntt 2 ≫ ≫ ≫
Online A ≫ ≫
WASUIPS ≫
Table 10: Statistical significance testing of the JPC-CJ Crowd scores.
naver2 NICT2 EHR1 NICT1 naver1 EHR2 TOSHIBA2 Sense2 TOSHIBA1 SMTHiero RBMTA Sense1
Online A ≫ ≫ ≫ ≫ ≫ ≫ ≫ ≫ ≫ ≫ ≫ ≫
naver 2 ≫ ≫ ≫ ≫ ≫ ≫ ≫ ≫ ≫ ≫ ≫
NICT 2 - > ≫ ≫ ≫ ≫ ≫ ≫ ≫ ≫
EHR 1 - ≫ ≫ ≫ ≫ ≫ ≫ ≫ ≫
NICT 1 - - ≫ ≫ ≫ ≫ ≫ ≫
naver 1 - > ≫ ≫ ≫ ≫ ≫
EHR 2 - > ≫ > ≫ ≫
TOSHIBA 2 - - - ≫ ≫
Sense 2 - - ≫ ≫
TOSHIBA 1 - ≫ ≫
SMT Hiero ≫ ≫
RBMT A ≫
Table 11: Statistical significance testing of the JPC-KJ Crowd scores.
parallel dictionaries in addition to ASPEC or JPC.
ASPEC-JE SYSTEM ID κ NAIST 1 0.104 Kyoto-U 2 0.070 TOSHIBA 2 0.076 TOSHIBA 1 0.080 RBMT D 0.070 Kyoto-U 1 0.112 NICT 1 0.118 NAIST 2 0.109 SMT S2T 0.046 NICT 2 0.078 Online D 0.044 Sense 1 0.077 Sense 2 0.073
TMU 0.065
ave. 0.080
ASPEC-EJ
SYSTEM ID κ
NAIST 1 0.243 WEBLIO MT 1 0.216 naver 2 0.170 Kyoto-U 2 0.219 NAIST 2 0.187 naver 1 0.193 WEBLIO MT 2 0.170 Kyoto-U 1 0.208 TOSHIBA 0.221 Online A 0.170
EHR 0.196
SMT T2S 0.206
RBMT B 0.171
Sense 2 0.200 Sense 1 0.140
ave. 0.194
ASPEC-JC SYSTEM ID κ TOSHIBA 2 0.159 Kyoto-U 1 0.022 Kyoto-U 2 -0.042 SMT S2T -0.013 NAIST 1 0.004 NAIST 2 0.021 TOSHIBA 1 0.072 RBMT B -0.031 Online D 0.019
ave. 0.023
ASPEC-CJ SYSTEM ID κ NAIST 1 0.116 NAIST 2 0.066
EHR 0.155
Kyoto-U 2 0.078 TOSHIBA 1 0.171 SMT T2S 0.169 Kyoto-U 1 0.043 BJTUNLP 0.115 TOSHIBA 2 0.095 Online A 0.076 RBMT A 0.094
ave. 0.107
JPC-CJ SYSTEM ID κ Kyoto-U 2 0.087 TOSHIBA 2 0.117
EHR 1 0.111
SMT T2S 0.109
ntt 1 0.114
TOSHIBA 1 0.105 Kyoto-U 1 0.057
EHR 2 0.148
ntt 2 0.042
Online A 0.027 WASUIPS 0.044 RBMT A 0.054
ave. 0.084
JPC-KJ SYSTEM ID κ Online A 0.142 naver 2 0.248 NICT 2 0.317
EHR 1 0.221
NICT 1 0.295 naver 1 0.388
EHR 2 0.213
TOSHIBA 2 0.305 Sense 2 0.323 TOSHIBA 1 0.304 SMT Hiero 0.246 RBMT A 0.125 Sense 1 0.200
ave. 0.255
Table 12: The Fleiss’ kappa values for the crowdsourcing evaluation results.
ASPEC-JE Annotator A Annotator B all weighted
SYSTEM ID average average average κ κ
NAIST 1 3.605 4.055 3.830 0.250 0.439
Kyoto-U 2 3.495 3.805 3.650 0.296 0.475
TOSHIBA 2 3.450 3.755 3.600 0.269 0.459
ASPEC-EJ Annotator A Annotator B all weighted
SYSTEM ID average average average κ κ
NAIST 1 3.865 4.220 4.043 0.377 0.535
naver 2 3.760 4.240 4.000 0.371 0.544
WEBLIO MT 1 3.585 4.040 3.813 0.356 0.535
ASPEC-JC Annotator A Annotator B all weighted
SYSTEM ID average average average κ κ
NAIST 1 3.600 2.740 3.170 0.151 0.296
Kyoto-U 1 3.330 2.400 2.865 0.162 0.319
TOSHIBA 2 3.220 2.275 2.748 0.112 0.287
ASPEC-CJ Annotator A Annotator B all weighted
SYSTEM ID average average average κ κ
NAIST 1 3.970 3.785 3.878 0.247 0.417
Kyoto-U 2 3.785 3.700 3.743 0.292 0.433
EHR 3.250 3.245 3.248 0.199 0.418
JPC-CJ Annotator A Annotator B all weighted
SYSTEM ID average average average κ κ
Kyoto-U 2 3.570 3.245 3.408 0.287 0.513
EHR 1 3.410 3.225 3.318 0.351 0.531
TOSHIBA 2 3.405 3.095 3.250 0.349 0.557
JPC-KJ Annotator A Annotator B all weighted
SYSTEM ID average average average κ κ
naver 2 4.900 4.655 4.778 0.329 0.333
NICT 2 4.905 4.610 4.758 0.186 0.218
Online A 4.735 4.315 4.525 0.183 0.300
Sense 1 4.445 4.195 4.320 0.367 0.528
Table 13: JPO adequacy evaluation results.
Figure 3: Official automatic evaluation results of ASPEC.
Figure 4: Official automatic evaluation results of JPC.
!"#$##%%
!&#$##%%
!'#$##%%
!(#$##%%
#$##%%
(#$##%%
'#$##%%
&#$##%%
"#$##%%
)#$##%%
*+,-.%(%
/0121!3%'%.4-5,6+%'%.4-5,6+%(%768.%9%
/0121!3%(%
*,:.%(%
*+,-.%'%
-8.%-'.%*,:.%'%
4;<=;>
%9%
->;?>
%(% ->;?>%'
% .83%
!"#$%&'$(%)*+,($-./0.1*2("3*)4!
!"#$##%%
!&#$##%%
!'#$##%%
#$##%%
'#$##%%
&#$##%%
"#$##%%
(#$##%%
)*+,-%.%
/012+3%4-%.%
56789%'%
:;<=<!>%'%)*+,-%'%56789%.%
/012+3%4-%'%
:;<=<!>%.%-3,?+1*%35@A58
%*% 0?B%
,4-%-',%B14-%1%,8 5C8%'
% ,85C8%.
%
!"#$%&$'(%)*+,($-./0.1*2("3*)4!
!"#$%%&&
!"%$%%&&
!'#$%%&&
!'%$%%&&
!#$%%&&
%$%%&&
#$%%&&
'%$%%&&
'#$%%&&
"%$%%&&
"#$%%&&
()*+,-.&"& /0121!3&'& /0121!3&"& *4(&*"(& 5.,*(&'& 5.,*(&"&
()*+,-.&'& 6-4(&-& )7897:
&;&
!"#$%&'%(%)*+,($-./0.1*2("3*)4!
!"#$##%%
!&#$##%%
!'#$##%%
!(#$##%%
#$##%%
(#$##%%
'#$##%%
&#$##%%
"#$##%%
)#$##%%
*+,-.%(%*+,-.%'% /01%
23454!6%'%.7-0,8+%(%-9.%.'-%23454!6%(%8:.6*;
<%
.7-0,8+%'%7=>?=@
%+% 189.%+%
!"#$%&%'(%)*+,($-./0.1*2("3*)4!
!"#$##%%
!&#$##%%
!'#$##%%
!(#$##%%
!)#$##%%
#$##%%
)#$##%%
(#$##%%
'#$##%%
&#$##%%
*+,-,!.%(%/012345%(%
627%)%
18/%/(1%
9:%)
%
/012345%)%*+,-,!.%)%
627%(% 9:%(
% 09;<9=
%5%
>51.3?1% 748/%5%
!"#$#!%#&'()%*+,-.,/'0%12'&3!
!"#$##%%
!&#$##%%
!'#$##%%
#$##%%
'#$##%%
&#$##%%
"#$##%%
(#$##%%
)#$##%%
*+,-+.
%/%
+01.2%&% 3456%&% 789%'% 3456%'%+01.2%'% 789%&%
6*:84;/%&%
:.+<.
%&%
6*:84;/%'%:=6%8-.2>%9;=6%/%:.+<.
%'%
!"#$%!&#'()*&+,-./-0(1&23('4!
Figure 5: Official pairwise crowdsourcing evaluation results.
!"#$%&'&
()*+*,-&.&
%/$0#1"&.&
%/$0#1"&'&
213%&4& !#5%&'& ()*+*,-&'&
!"#$%&.&
$3%&$.%&
!#5%&.&
/67869&4&
$96:9&'&
$96:9&.&
%3-&
2;&<&=>?'@@A&
,B=>==&&
,.=>==&&
,'=>==&&
=>==&&
'=>==&&
.=>==&&
B=>==&&
C=>==&&
'C& '?& 'D& .=& ..& .C& .?&
!"#$%&'$(%)*+,-./$0!
!"#$%&'&
()*+*,-&.&
%/$0#1"&.&
%/$0#1"&'&
213%&4& ()*+*,-&'&
!#5%&'&
!"#$%&.&
$3%&$.%&
!#5%&.&
/67869&4&
$96:9&'&
$96:9&.&
%3-&
2;&<&=>??=@A&
,@=>==&&
,.=>==&&
,'=>==&&
=>==&&
'=>==&&
.=>==&&
@=>==&&
B=>==&&
C=& C.& CB& CC& CD& ?=& ?.& ?B& ?C&
!"#$%&'$(%)*+,-./0$"!
!"#$%&'&
()*+#,&-%&'&
./012&3&
4567689&3&
!"#$%&3&
./012&'&
()*+#,&-%&3&
4567689&'& %,$:#*"&
,.;<.1&"&
):=& $-%&%3$&
=*-%&*&
$1.>1&3&
$1.>1&'&
=?&@&ABCDEFG&
8EABAA&&
83ABAA&&
ABAA&&
3ABAA&&
EABAA&&
HABAA&&
'A& 'G& 3A& 3G& CA& CG& EA&
!"#$%&$'(%)*+,-./$0!
!"#$%&'&
()*+#,&-%&'&
./012&3&
4567689&3&
!"#$%&3& ./012&'&
()*+#,&-%&3&
4567689&'&
%,$:#*"&
,.;<.1&"&
):=&
$-%&%3$&
=*-%&*&
$1.>1&3&
$1.>1&'&
=?&@&ABCDE3&
8FABAA&&
83ABAA&&
ABAA&&
3ABAA&&
FABAA&&
GABAA&&
GA& GE& HA& HE& CA& CE&
!"#$%&$'(%)*+,-./0$"!
!"#$%&'()(
*+,-,./(0(
*+,-,./()(
#1!(#)!(
2'%#!(0(
2'%#!()(
!"#$%&'(0(
3&1!(&(
"45647(8(
39(:(;<=>0?(
.);<;;((
.0@<;;((
.0;<;;((
.@<;;((
;<;;((
@<;;((
0;<;;((
0@<;;((
);<;;((
0;( 0@( );( )@( A;( A@(
!"#$%&'%(%)*+,-./$0!
!"#$%&'()(
*+,-,./(0(
*+,-,./()(
#1!(#)!(
2'%#!(0(
2'%#!()(
!"#$%&'(0(
3&1!(&(
34(5(6789:);(
.)6766((
.0:766((
.06766((
.:766((
6766((
:766((
06766((
0:766((
)6766((
;<( ;8( ;=( =6( =)( =<(
!"#$%&'%(%)*+,-./0$"(
!"#$%&'&
!"#$%&(&
)*+&
,-./.01&(&
%2$*#3"&'&
$4%&%($&
,-./.01&'&
35%1!67&
%2$*#3"&(&
289:8;&"&
+34%&"&
+<&=&>?@A>>'&
0B>?>>&&
0C>?>>&&
0(>?>>&&
0'>?>>&&
>?>>&&
'>?>>&&
(>?>>&&
C>?>>&&
B>?>>&&
D& '>& 'D& (>& (D& C>& CD& B>& BD&
!"#$%&%'(%)*+,-./$0!
!"#$%&'&
!"#$%&(&
)*+&
,-./.01&(&
%2$*#3"&'&
$4%&%($&
,-./.01&'&
35%1!67&
%2$*#3"&(&
289:8;&"&
+34%&"&
+<&=&>?@A@BC&
0A>?>>&&
0D>?>>&&
0(>?>>&&
0'>?>>&&
>?>>&&
'>?>>&&
(>?>>&&
D>?>>&&
A>?>>&&
EE& F>& FE& @>& @E& C>& CE& B>&
!"#$%&%'(%)*+,-./0$"!
16
!"#$#%&'(' )*+,-./'('
0,1'2' +3)')(+'
45'2' )*+,-./'2'
!"#$#%&'2'
0,1'(' 45'('
*46748'/' 9/+&-:+'
1.3)'/'
1;'<'=>?@A@'
%@=>==''
%B=>==''
%C=>==''
%(=>==''
%2=>==''
=>=='' 2=>=='' (=>=='' C=>=='' B=>==''
2=' 2@' (=' (@' C=' C@' B=' B@'
!"#$#!%#&'()*+,-.%
!"#$#%&'(' )*+,-./'('
0,1'2' +3)')(+'
45'2' )*+,-./'2'
!"#$#%&'2'
0,1'(' 45'('
*46748'/' 9/+&-:+'
1.3)'/'
1;'<'=>?(@@A'
%B=>==''
%C=>==''
%D=>==''
%(=>==''
%2=>==''
=>=='' 2=>=='' (=>=='' D=>=='' C=>==''
EB' A=' AB' ?=' ?B'
!"#$#!%#&'()*+,-./%
!"#$"%&'&
"()%*&+&
,-./&+&
012&3&
,-./&3&
"()%*&3&
012&+& /!41-5'&+&
4%"6%&+&
/!41-5'&3&
47/&1$%*8&
257/&'&
4%"6%&3&
9+:;::&&
93:;::&&
:;::&&
3:;::&&
+:;::&&
<:;::&&
=:;::&&
=:& >:& ?:& @:& A:& B:&
!"#$%!&#'()*+,-./ !
!"#$"%&'&
"()%*&+&
,-./&+&
012&3& ,-./&3&
"()%*&3&
012&+& /!41-5'&+&
4%"6%&+&
/!41-5'&3&
47/&1$%*8&
257/&'&
4%"6%&3&
9+:;::&&
93:;::&&
:;::&&
3:;::&&
+:;::&&
<:;::&&
=:;::&&
>?& >>& @:& @+& @=& @?&
!"#$%!&#'()*+,-./0&
!"#$%&'&
()*+&'&
,-.&/&
()*+&/&
!"#$%&/&
,-.&'&
+01-)23&'&
1$!4$&'&
+01-)23&/&
15+&-6$%7&
8988&&
'988&&
:988&&
;988&&
<988&&
/8988&&
/'988&&
/:988&&
/;988&&
/<988&&
'8988&&
;=& >8& >=&
!"#$%!&#'()*+,-./&01234'51*6 !
!"#$%&'&
()*+&'&
,-.&/&
()*+&/&
!"#$%&/&
,-.&'&
+01-)23&'&
1$!4$&'&
+01-)23&/&
15+&-6$%7&
8988&&
'988&&
:988&&
;988&&
<988&&
/8988&&
/'988&&
/:988&&
/;988&&
/<988&&
'8988&&
=>& =>9?& =:& =:9?& =?&
!"#$%!&#'()*+,-./0&12345'62*7 !
Figure 7: The correlations between the BLEU/RIBES and Crowd scores of JPC.
!"#$
!%#$
!&#$
!'#$
#$
'#$
&#$
%#$
"#$
(#$
'"$ ')$ '*$ &#$ &&$ &"$ &)$
!"#$%&'$(%)*+,+-+./01-($21-314+,!
+,-./$
01232!4$
/5.6-7,$
/84$
.9:;9$
.8/$.&/$
5:<=:9$>$
?78/$>$
!"#$
!%#$
!&#$
#$
&#$
%#$
"#$
'#$
(#$
)#$
&#$ &($ %#$ %($ "#$ "($ '#$
!"#$%&$'(%)*+,+-+./01-($21-314+,!
*+,-.$
/012,345.$
67898!:$
-;<=;$
-5.$.%-$
3<>?<;$+$
@15.$1$
!"#$
!%&$
!%#$
!&$
#$
&$
%#$
%&$
"#$
&$ %#$ %&$ "#$ "&$ '#$ '&$
!"#$%&'%(%)*+,+-+./01-($21-314+,!
()*+,$
-./0/!1$
,2+3*4)$
+5,$+",$
267869$:$
;45,$4$
!"#$
!%#$
!&#$
!'#$
#$
'#$
&#$
%#$
"#$
(#$
#$ ($ '#$ '($ &#$ &($ %#$ %($ "#$ "($
!"#$%&%'(%)*+,+-+./01-($21-314+,!
)*+,-$
./010!2$
345$
,6-$-&,$
789:8;$*$
5<6-$*$
Figure 8: The chronological evaluation results of ASPEC. (The x-axis indicates the BLEU score and the
y-axis indicates the Crowd score.)
!"#$%&
!'#$%& !$&
!(#%&
$)& $)#$%&
')#$%&
$*#"%& $'#$%&
'(& '$#%&
''&
)& %#%& +#%&
(,&
'(,&
$(,&
!(,&
*(,&
%(,&
)(,&
"(,&
-(,&
+(,&
'((,&
./012&'& 3456578&$& 291:0;/&$&
!"#$%&'$(!)*+,-./($0-1,-234(5*6,176!
'&
$&
!&
*&
%&
!"#$"% !"#$"%
&'%
&(#$"% $)%
$*#$"%
+(% +!%
+)%
+$#"% +&%
+"#"%
$% +#*"% &#$"%
(,%
+(,%
$(,%
&(,%
!(,%
"(,%
)(,%
*(,%
'(,%
-(,%
+((,%
./012%+% 34567%$% 89:;0<=>2%+%
!"#$%&$'(!)*+,-./($0-1,-234(5*6,176!
+%
$%
&%
!%
"%
!"#$%
!&% '#"$%
&$#$%
&!%
&(%
&$#&$%
&$#"$%
&$%
&(%
&)%
&$#"$%
!!#"$%
!"#&$% !'#$%
(*%
!(*%
&(*%
+(*%
)(*%
$(*%
,(*%
"(*%
-(*%
'(*%
!((*%
./012%!% 3456578%!% 291:0;/%&%
!"#$%&'%(!)*+,-./($0-1,-234(5*6,176!
!%
&%
+%
)%
$%
!"#$% !$#&$%
'(#&$%
(&%
()#&$%
!*%
!+#&$%
!*#&$%
()#!$%
$#!$% "#$%
'&#!$%
'#$% '#!$%
+#&$%
,-%
',-%
!,-%
(,-%
),-%
$,-%
+,-%
&,-%
*,-%
",-%
',,-%
./012%'% 3456578%!% 9:;%
!"#$%&%'(!)*+,-./($0-1,-234(5*6,176!
'%
!%
(%
)%
$%
!"#$%&
!'#$%& !'#%&
'(#%&
!!#!%& !)&
!*#$%& *)& *)#%&
'(#$%& '(& '(&
"#!%& (& ')&
)+&
')+&
!)+&
*)+&
,)+&
%)+&
-)+&
$)+&
()+&
")+&
'))+&
./01023&!& 456&'& 7895:;<&!&
!"#$#!%&'()*+,-%./+0*+123%4(5*065!
'&
!&
*&
,&
%&
!"#!$% !!%
&'#($% $"#$%
('#($% ()#!$%
*(#$%
(*#!$%
)% )#($%
&#!$%
))%
'#$%
+#!$%(%
',%
)',%
(',%
*',%
+',%
$',%
&',%
!',%
"',%
-',%
)'',%
./012%(% 3456%(% 7.89.1%:% ;1.<1%)%
!"#$%!&'()*+,-.&/0,1+,234&5)6+176!
)%
(%
*%
+%
$%
Figure 9: Distribution of JPO adequacy evaluations.
!"#!$$
!"%&$$ !"%'$$
!&"&'$$
!("&'$$
(&"''$$
(&")*$$
(("#+$$ (("#+$$
,)"+%$$
,(")%$$ ,*"#&$$
'$$
*'$$
('$$
!'$$
)'$$
&'$$
%'$$
,'$$
#'$$
'$$
*$$
($$
!$$
)$$
&$$
-./01$*$ 2345467$($ 1809/:.$($
!"#$%&'()*&+,')-!
.%/01234!
.-5)!67)8)92:12;#<8-1==2"4!
.;<=>?@3$
AB4C;$
:DE7$
F/:E0$
!"#!$$ !"##$$
%"&'$$
()")*$$
*%")*$$ *%"+*$$
%*"&%$$ %!"(#$$ %%")%$$
&'"'*$$ &#"##$$ &#"!+$$
#$$
'#$$
)#$$
%#$$
!#$$
*#$$
(#$$
+#$$
&#$$
,#$$
#$$
'$$
)$$
%$$
!$$
*$$
-./01$'$ 23456$)$ 789:/;<=1$'$
!"#$%&'()*&+,')-!
.%/01234!
.-5)!6)78)92:12;#<8-1==2"4!
.>5?@3AB$
C6DE>$
9:8F$
G/980$
!"#$%%
&"'$%%
&"$(%%
$"))%%
#*"))%% #$"))%%
!#"*#%% &+"++%% !)")$%%
'!"&'%%
')"$#%% '#"$!%%
)%%
#)%%
&)%%
!)%%
,)%%
()%%
*)%%
$)%%
')%%
+)%%
)%%
#%%
&%%
!%%
,%%
(%%
-./01%#% 2345467%#% 1809/:.%&%
!"#$%&'()*&+,')-!
.%/012345
.-6)!78!5)92:12;#<5-1==2"4!
.;<=>?@3%
AB4C;%
:DE7%
F/:E0%
!"##$$
!"%&$$
!"'($$
!("%($$
)#"(*$$
'("%($$
&)"%($$
!#"(!$$ !%"+*$$
#("()$$ #&"*%$$ #'",*$$
*$$
)*$$
'*$$
!*$$
&*$$
(*$$
,*$$
%*$$
#*$$
+*$$
*$$
)$$
'$$
!$$
&$$
($$
-./01$)$ 2345467$'$ 89:$
!"#$%&'()*&+,')-!
.%/012345
.-6)!7!85)92:12;#<5-1==2"4! .;<=>?@3$
AB4C;$
DE87$
:/D80$
!"#$%% !"!&%% !"&'%%
&("')%%
&&"))%% &#"&'%%
#$"!'%% #$")*%% #$"$&%%
+&"+'%% +&"()%% +&"&&%%
)%%
$)%%
&)%%
!)%%
#)%%
')%%
*)%%
()%%
+)%%
,)%%
)%%
$%%
&%%
!%%
#%%
'%%
-./0/12%&% 345%$% 67849:;%&%
!"#$%&'()*&+,')-.
/%012345!
67!8!6.)93:23;#<.-2==3"5!
;<=>?@A.%
BC/D<%
:E32%
59:38%
!"#$%% !"#&%%
!"'(%%
!"()%%
*!"#'%%
*+"'+%%
($"#'%%
,*#"#'%%
#*"($%% #+"$*%%
''"+'%%
$'")(%%
-!"($%% -!"('%%
-+"-)%% -'"!'%%
,)+%%
+%%
)+%%
!+%%
&+%%
$+%%
*++%%
,*%%
+%%
*%%
)%%
(%%
!%%
'%%
./012%)% 3456%)% 7.89.1%:% ;1.<1%*%
!"#$%&'()*&+,')-!
.%/01234!
56!7859):2;12<#=9-1>>2"49
:=1>?/@A%
52BC=%
DEFG%
H4DF;%
Figure 10: Summary of automatic and human evaluations.
SYSTEMIDIDMETHODOTHERRESOURCESBLEURIBESCrowdSYSTEMDESCRIPTION SMTHiero2SMTNO18.720.651066+7.75HierarchicalPhrase-basedSMT(2014) SMTPhrase6SMTNO18.450.645137—–Phrase-basedSMT SMTS2T9SMTNO20.360.678253+25.50String-to-TreeSMT(2014) RBMTE76OtherYES14.820.663851—–RBMTE RBMTF79OtherYES13.860.661387—–RBMTF OnlineD775OtherYES16.850.676609+0.25OnlineD(2015) SMTS2T877SMTNO20.360.678253+7.00String-to-TreeSMT(2015) RBMTD887OtherYES15.290.683378+16.75RBMTD(2015) OnlineC892OtherYES10.290.622564—–OnlineC(2015) NAIST1655SMTNO25.410.749573+35.50TravatarSystemwithNeuralMTRerankingandParserSelfTraining NAIST2766SMTNO22.620.722798+11.75TravatarSystemwithParserSelfTraining Kyoto-U1796EBMTNO21.310.706480+16.50KyotoEBMTsystemwithoutreranking Kyoto-U2829EBMTNO22.890.724555+32.50KyotoEBMTsystemwithbilingualRNNLMreranking TMU847SMTNO15.850.628897-25.50PBSMTwithdependencybasedphrasesegmentation Sense1860SMTYES16.960.610775-7.75PassiveJSTx1 Sense2861SMTYES16.610.609008-12.75PervasiveJSTx1 NICT1488SMTNO18.980.659883+16.00ourbaseline(DL=6)+dependency-basedpre-reordering[Ding+2015] NICT2492SMTNO18.960.684485+6.50ourbaseline(DL=9)+reversepre-reordering[Katz-Brown&Collins2008] TOSHIBA1506SMTandRBMTYES23.000.715795+21.25SystemcombinationSMTandRBMT(SPE)withRNNLMlanguagemodel TOSHIBA2529SMTandRBMTYES22.890.718540+25.00RBMTwithSPE(StatisticalPostEditing)system
T able 14: ASPEC-JE submissions
SYSTEMIDIDMETHODOTHERBLEURIBES CrowdSYSTEMDESCRIPTION RESOURCESjumankyteamecabjumankyteamecab SMTPhrase5SMTNO27.4829.8028.270.6837350.6919260.695390—–Phrase-basedSMT SMTT2S12SMTNO31.0533.4432.100.7488830.7580310.760516+34.25Tree-to-StringSMT(2014) RBMTA68OtherYES12.8614.4313.160.6701670.6764640.678934—–RBMTA RBMTC95OtherYES12.1913.3212.140.6683720.6726450.676018—–RBMTC SMTHiero367SMTNO30.1932.5630.940.7347050.7469780.747722+31.50HierarchicalPhrase-basedSMT(2014) OnlineA774OtherYES18.2219.7718.460.7058820.7139600.718150+34.25OnlineA(2015) SMTT2S875SMTNO31.0533.4432.100.7488830.7580310.760516+30.00Tree-to-StringSMT(2015) RBMTB883OtherYES13.1814.8513.480.6719580.6807480.682683+9.75RBMTB(2015) OnlineB889OtherYES17.8019.5218.110.6933590.7019660.703859—–OnlineB(2015) NAIST1761SMTNO35.8338.1736.610.8114790.8138270.820337+62.25TravatarSystemwithNeuralMTReranking NAIST2763SMTNO34.3836.5835.160.7924470.7964890.802228+49.75TravatarSystemBaseline Kyoto-U1805EBMTNO30.6933.2531.710.7677780.7766720.778358+40.50KyotoEBMTsystemwithoutreranking Kyoto-U2832EBMTNO33.0635.5733.990.7895140.7971820.799979+51.00KyotoEBMTsystemwithbilingualRNNLMreranking WEBLIOMT1786SMTNO33.2336.2134.050.8047220.8090650.814337+53.75NMT,LSTMSearch,5ensembles,beamsize20,UNKreplac- ing,SystemCombinationwithNMTscore(Picktop-1kresults fromNMT) WEBLIOMT2813OtherNO30.7234.1931.570.7968630.8026660.807186+43.50NMT,LSTMSearch,BeamSize20,Ensembleof2models, UNKreplacing Sense1700SMTNO24.1326.2424.960.6373780.6427890.647831-36.25Baseline-dictmt Sense2715SMTYES24.4326.5825.360.6359330.6415170.646682-31.00PassiveJSTx3 TOSHIBA524SMTandRBMTYES32.0634.1732.760.7709890.7785700.780467+40.25RBMTwithSPE(StatisticalPostEditing)system naver1836SMTNO33.1435.7533.930.8072800.8114870.817343+48.50NMTonly naver2837SMTNO34.6036.1435.300.7999660.8031540.808787+53.25SMTt2s+Spellcorrection+NMTreranking EHR742SMTNO29.7832.3630.710.7535760.7660440.768105+32.50PhrasebasedSMTwithpreordering.
T able 15: ASPEC-EJ submissions
SYSTEMIDIDMETHODOTHERBLEURIBES CrowdSYSTEMDESCRIPTION RESOURCESkyteastanford (ctb)stanford (pku)kyteastanford (ctb)stanford (pku) SMTHiero3SMTNO27.7127.7027.350.8091280.8095610.811394+3.75HierarchicalPhrase-basedSMT(2014) SMTPhrase7SMTNO27.9628.0127.680.7889610.7902630.790937—–Phrase-basedSMT SMTS2T10SMTNO28.6528.6528.350.8076060.8094570.808417+14.00String-to-TreeSMT(2014) RBMTC244RBMTNO9.629.969.590.6422780.6487580.645385—–RBMTC OnlineD777OtherYES10.7310.3310.080.6604840.6608470.660482-14.75OnlineD(2015) SMTS2T881SMTNO28.6528.6528.350.8076060.8094570.808417+7.75String-to-TreeSMT(2015) RBMTB886OtherYES17.8617.7517.490.7448180.7458850.743794-11.00RBMTB(2015) OnlineC891OtherYES7.447.056.750.6119640.6150480.612158—–OnlineC(2015) NAIST1838SMTNO31.6131.5931.420.8327650.8342450.833721+7.00TravatarSystemwithNeuralMTReranking NAIST2839SMTNO30.0629.9229.730.8150840.8166240.816462+2.75TravatarSystemBaseline Kyoto-U1778EBMTNO29.9929.7629.810.8070830.8082750.808010+16.00KyotoEBMTsystemwithoutreranking Kyoto-U2793EBMTNO31.4031.2631.230.8269860.8269190.827190+12.50KyotoEBMTsystemwithbilingualRNNLMreranking TOSHIBA1505SMTandRBMTYES30.1730.1529.890.8134900.8132330.813441+2.50SPE(StatisticalPostEditing)System TOSHIBA2676SMTandRBMTYES30.0730.1429.830.8172940.8169840.816981+17.00SystemcombinationSMTandRBMT(SPE)withRNNLMlan- guagemodel+post-processing
T able 16: ASPEC-JC submissions
SYSTEMIDIDMETHODOTHERBLEURIBES CrowdSYSTEMDESCRIPTION RESOURCESjumankyteamecabjumankyteamecab SMTHiero4SMTNO35.4335.9135.640.8104060.7987260.807665+4.75HierarchicalPhrase-basedSMT(2014) SMTPhrase8SMTNO34.6535.1634.770.7724980.7663840.771005—–Phrase-basedSMT SMTT2S13SMTNO36.5237.0736.640.8252920.8204900.825025+16.00Tree-to-StringSMT(2014) RBMTD242RBMTNO8.398.708.300.6411890.6264000.633319—–RBMTD OnlineA776OtherYES11.5312.8211.680.5882850.5903930.592887-19.00OnlineA(2015) SMTT2S879SMTNO36.5237.0736.640.8252920.8204900.825025+17.25Tree-to-StringSMT(2015) RBMTA885OtherYES9.379.879.350.6662770.6524020.661730-28.00RBMTA(2015) OnlineB890OtherYES10.4111.0310.360.5973550.5928410.597298—–OnlineB(2015) NAIST1834SMTNO41.7542.9541.930.8550890.8477460.854587+35.75TravatarSystemwithNeuralMTReranking NAIST2835SMTNO39.3640.5139.470.8343880.8271480.834130+25.75TravatarSystemBaseline Kyoto-U1844EBMTNO36.3037.2236.440.8197430.8145810.818794+16.75KyotoEBMTsystemwithoutreranking Kyoto-U2845EBMTNO38.5339.4138.660.8406810.8344510.839063+18.50KyotoEBMTsystemwithbilingualRNNLMreranking BJTUNLP862SMTNO34.7234.8734.790.8070120.7924880.802430+6.50adependency-to-stringmodelforSMT TOSHIBA1508SMTandRBMTYES37.4737.4437.340.8272910.8173950.825472+18.00SystemcombinationSMTandRBMT(SPE)withRNNLMlan- guagemodel TOSHIBA2525SMTandRBMTYES35.8536.0235.730.8247400.8153880.822423-1.00RBMTwithSPE(StatisticalPostEditing)system EHR720SMTandRBMTYES37.9038.6837.980.8260030.8186200.824806+25.75SystemcombinationofRBMTwithuserdictionaryplusSPE andphrasebasedSMTwithpreordering.Candidateselection bylanguagemodelscore.
T able 17: ASPEC-CJ submissions
SYSTEMIDIDMETHODOTHERBLEURIBES CrowdSYSTEMDESCRIPTION RESOURCESjumankyteamecabjumankyteamecab SMTHiero430SMTNO39.2239.5239.140.8060580.8020590.804523—–HierarchicalPhrase-basedSMT SMTPhrase431SMTNO38.3438.5138.220.7820190.7789210.781456—–Phrase-basedSMT SMTT2S432SMTNO39.3939.9039.390.8149190.8113500.813595+20.75Tree-to-StringSMT(2015) OnlineA647OtherYES26.8027.8126.890.7122420.7072640.711273-7.00OnlineA(2015) OnlineB648OtherYES12.3312.7212.440.6489960.6412550.648742—–OnlineB(2015) RBMTA759RBMTNO10.4910.7210.350.6740600.6640980.667349-39.25RBMTA(2015) RBMTB760RBMTNO7.948.077.730.5962000.5818370.586941—–RBMTB Kyoto-U1781EBMTNO37.8738.6237.710.7997300.7977000.798979+14.50Baselinew/oreranking Kyoto-U2864EBMTNO41.3541.9241.160.8285430.8241990.827230+27.50KyotoEBMTsystemwithbilingualRNNLMreranking(only character-basemodel) TOSHIBA1504SMTandRBMTYES41.8241.9041.600.8205680.8135360.817614+14.50Combinationofphrase-basedSMTandSPEsystems. TOSHIBA2526SMTandRBMTYES41.1240.8740.590.8222680.8142490.818981+24.25RBMTwithSPE(StatisticalPostEditing)system WASUIPS853SMTNO33.4834.5533.550.7739850.7710990.772202-12.00Combiningsampling-basedalignmentandbilingualhierarchi- calsub-sententialalignmentmethods. EHR1671SMTandRBMTYES41.0642.2441.150.8269870.8219830.825056+22.00SystemcombinationofRBMTwithuserdictionaryplusSPE andphrasebasedSMTwithpreordering.Candidateselection bylanguagemodelscore. EHR2828SMTandRBMTYES40.3540.1639.920.8195160.8129820.816743+8.25RBMTwithuserdictionaryplusSPE ntt1736SMTNO40.6041.1040.630.8234360.8202520.822026+16.25Apre-ordering-basedPBMTwithpatent-tuneddependency parsingandphrasetablesmoothing. ntt2811SMTNO39.7740.0839.880.8162880.8119110.815543+8.00Apre-ordering-basedPBMTwithpatent-tuneddependency parsing,learning-basedpre-ordering,andphrasetablesmooth- ing.
T able 18: JPC-CJ submissions
SYSTEMIDIDMETHODOTHERBLEURIBES CrowdSYSTEMDESCRIPTION RESOURCESjumankyteamecabjumankyteamecab SMTPhrase438SMTNO69.2270.3669.730.9413020.9397290.940756—–Phrase-basedSMT SMTHiero439SMTNO67.4168.6568.000.9371620.9359030.936570+2.75HierarchicalPhrase-basedSMT(2015) OnlineB651OtherYES36.4138.7237.010.8517450.8522630.851945—–OnlineB(2015) OnlineA652OtherYES55.0556.8455.460.9091520.9093850.908838+38.75OnlineA(2015) RBMTA653OtherYES42.0043.9742.450.8763960.8737340.875146-7.25RBMTA(2015) RBMTB654OtherYES34.7437.5135.540.8457120.8490140.846228—–RBMTB Sense1657SMTNO85.2385.2085.230.9545060.9544480.954435-17.75Unicode2StringwithdevtestMERTrun2 Sense2833SMTNO70.2371.1170.510.9424150.9408870.941687+3.50Baselinewithonlytrain.ja/ko NICT1501SMTNO70.6271.5270.920.9433480.9424020.942748+8.25ourbaseline:character-based/PBSMTinMOSES(DL=0, max-phrase-len=9,nolex-reordering)/SRILM(9-gram) NICT2513SMTNO70.8171.7071.110.9434630.9425190.942904+10.50ourbaseline+post-processingofbracketbalancing TOSHIBA1554SMTandRBMTYES70.5170.8470.710.9421830.9395450.941471+3.00SystemcombinationSMT,SPEandRBMTwithRNNLM+ post-processing TOSHIBA2568SMTYES71.0171.4471.260.9437940.9412870.943181+4.50Phrase-basedSMTwithRNNLMreranking+post-processing naver1630SMTNO70.9171.7671.180.9439280.9428000.943376+6.75combinedtwophrase-basedsystems,post-processing naver2816SMTNO71.3872.2771.680.9438140.9428050.943584+14.75SMTPB+NMTreranking EHR1500SMTandRBMTYES70.6771.5270.930.9430400.9418930.942771+10.25SystemcombinationofRBMTwithuserdictionaryplusSPE andphrasebasedSMT.Candidateselectionbylanguagemodel score. EHR2831SMTandRBMTYES70.1370.8670.350.9418870.9403410.941517+6.50RBMTwithuserdictionaryplusSPE