1. Introduction
With the functional and structural deterioration, there is an increasing demand for demolition of industrial structures. Mechanical demolition techniques using large breaker, crusher, and diamond wire saw (D.W.S) have been applied to the demolition of industrial structures in usual. With the increasing demand for demolition, various demolition techniques have been developed and applied to control environmentally hazardous factors. There is an increasing application of explosive demolition technique that minimizes the temporal and spatial hazardous factors generated when applying mechanical demolition and considers the constructability and economic feasibility.
Among industrial structures, large-scale concrete foundation has the structural characteristics of large scale, high strength and high rigidity and thus application of some mechanical demolition techniques is limited. There is an increasing application of explosive demolition or explosive demolition combined with mechanical demolition to large scale concrete foundation demolition for the purpose of increasing the working efficiency. In addition, explosive demolition of concrete foundation accounts for
31.4% (16 cases) of explosive demolition of the civil structure that was recently performed in Korea and the number of explosive demolition is expected to increase continuously
1). The effect of ground vibration should be particularly taken into account because most large-scale concrete foundations are underground structures making a direct contact with the ground foundation.
Various studies have been conducted on ground vibration with respect to rock blasting in which the ground is drilled, but the study on the ground vibration in blast of concrete foundation near to ground foundation is not sufficient. Various models have been developed to predict and analyze the fragment size in rock blasting, and they have been applied to actual blasting sites, analyzing various blast conditions
2)6). However, the fragment size in concrete blasting was analyzed by simply comparing the area ratios of before and after blasting in a small-scaled model
7), and the particle size distribution has not been interpreted yet.
Therefore, to provide the fundamental data for the design of large-scale concrete foundation explosive demolition in this study, we compared peak particle
Blast design for explosive demolition of a large-scale concrete foundation
Hoon Park
*†, Hyeong-Ki Park
**, Jin-Hee Ko
**, and Chul-Gi Suk
***
Chonbuk National University, 66414 Duckjin-dong, Duckjin-gu, Jeonju, 561756, KOREA Phone +82632702358
†
Corresponding address : [email protected]
**
Korea Kacoh Co., Ltd., 108737 Daerim-dong, Yeongdeungpo-gu, Seoul, 150070, KOREA Received : November 14, 2011 Accepted : July 9, 2012
Abstract
With the deterioration and functional loss of structures, there is an increasing demand for demolition and various demolition technologies have been developed. In case of large-scale concrete, application of some mechanical demolition techniques is limited because of the structural characteristics, and explosive demolition or explosive demolition combined with mechanical demolition is applied recently due to the effect to the surrounding environment by the ground vibration.
In this study, we compared peak particle velocity (PPV) of ground vibration depending on average fragment size (!
!#) in case of explosive demolition design for large-scale concrete foundation using the relation among specific charge ("
"), charge constant (K), and transmitting medium constant (n) as well as the relation between average concrete fragment size ( !
!#) and specific charge ("
").
Keywords : concrete foundation, explosive demolition, fragmentation, ground vibration.
Research
paper
velocity (PPV) of ground vibration depending on average fragment size ( "
(+) using the relation among specific charge (&
)), charge constant (K ) and transmitting medium constant (n) as well as the relation between average concrete fragment size ("
(+) and specific charge (&
)).
2. Experimental method
Concrete blasting was performed on five concrete foundations of the same scale, varying the specific charge.
The average compressive strength of the concrete foundations was 21.8 MPa. Table 1 shows the design pattern of each type. Figure 1 and 2 show the design floor plans and the cross sections of the concrete foundations.
Four holes were drilled for each type using a manual rock drill. The used explosive was MegaMEX, an emulsion type explosive, of which average detonation velocity is 6,000 m s
-1and diameter of cartridge is 32 mm. The used detonator was HiDETO Plus, an instantaneous electric detonator. The four holes of each type were ignited simultaneously. To prevent scattering of concrete fragments, a tire mat of # ! &*" ' ! !* was used to cover the top and sides of the blast target concrete foundation for protection.
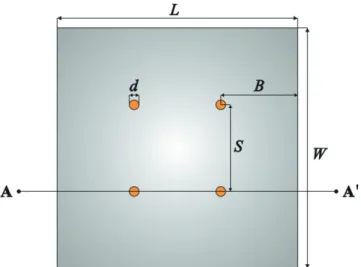
Figure 3 shows the location drawing of ground vibration measurement positions. The measurement positions for TYPE!, TYPE" and TYPE# were MP1 to MP6. In the
cases of TYPE$ and TYPE%, the measurement position MP5 was moved to the MP7 position and the rest of the measurement positions were the same with those of TYPE ! , TYPE " and TYPE # . A linear regression analysis was performed on the measured data to derive the prediction equation of ground vibration for each type.
After the blast, images of the concrete foundation fragment were taken for each type. To compare the concrete foundation fragment size depending on the specific charge, the average fragment size was analyzed using WipFrag software, the particle size analysis software.
3. Results and discussion 3.1 Ground vibration
Table 2 shows the ground vibration measurements of each type. Six data were acquired for each type, and thus the total number of the data was 30. The distance from the center of the blasted concrete foundation to the measurement points was &*#&' ! $* . The PPV of each composition among the entire data was 13.60 mm s
-1at the distance of 5 m, which is the nearest measurement position and 0.44 mm s
-1at the distance of 56.3 m, which is the farthest measurement position.
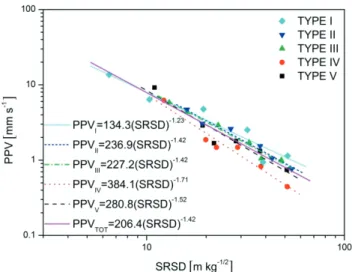
Figure 4 shows the PPV of each type and the linear regression curve of 50% according to the square-root scaled distance (SRSD). The range of the charge constant, K , was 134.3-384.1, and that of the transmitting medium constant, n, was 1.23-1.71. The K for the entire data was 206.4 and that of the n was ! " ! %# .
Figure 5 shows the comparison between the &
)and the
Table1The explosive demolition design patterns of concrete foundation for each type.
Classification
! " # $ %Dimension ($
")"#, m)2.5 2.5 1.04
Volume (( , m
3) 6.5
Borehole diameter (+ , mm) 38
Number of holes (
%,, ea) 4
Borehole length (- , m) 0.55 0.55 0.65 0.60 0.65
Length of charge (-
*,, mm) 126 168 210 250 250
Length of stemming (-
., mm) 424 382 440 350 400
Spacing (& , m) 0.9 0.9 1.0 1.0 1.1
Burden (! , m) 0.80 0.80 0.75 0.75 0.70
Charge per hole (#
*, kg) 0.15 0.20 0.25 0.30 0.30
Specific charge (&
*, kg m
−3) 0.379 0.505 0.513 0.667 0.599
Total mass of charge (
'*, kg) 0.6 0.8 1.0 1.2 1.2
Figure2
The design cross section of concrete foundation.
Figure1
The design floor plan of concrete foundation.
3
8
9
K and between the %
,and the n for each type. As the %
,was increased, the K was increased but the n was decreased. Thus, the tendency was that the PPV was increased as the %
,was increased to blast the equal volume of concrete.
The following Equation (1) is the relation between the %
,and the K and Equation (2) is the relation between the %
,and the n.
"#!$*& ! & " *$* ! (! %
'" (1)
$
%## ! +'+
( #! # ! '+* ! $ ! ($+! %
'" (2)
$
%## ! +)&
where $
%denotes the correlation constant.
3.2 Fragmentation
The fragment size distribution curve, Rosin-Rammler, used in the WipFrag software is as in Equation (3) :
! ! &" #$ ! -/.! &
&
'! "
## $ (3)
where ! ! &" denotes the ratio of passing the screen of the size & , &the size of the screen, &
'the characteristic size and N the uniformity index.
With Equation (3), the fragment size distribution can be expressed and evaluated using only two parameters. The
Table2The measured PPV of ground vibration for each type.
TYPE Measuring point Distance [m]
Delay charge [kg]
Tran.
[mm s
−1]
Vert.
[mm s
−1]
Long.
[mm s
−1]
!
MP1 5.0 0.6 7.95 13.10 13.60
MP2 8.0 0.6 6.40 2.54 3.24
MP3 15.0 0.6 4.76 1.65 3.91
MP4 25.0 0.6 2.52 0.51 1.14
MP5 30.0 0.6 0.91 0.71 0.94
MP6 40.0 0.6 1.14 0.48 0.81
"
MP1 14.3 0.8 4.70 3.22 4.11
MP2 17.1 0.8 2.27 0.89 3.06
MP3 23.8 0.8 2.60 0.68 2.59
MP4 33.5 0.8 1.54 0.49 1.48
MP5 38.5 0.8 0.75 1.05 0.92
MP6 48.4 0.8 0.76 0.67 0.70
#
MP1 13.0 1.0 1.51 4.73 5.81
MP2 16.0 1.0 0.97 1.00 4.32
MP3 23.0 1.0 1.21 0.62 2.91
MP4 33.0 1.0 1.05 0.51 1.71
MP5 38.0 1.0 0.57 1.05 0.97
MP6 48.0 1.0 0.67 0.70 1.00
$
MP7 13.4 1.2 3.51 3.43 6.22
MP1 21.8 1.2 1.87 0.98 1.65
MP2 24.7 1.2 1.41 0.35 1.48
MP3 31.6 1.2 0.98 0.40 1.48
MP4 41.4 1.2 0.59 0.21 0.83
MP6 56.3 1.2 0.41 0.37 0.44
%
MP7 12.0 1.2 7.64 5.52 9.21
MP1 21.0 1.2 1.87 1.44 2.89
MP2 24.0 1.2 1.24 0.38 1.68
MP3 31.0 1.2 1.30 0.48 1.79
MP4 41.0 1.2 0.83 0.25 1.32
MP6 56.0 1.2 0.75 0.60 0.68
Figure3
Ground vibration measurement positions.
[ ]
[ ]
[ ]
K n
two parameters are the characteristic size ( $
%) which is the size of the screen through which 63.2% of the fragments pass and the uniformity index (N ) that determines the shape of the fragment size distribution curve (that is, the fragment size distribution characteristics).
Table 3 shows the analytical results of the fragment size of each type. The $
%was decreased as the "
"was increased, which indicated that the overall fragment size was small. The N is usually between 0.8-2.2 in case of rock blast, but it can be 0.65 depending on the burden
8),9). The N in this study was 1.33-1.63. Among the five concrete foundation samples, TYPE%showed a uniform fragment size distribution, while the fragment distribution was focused at a certain size in TYPE#. When the "
"was between 0.379 and 0.513, the !
!#was decreased and the distribution was focused at a certain size (increased N).
When the "
"was increased to the range between 0.513 and 0.599, the !
!#was decreased further but the fragment size distribution became broader from small ones to the large ones (decreased N ). This might have been because some of the blasted fragments were broken to the smaller size (Figure 6).
Figure 7 shows the relation between the "
"and the !
!#and the relation between the charge per delay ( !
") (equal to the total mass of charge (#
") in this experiment) and the
!
!#. The !
!#was decreased as the "
"and the !
"were increased. Hence, the trend was that the !
!#was decreased as the "
"was increased to blast the equal volume concrete.
The following Equation (4) shows the relation between the "
"and the !
!#.
Table3
The analytical result of the fragment size of each type.
Division TYPE
!TYPE
"TYPE
#TYPE
$TYPE
%Specific charge
("
%, kg m
−3) 0.379 0.505 0.513 0.667 0.599
Fragmented concrete image
Fragment size distribution curve
Characteristic size
($
%, m) 1.3368 0.9948 0.7404 0.55325 0.5764
Uniformity index
(N ) 1.35 1.57 1.63 1.42 1.33
Average fragment size
(!
!#, m) 1.062 0.908 0.720 0.505 0.564
Figure5
The relation between
Kand
""and between
nand
"".
Figure4The relationship between PPV and SRSD for each
type (50% linear regression curve).
3
8
9
[ ]
[ ]
D
Sc
Dc
[ ]
[ ]
[ ]D D D D V
[ ]
[ ]
V V V V V D
[ ]
[ ]
$
(#! ! (&' ! ! ! $$%! $ %
'+(4)
#
##! ! )"%
3.3 Relation between PPV and average fragment size In Equation (5), which is the prediction equation of ground vibration, charge per delay (W) is the charge ignited at one hole or multiple holes simultaneously. It can be expressed as the product of +
.and the entire fragment volume of blasted concrete (%
)) as in Equation (6). Thus, substitution of Equation (1), which is the relation between the $
.and the K , Equation (2), which is the relation between the $
.and n and Equation (4), which is the relation between the $
.and the !
-/into Equation (6) can express the relation between PPV and the !
-/.
**, #" !
&
&
! "
*(5)
**, #" !
$
(" %
)&
! "
*(6)
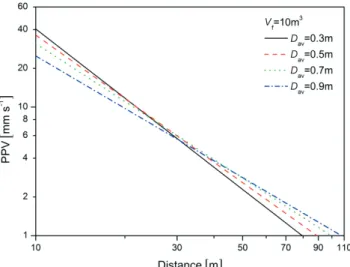
Figure 8 shows the relationship between PPV and distance depending on the !
-/of 0.3 m, 0.5 m, 0.7 m and 0.9 m in the case where the entire fragment volume of blasted concrete was 10 m
3. The PPV at the distance of 10 m was 40.48 mm s
-1when the !
-/was 0.3 m and 24.95 mm s
-1when
the fragment size was 0.9 m. The figure at the distance of 50 m was 2.29 mm s
-1and 2.83 mm s
-1, respectively, indicating that the PPV was greater when the !
-/was 0.9 m. This was because $
.and K were decreased but n was increased as the !
-/was increased when the entire fragment volume of blasted concrete was equal.
Figure 9 shows the relationship between PPV and the distance when the entire fragment volume of blasted concrete was 3 m
3, 5 m
3, 10 m
3, 50 m
3and 100 m
3with the
!
-/of 0.5 m. When the !
-/was constant, the n was also constant. However, the total mass of charge was increased and PPV was also increased as the entire fragment volume of blasted concrete was increased.
4. Conclusions
In this study, we derived the prediction equation of ground vibration by the linear regression analysis and analyzed the fragment size varying specific charge for the same scale of concrete foundation. We expressed the relationship between !
-/and PPV using the relation between $
.and K , the relation between $
.and n, the relation between $
.and !
-/.
Figure6
The relation between characteristic size and
$.and between uniformity index and
$..
Figure8
The relationship between PPV and the distance depending on the
!-/with the entire fragment volume of blasted concrete of 10 m
3.
Figure7
The relation between
$.and
!-/and between
!.and
!-/.
Figure9