九州大学学術情報リポジトリ
Kyushu University Institutional Repository
九州地域におけるマツノザイセンチュウの集団遺伝 学および系統分類学的研究
張, 涵泳
http://hdl.handle.net/2324/2236304
出版情報:Kyushu University, 2018, 博士(農学), 課程博士 バージョン:
権利関係:
Population genetic and systematic studies of pinewood nematode, Bursaphelenchus
xylophilus in Kyushu
Dissertation
Zhang Hanyong
2019
Contents
Chapter 1. General Introduction
1.1. Preface 1
1.2. Literature review 3
1.3. Objective of the present study 12
Chapter 2. Genetic diversity and genetic structure of pinewood nematode, Bursaphelenchus xylophilus populations in Kyushu
2.1. Introduction 18
2.2. Materials and methods 19
2.3. Results 21
2.4. Discussion 24
Tables 28
Figures 32
Chapter 3. High mitochondrial genome diversity and intricate population structure of pinewood nematode, Bursaphelenchus xylophilus in Kyushu
3.1. Introduction 34
3.2. Materials and methods 37
3.3. Results 40
3.4. Discussion 46
Tables 53
Figures 57
Chapter 4. General Discussion 60
Summary 65
Acknowledgement 70
References 72
Appendices 85
Chapter 1. General Introduction
1.1. Preface
Pine wilt disease (PWD) is one of the most serious threats to forests around the world. It originated in North America and spread to many other countries over the course of the 20th century. In the USA and Canada, PWD is not considered a primary pathogen of native pines, whereas in invasion areas, such as Japan, Korea, China, and Portugal, it exerts serious damage to forest ecosystems. It has now become a worldwide threat to forest ecosystems and international trade. PWD was first recorded in 1905 at Nagasaki Prefecture, in the northwestern part of the island of Kyushu in Japan (Yano, 1913), but the pinewood nematode (PWN), Bursaphelenchus xylophilus, was not identified as the causal agent of this disease until 1971. Since the pathogenicity of PWD was first identified by Kiyohara and Tokushige (1971), the disease has attracted more and more attention from researchers all over the world.
Thanks to the investigations into PWD carried out by scientists around the world, we have a better understanding of the disease, including transmission routes around the world, diagnostics of the nematode, associated insect vectors, interactions between the nematode and its host tree, pathogenicity and associated bacteria, and population genetic variation for the nematode and development of disease-resistant pines. However, the many mechanisms behind the disease’s symptoms remain unknown, and the spread of this terrible disease has not yet been prevented.
Understanding its mechanisms and pathways of transmission is believed to be effective in controlling the reproduction of PWNs, especially in uninfected areas. DNA analysis has
(ITS)-restriction fragment length polymorphism (RFLP) analysis, random amplified polymorphic DNA (RAPD)-PCR, and microsatellite markers (SSR).
All these DNA-based techniques provide an attractive solution for examining PWN populations, despite their limitations, as these DNA markers capture only mutations at specific sites on the sequence, resulting in a failure to comprehensively analyze variations.
Furthermore, most of the DNA markers are only associated with the nuclear genome, so population studies performed with these methods can be seen as one-sided analyses of the nucleus. However, genetic material is not only present in the nuclei of eukaryotes, but also in mitochondria and chloroplasts. Therefore, we sought to develop a method to utilize all mutations in the nucleotide sequence and conduct an exhaustive population analysis from the two cell organelles that contain genetic material in PWN, the cell nuclear genome and mitochondria genome.
The development of next generation sequencing technologies has made it possible to obtain a large amount of sequence information in order to capture sufficient variation.
Moreover, the entire nuclear genome sequence has already been determined for PWN by Kikuchi et al. (2011). In addition, numerous Expressed Sequence Tags (ESTs) have been registered in the DNA database based on gene expression analysis, making it possible to utilize Single Nucleotide Polymorphism (SNP) information in PWN. Furthermore, the whole mitochondrial genome sequence of PWN was reported by Sultana et al. (2013), thereby providing valid information for studying PWN populations’ variability based on mitochondrial genome sequencing and analysis of its polymorphisms. All those previous studies enabled us to put our ideas into practice. We believe that this research can supply a large amount of novel genomic information on PWD, as well as valuable recommendations for population analysis of the PWN.
1.2. Literature review 1.2.1. Studies on nematodes
The phylum Nematoda is considered by many to be one of the most abundant and potentially speciose invertebrate groups in the world (Blaxter et al., 1998; Giblin-Davis et al., 2004). However, because of the their mostly microscopic size, conserved gross morphology, vastly inadequate inventories, and poor or uneven descriptions, nematodes are not as recognized as they deserve to be (Ye et al., 2007). Nevertheless, many researchers are still working hard on these organisms. For example, a molecular evolutionary framework for the phylum Nematoda has been clarified (Blaxter et al., 1998). Underwood and Bianco (1999) identified a molecular marker for the Y chromosome of Brugia malayi. Moreover, a single nucleotide polymorphism map of mitochondrial genome of the parasitic nematode Cooperia oncophora has been reported (Van der Veer and de Vries, 2004). Some researchers have used molecular markers to analyze the phylogenetics of some genera of nematodes, including Pratylenchus (Al-Banna et al., 1997), Meloidogyne (De Ley et al., 2002), Heterorhabditidae and Steinernematidae (Liu et al., 1997), and Bactrocera species (Smith et al., 2003).
Among the nematodes studied, one of the most popular species is a kind of plant parasite called PWN, Bursaphelenchus xylophilus (Steiner and Buhrer, 1934), Nickle, 1970 (Nematoda: Aphelenchoididae), which causes cell destruction leading to death of the host tree within a few months (Cardoso et al., 2012). This species was identified as the agent of the worldwide forest blight called PWD (Kiyohara and Tokushige, 1971).
1.2.2. Studies on PWD
ecosystems (Yun et al., 2012). PWD was first recorded in 1905 in Japan, but PWN was not identified as the causal agent of the disease until 1971 (Shi et al., 2013). In Japan, PWD has plagued pine forests for over a century, accounting for the loss of 700 000 m3 of pine wood each year (Mamiya and Shoji, 2009). In China, ever since it was first found in 1982 in Sun Yat-sen’s Mausoleum in Nanjing, Chinese PWD has rapidly expanded and spread to 14 provinces, including Anhui, Chongqing, Fujian, Guangdong, Guangxi, Guizhou, Hubei, Hunan, Jiangsu, Jiangxi, Shandong, Sichuan, Yunnan, and Zhejiang (Yang, 1995; Zhang and Luo, 2003; Wu, 2004). By 2013, it had killed more than 1 million ha of pine forests with losses of more than one hundred billion denominated in Chinese currency (Shi et al., 2013). In South Korea, PWD was first identified in the Gumjung Mountain Region of Busan in 1988 (Yi et al., 1989), and has spread widely, reaching 57 cities and prefectures by 2010 (Jung et al., 2010a). Outside of Asia, in 1999, PWN was first reported in Portugal in Europe (Mota et al., 1999), where over the course of approximately ten years, nearly 510,000 ha of the pine forests were destroyed (Valadas et al., 2012). By 2008, new areas for the disease were established in other regions of Portugal (Rodrigues, 2008), and more recently, PWN has been detected on Maderia, 1,000 km southwest of continental Portugal (Fonseca et al., 2012).
Furthermore, it has also been detected in Spain (Abelleira et al., 2011; Robertson et al., 2011).
Across the whole world, 44 species in the genus Pinus (23 species occurring in Japan, 20 in the USA, two in Korea and nine in China) have been reported to be infected by PWN under natural conditions (Shi et al., 2013). Obviously, PWD has expanded almost all over the world, and so far, the PWN has been listed as a quarantine pest in more than 40 countries (Mota et al., 1999; Schrader and Unger, 2003).
1.2.3. Studies concerning Bursaphelenchus xylophilus
The studies about B. xylophilus were mainly focus on three areas as follows:
Studies on B. xylophilus
Although PWD is the most threatening to pine trees, there are also other factors which can cause pines to wilt, such as physiological disturbances, drought, forest fires, or competition between plant species (Yun et al., 2012). Therefore, it is important to confirm exactly whether the tree was infected with PWN or not. Also, a species closely related and morphologically similar to B. xylophilus within genus Bursaphelencus has been found in pines, which is called B. mucronatus and is thought to be nonpathogenic to pines (Mamiya and Enda, 1979). For these reasons, the identification and distinction of PWN have attracted a lot of researchers. For example, a direct PCR-based method for detecting B. xylophilus in wood tissue of Pinus massoniana has been reported (Hu et al., 2011). Direct molecular detection of the B. xylophilus from pine wood, bark and insect vector has also been developed (Cardoso et al., 2012). Moreover, one paper reported a simple, modified PCR-RFLP method using an egg, a second-stage juvenile, or an adult of living B. xylophilus to provide an unambiguous identification (Iwahori et al., 2000), and satellite DNA as a target for TaqMan real-time PCR detection of B. xylophilus has also been reported (François et al., 2007). A SCAR (Sequence Characterized Amplified Region) molecular marker to distinguish B.
mucronatus from B. xylophilus has also been developed (Chen et al., 2011). A multiplex one-step PCR method for the simultaneous identification of three species, B. xylophilus, B.
mucronatus and B. doui, within the xylophilus group was reported by the team of Zhuo et al.
(2011). In China, PWN has mainly been found in the south, as the climatic conditions are suitable there for the survival of PWN, but Shi et al. (2013) first reported the isolation of PWN from P. tabuliformis forests, which are mainly located in the north of China, indicating
transcription-PCR methods have been develop that target Hsp70 nucleotide sequences in order to differentiate between living and non-living B. xylophilus in wood (Leal et al., 2013).
As the basis for identification, the method used to obtain B. xylophilus specimens is also an important factor. A staining method was developed for estimating the nematode mass in a 5 mg cross-section from a wood sample of P. massoniana (Wang et al., 2010). Because field sampling and the traditional Baermann funnel method (Mamiya, 1975) take much time and labor to extract nematodes from dead pine tree chip samples, Yun et al. (2012) developed a rapid diagnostic for PWN infection by use of host-tree volatiles, which is thought attractive to PWN. Furthermore, in a newly infested tree or stand, the population of PWN is very low (Cheng et al., 2009), and so PWN is difficult to detect using traditional Baermann funnel extractions of wood discs cut from trees at breast-height (Yang et al., 2003). Thus, a method to investigate the within-tree distribution of PWN and a way to attract propagative PWN, which encompasses two thirds of the annual life history of the nematode (April through November), has been reported, and is thought to be an early diagnostic approach for PWD (Zhao et al., 2009).
Studies on pathogenicity of bacteria associated with B. xylophilus
The pathogenicity of PWN is also a frequently discussed problem. Han et al. (2003) reported that inoculating aseptic black pine seedlings with aseptic PWNs or bacteria alone did not lead to browning or wilting, but inoculation with aseptic PWNs combined with the bacteria isolated from B. xylophilus resulted in the onset of severe symptoms (Han et al., 2003). Zhao et al. (2003) discovered that inoculation with bacteria alone did not lead to the development of disease symptoms, but a combination of axenic PWNs and bacteria led to disease, while seedlings exhibited no or only weak symptoms when inoculated with axenic PWNs or axenic PWNs combined with the non-pathogenic bacterium (Zhao et al., 2003). To
clarify these problems, pathogenicity of aseptic B. xylophilus has been studied (Zhu et al., 2012). In addition, pathogenicity testing of four Bursaphelenchus species on conifer seedlings under greenhouse conditions has also been reported (Dayi and Akbulut, 2012).
Bacteria are also considered to be an important factor, for their association with pathogenicity. It is said that PWN has a specific bacterial symbiont that confers stronger virulence. To address this problem, the diversity of bacteria associated with B. xylophilus and other nematodes isolated from P. pinaster with PWD has been investigated (Proença et al., 2010). Specific and functional diversity of entophytic bacteria from PWN with different levels of virulence has also been investigated (Wu et al., 2013).
Studies on genetic variation
With more and more countries reporting PWN, it could be said that PWD has become a worldwide forest disease. As previous noted, PWN originated in North America, with the first report of PWD coming out of Japan in the 1970s (Mamiya, 1984), followed by China in 1982 (Cheng et al., 1983), soon after in Korea in 1988 (Yi et al., 1989), and more recently detected in Europe in 1999 (Mota et al., 1999). PWN has been regarded as an invasive species in Asia and Europe, but not North America (Kiyohara and Tokushige, 1971; Yang and Wang, 1988;
Chio et al., 2006). The questions of how PWN spread to Asia and Europe and subsequently expanded all over the northern hemisphere, and whether the PWN within these countries have any connection, are thus attractive targets for research. Indeed, many studies have been carried out to address these concerns. Cheng et al. (2008) studied the genetic variation in the invasive process of PWN in China and successfully inferred the possible spread routes in
monophyletic group which was the sister group to the clade composed of Canadian isolates and confirmed the hypothesis that B. xylophilus originated in North America (Knowles et al., 1983; Dwinell, 1993; Mota et al., 1999; Kanzaki and Futai, 2002). This agrees with the studies by Iwahori et al. (1998a), who found that the ITS-RFLP maps of Japanese, Chinese and US isolates were highly homologous, and Lu et al. (2001), who reported that the restriction enzyme map of ITS regions of B. xylophilus isolates from China and Japan were the same, but different from the Canadian. Even though a younger infection area, the population in Portugal has already been investigated by RAPD-PCR (Vieira et al., 2007); the same with the study in Madeira island (Fonseca et al., 2012) 1,000 km south west of continental Portugal, where PWN was detected ten years after first being reported in Portugal.
These two studies both revealed that the genetic variation of PWN populations in Portugal were low, a typical characteristic of invasive species. In its native area, the genetic diversity of PWN has also been studied by the use of polymorphic microsatellite loci (Mallez et al., 2013).
In addition to these large-scale comparisons, some smaller-scale population studies have also been carried out. Zhou et al. (2007) used SSR markers to study the genetic structure of populations of PWN between and within pine forests. Takemoto and Futai (2007) reported the polymorphism of Japanese isolates of PWN in 29 populations sub-cultured in the laboratory and others collected from natural pine stands at heat-shock protein 70 locus.
From these population genetic variation studies of PWN, it is obvious that the population of PWN which directly related to the dispersal of this species was highly complex. Study of the transmission routes and mechanisms of dispersal is regarded as important for planning effective control of the expansion of PWD and preventing its spread to uninfected regions (Jung et al., 2010b). The transmission of PWN in nature is mainly dependent on its vector beetles, Monochamus spp. (Insecta: Coleoptera: Cerambycidae). Depending on the geographic location, different species of Monochamus beetles act as the primary vectors for
PWN, M. alternatus is native to and the primary vector in Asia, whereas M. carolinensis is the primary vector in North America (Zhao et al., 2014). But for long distance transmission, because of the beetle’s limited flying capability, the transmission of PWN is almost always associated with the logs, lumber, and wood packaging material that are used in the transportation of commercial goods (Hu et al., 2013). As too many unrecognized factors involved in the spread of PWN, it is difficult to obtain detailed population information (Jung et al., 2010b). Molecular markers showing sufficient genetic polymorphism have been used in population analysis and it is thought they could be beneficial for understanding the epidemiology of PWD (Jung et al., 2010b). Hu et al. (2013) did research to investigate the factors that influence the genetic structure of M. alternatus in mainland China and to elucidate the relationship between the genetic structure of M. alternatus and both human activity and PWN dispersal in China using cox1 and cox2 gene sequence variation. Some DNA analyses of B. xylophilus have been reported. Iwahori et al. (1998b) compared the PCR-RFLP patterns among various isolates of B. xylophilus and B. mucronatus originating from Japan and other countries using twelve restriction enzymes. Aikawa et al. (2003) performed single pair reciprocal interbreeding between a virulent and an avirulent isolate of B. xylophilus and individually analyzed the PCR-RFLP pattern of the rDNA region containing the 5.8S gene, ITS1 and ITS2, and partial regions of 18S and 28S genes of the offspring, attempting to demonstrate the occurrence of population interbreeding between the two isolates. SSRs were another effective class of molecular marker for population genetic study, as these are distributed extensively in both coding and non-coding sequences of eukaryotic genomes (Tautz and Renz, 1984). Because SSRs are highly polymorphic, easy to detect (by PCR),
2003; Storz, 2002). For PWN, Zhou et al. (2007) reported that microsatellite markers may be useful for studying PWD. However, adequate loci are needed for the identification of individuals, and for multi-locus analysis, a method must be designed to ensure sufficient amounts of template, which is difficult to obtain from small organisms. To overcome this problem, Jung et al. (2010a) used the linker-attached fragment amplification method, which may be successful in genotyping multiple microsatellite loci (more than ten) from one individual and can be used to study microsatellite genetic variation of organisms otherwise too tiny to amplify multiple loci to study the variation of PWN in South Korea, and in the same year they also did the amplified fragment length polymorphism (AFLP) analysis of PWN in South Korea. Vieira et al. (2014) analyzed sequence variability of the MspI satellite DNA family of the PWN at different geographic scales. Assessment of the geographic origins of PWN via SNP in effector genes has also been investigated, as SNP markers, which come from sequence information and are highly reproducible, have become popular molecular markers. SNP genotyping is an accurate, scalable, cost effective process for the simultaneous detection of hundreds of polymorphisms (Figueiredo et al., 2013).
For non-model organisms, Expressed Sequence Tag (EST) analysis has proven a resourceful data set (Beldade and Vision, 2006; Bouck et al., 2007). EST analysis has been a powerful tool for identification of plant parasitic nematode genes which have roles in the host–parasite interaction. Moreover, SSRs mined from ESTs have been found to be significantly more transferable across taxonomic boundaries than traditional SSRs (Sim et al., 2009; Ellis and Burke, 2007) and the levels of polymorphism of transcribed EST-SSR regions appear to be similar to those of genomic-SSR regions (Tehrani et al., 2009). As EST-SSRs generally have fewer null alleles, greater cross-species amplification, and less allelic variability than genomic SSRs, EST-SSRs have been used widely in plant genetic studies (Aggarwal et al., 2007; Park et al., 2005; Wang et al., 2007) and population genetic studies
(Ellis and Burke, 2007; Slate et al., 2007; Wang et al., 2006; Kim et al., 2008). This showed that other molecular markers mining from EST should also be considered as powerful tools.
More than 120,000 ESTs have been sequenced from a variety of plant parasitic nematodes, and an EST project for PWN was performed by Kikuchi et al. (2007). From their investigation, 13,327 ESTs of PWN were generated. Clusters of B. xylophilus varied in size from a single EST (4,377 cases) to 251 ESTs (1 case). These data provided us a very favorable source for marker development from ESTs for future studies.
DNA-based techniques developed during the past decades provide an attractive solution to nematode identification. In spite of that, determination of intraspecific variability is still difficult (Valadas et al., 2013). Those markers introduced previously were all mined from the nucleus. Besides the nucleus, other cell organelles of metazoan containing genetic material can also be used, such as mitochondria. Due to their high copy number in individual cells, lack of recombination and strict maternal inheritance, the mitochondrial genome (mtDNA) is regarded as an excellent marker for the study of phylogenetic relationships (Valadas et al., 2013). In recent years, mitochondrial genes have been used as markers to study intraspecific variation (Madani et al., 2010) and the genetic relationships among Peruvian and Canadian populations of Globodera pallida in order to identify the origin of new populations (Picard et al., 2007; Plantard et al., 2008; Madani et al., 2010). For example, mtDNA cytochrome b (cytb) gene sequences allowed the determination of the origin of new G. pallida populations (Plantard et al., 2008), which makes this a possible marker to be tested in the study of B.
xylophilus intraspecific variability. Furthermore, Sultana et al. (2013) reported the whole mitochondrial genome sequence of PWN in 2013, providing us a good opportunity to develop
phylogenetic relationship. In the same year, they compared the complete mitochondrial genomes of B. xylophilus and B. mucronatus and developed a molecular tool to identify these two species (Sultana et al., 2013). Similarly, Pereira et al. (2013) did an intraspecific phylogeny of B. xylophilus and B. mucronatus using three mtDNA gene regions, cytochrome coxidase subunit I (cox1), NADH dehydrogenase subunit 5 (nad5) mitochondrial and small subunit ribosomal RNA (rrnS) from isolates of different geographic regions. Prior to these studies, Ye et al. (2007) reported the phylogenetic relationships among Bursaphelenchus species inferred from nuclear ribosomal and mitochondrial DNA sequence data. Following these studies, mtDNA could serve as another efficient tool for use in population genetic studies of PWN in the future.
1.3. Objective of the present study
Genetic variation information is the basic premise for discriminating between native populations (Humphreys et al., 2005). Information on genetic variation greatly facilitates germplasm classification and monitoring of genetic shifts in plant populations (Humphreys et al., 2005). Furthermore, estimates of genetic diversity are important because maintenance of genetic diversity is required for populations to evolve to adapt to environmental changes and because a decrease in genetic diversity is often related to inbreeding and reduction in reproductive fitness (Frankham et al., 2002). To prevent loss of genetic variability in natural populations through habitat destruction, areas with high genetic diversity are to be determined for both conservation and breeding programs (Tehrani et al., 2009). It has been reported that Kyushu is the first area of Japan infected with PWN, so it is reasonable to expect that the PWN in Kyushu area have relatively high genetic diversity. Therefore, the present study is aim to develop efficient molecular markers to investigate the genetic diversity of PWN in Kyushu area.
As noted in the introduction, there are various types of molecular markers that have been used to study PWN. Therefore, the main challenge for the present study lies in selecting one or more of these markers according to their specific purposes. A number of factors should be considered when choosing between the various molecular markers: (a) Marker system availability (b) Complexity of the technique and time investment (c) Estimated polymorphism levels within the study population (d) Quantity and quality of available DNA available (e) Transferability between laboratories, populations, pedigrees and species (f) The size and structure of the population to be studied (g) Availability of skilled workers and equipment (h) Cost per data-point and funding availability (i) Method of marker inheritance (e.g., dominant vs. codominant) and the type of genetic information needed in the population (Staub et al., 1996; Karp et al., 1997; Wolfe and Liston, 1998; Mackay, 2001; Rungis et al., 2005). In principle, the ideal type of genetic marker should be highly polymorphic, show codominant inheritance and be evenly distributed throughout the genome (Miah et al., 2013). In addition, particular marker sequences should be easy to access and analyses should be low cost, high-throughput, reproducible, and transferable between laboratories, populations and/or species (Miah et al., 2013). Unfortunately, no marker type currently exists that meets all of these requirements (Miah et al., 2013).
Of the molecular markers which have been introduced, RFLP analyses are not easily scalable to high-throughput methods, and RAPD assays are often not reproducible or transferable between laboratories. Although both microsatellites and AFLPs can be used to efficiently identify polymorphisms, microsatellite-based methods are more readily automated (Shariflou et al., 2001). In addition, AFLP analysis is not always straightforward, as
RAPD and RFLP markers is low; few of these markers can be applied to a single PWN individual due to its extremely small body size; and determination of intraspecific variability is difficult because sample sizes are too small (Valadas et al., 2013).
ESTs obtained by partial random sequencing of cDNA library are 300-500 nucleotide long single read mRNA sequences from many of the genes expressed in a sample from an organism and they represent a snapshot of gene expression in a specific organ or tissue at a specific developmental stage (Kalia et al., 2011). Genomic markers are derived from all regions of DNA, including both transcribed and non-transcribed regions, while EST markers are expected to be relatively more conserved as they are derived from transcribed regions of DNA (Scott et al., 2000). Saha et al. (2004) developed a set of EST-SSR markers and tested their transferability across seven grass species of four genera (Festuca, Lolium, Oryza L., Triticum L.) differing in mating system and ploidy level. This work revealed greater than 90%
transferability to one or more of the target species. The surveyed loci revealed large levels of polymorphism for elucidating relationships amongst these species. EST–SSRs offer advantages over genomic SSRs because they detect variation in the expressed portion of the genome, so that gene tagging should give “perfect” marker-trait associations and once developed, these markers, unlike genomic SSRs, may be used across a number of related species (Gupta et al., 1999). However, microsatellite markers are not perfect either; frequently a small number of potential microsatellite loci are identified, polymerase slippage occurs when analyzing mono- and di-nucleotide repeats, and co-migrating fragments are not always homologous (Rakoczy-Trojanowska and Bolibok, 2004).
SNP refers to a single base change in a DNA sequence, typically involving two possible alternative nucleotides at a given position (Vignal et al. 2002). A SNP occurs when a single nucleotide (A, T, C, or G) in the genome or other shared sequence differs between members of a species or between paired chromosomes in an individual (Semagn et al., 2014). SNPs
have largely replaced SSRs in crop species that have been extensively sequenced, such as maize, and they are expected to replace other types of molecular markers in most species in the near future given the increased use of next-generation sequencing technologies for genotyping (Semagn et al., 2014). Because of their low assay cost, high genomic abundance, locus specificity, co-dominant inheritance, simple documentation, potential for high-throughput analysis, and relatively low genotyping error rates (Rafalski, 2002;
Schlötterer, 2004), SNPs have emerged as powerful tools for many genetic applications, including germplasm characterization (genetic diversity, genetic relationship, and population structure), quality control (QC) analysis (genetic identity, genetic purity, and parentage verification), linkage mapping, linkage-based and linkage disequilibrium-based quantitative trait loci (QTL) mapping, allele mining, marker-assisted backcrossing (MABC), marker-assisted recurrent selection (MARS), and genomic selection (GS) (Semagn et al., 2014). For these reasons, SNP markers have received the most attention as third-generation molecular markers in recent years. (Vignal et al., 2002). Genome sequencing information is indispensable for the development of SNP markers, and entire genome sequences have already been determined for B. xylophilus (Kikuchi et al., 2011). Additionally, numerous ESTs registered in the DNA database from gene expression analyses have made it possible to utilize SNP information in B. xylophilus.
Furthermore, as noted above, beside nuclear molecular markers, the mitochondrial genome is also a good marker development source because of its high copy number in individual cells, lack of recombination, and strict maternal inheritance (Valadas et al., 2013).
In recent years, numerous studies have demonstrated that mitochondrial genes can make
genetic diversity of a population of PWN. In addition to reporting the complete mitochondrial genome of PWN, Sultana et al. (2013) also compared the entire mitochondrial genomes of B.
xylophilus and B. mucronatus Mamiya and Enda (1979) and developed a molecular tool to identify these two species. Similarly, Pereira et al. (2013) clarified the intraspecific phylogeny of B. xylophilus isolates from different world regions and of B. mucronatus isolates using three mitochondrial genes: cox1, nad5, and rrnS. A previous study also reported the phylogenetic relationships among Bursaphelenchus species inferred from mtDNA and nuclear ribosomal sequence data (Ye et al., 2007). All the above-mentioned studies suggest that mitochondrial genome information might be a new and efficient tool for examining population genetic variability in PWN. However, PWN mitochondrial genome diversity is not well understood, and the use of this information to evaluate PWN population diversity has not advanced to date.
As previously stated, we sought to develop a method to utilize all mutations in a nucleotide sequence, and perform an exhaustive population analysis from both the nuclear and mitochondrial genomes of PWN. The development of next generation sequencing technology makes it possible to obtain a large amount of sequence information to capture sufficient variations. Moreover, the entire nuclear genome sequence was already been determined for PWN by Kikuchi et al. (2011). Additionally, numerous ESTs have been registered in the DNA database from gene sequence expression analysis, making it possible to utilize SNP information in PWN. Furthermore, the whole mitochondrial genome sequence of PWN was reported by Sultana et al. (2013), thereby providing valid information for studying PWN populations’ variability based on mitochondrial genome sequencing and analysis of its polymorphisms. Our work builds on the tools provided by those earlier studies. Therefore, the object of the present study is to use SNP information derived from the nuclear and mitochondrial genomes of PWN to elucidate the genetic structure of the nematode population
and the phylogenetic relationships between the regional populations in Kyushu, the first invasion site in Asia.
Chapter 2. Genetic diversity and genetic structure of pinewood nematode, Bursaphelenchus xylophilus populations in Kyushu
2.1. Introduction
Bursaphelenchus xylophilus ((Steiner et Buhrer) Nickle) is a plant parasitic nematode which is highly pathogenic and has afflicted a large number of trees with Pine wood disease (hereinafter referred to as "PWD") since 1971 (Kiyohara and Tokushige, 1971). Because of its rapid spread, it has caused tremendous damage to pine forests around the world (Suzuki 2002). In these affected countries, various control and quarantine systems have been implemented, but PWD has not stopped spreading (Hu et al., 2011).
Now, thanks to active international trade and economic exchanges, the risk of spreading PWD is increasing every day. Understanding the pathways and mechanisms of transmission is considered essential to control PWD expansion and prevent it reaching uninfected areas (Jung et al., 2010b). Various factors have been involved in the transmission of B. xylophilus, including its vector beetles, Monochamus spp. (Insecta: Coleoptera: Cerambycidae), at close range, while human activity accounts for most long-range dispersal (Jones et al. 2008). It seems that the nematode worm population is forming a complicated genetic structure. In order to explain this conundrum, it is necessary to conduct population genetic study of B.
xylophilus.
DNA molecular markers are important tools for population genetic analysis (Sunnucks, 2000). In recent years, several molecular markers for genetic analysis of B. xylophilus have been developed. PCR-RFLP markers (Iwahori et al. 1998b; Takemoto and Futai 2007), RAPDs marker (Zhang et al. 2008) and SSR markers (Mallez et al. 2013; Jung et al. 2010a) have been developed and used for genetic studies of B. xylophilus. In addition, haplotype analysis using SNPs in the ITS region of rDNA has also been performed (Nose et al., 2009).
These DNA molecular markers are also used for population genetic studies of B. xylophilus in Japan. Zhou et al. (2007) used the SSR markers to elucidate genetic diversity in the Kanto region. In addition, Nose et al. (2009) conducted phylogenetic analysis of regional populations in the Kyushu region.
SNPs are widely distributed in the genome of the organism, which is rich in mutation sites. Markers that can take advantage of this function facilitate simple and accurate genotyping. For these reasons, SNP markers have received the most attention as third-generation molecular markers in recent years (Vignal et al. 2002). Genome sequencing information is indispensable for the development of SNP markers, and the entire genome sequences have already been determined for B. xylophilus (Kikuchi et al., 2011). Additionally, numerous Expressed Sequence Tags (ESTs) have been registered in the DNA database from gene sequence expression analyses, making it possible to utilize SNP information in B.
xylophilus.
Due to the distribution of invasive organisms in Asia and Europe, it was predicted that genetic diversity of the B. xylophilus would gradually decrease over the invasion process, as is characteristic of invading organisms (Tsutsui et al., 2000; Sakai et al., 2001). In addition, as economic activities are also frequently involved in the expansion and distribution of B.
xylophilus, it is predicted to form a different genetic structure than would be formed under a more natural expansion scenario. Therefore, this research attempted to take advantage of the nucleotide sequence polymorphism of EST loci reflecting a plurality of SNP information to evaluate the genetic diversity and to elucidate the genetic structure of B. xylophilus in the Kyushu area, which is the first invasion site in Asia.
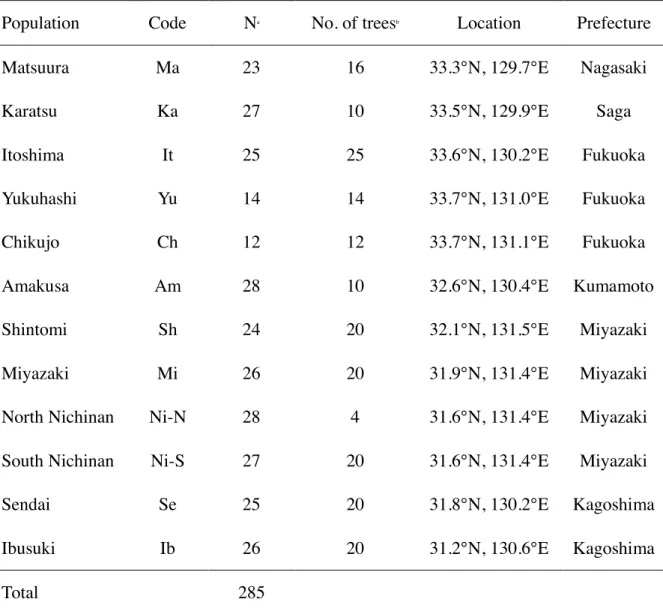
Matsuura (Nagasaki prefecture), Amakusa (Kumamoto prefecture), Shintomi, Miyazaki and Nichinan (Miyazaki prefecture), Ibusuki and Sendai (Kagoshima prefecture) have been collected in 2012-2014. The B. xylophilus population isolated from one damaged tree was regarded as one isolate (hereinafter referred to as a damaged tree group). The number of damaged tree populations in each regional population is shown in Table 2-1. In total, 107 damage tree populations of 8 regional populations have been collected. The B. xylophilus collection was performed from one place (about 20 cm × 20 cm) in the breast height part of the dead tree. After the bark was taken out from the height of the chest (about 20 cm × 20 cm), the sawdust was collected from 5 points of the damaged tree with a 16 mm diameter electric drill, and then thoroughly mixed and extracted. B. xylophilus was extracted by Baermann funnel technique (Iwahori and Futai, 1993), and then cultured on Botrytis cinerea Pars., grown on barley culture medium and incubated at 25 °C for 10~20 days. Regarding the preparation of the barley medium, distilled water of the same amount (W / W) as that of barley was placed in a tube and sterilized in an autoclave (121 °C for 20 min). The successfully cultured B. xylophilus were separated from the culture medium, then suspended in distilled water and stored at 4 °C until use. DNA isolation and purification were carried out according to Nose et al. (2009). A PCR template DNA was obtained from a population isolated from a damaged tree.
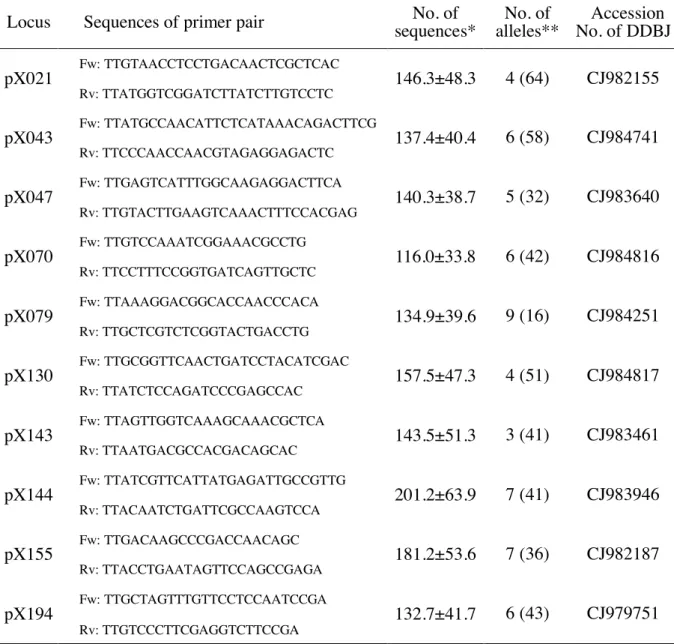
Nucleotide sequences information of the B. xylophilus EST (Kikuchi et al., 2007) obtained from DDBJ database (https://www.ddbj.nig.ac.jp/index.html)was used to design primer pairs for PCR. Multiplex PCR was performed using primer pairs of the EST loci shown in Table 2-2. The multiplex PCR were performed with Takara Multiplex Ver 2.0 in a final volume of 25 μl containing 50 μl of genomic DNA, 5 μl of primer mix (1 μM), 12.5 μl of 2× Multiplex PCR Buffer (Mg2 +, dNTP plus), and Multiplex PCR Enzyme Mix 0.125 μl.
PCR was performed using Agilent SureCycler 8800 (Agilent Technologies) at 94 °C for 1
min, followed by 30 cycles of 94 °C for 30 s, 55 °C for 30 s, and 72 °C for 30 s, finally extended at 72 °C for 10 min. The PCR product was electrophoresed on 1.2% agarose gel, a DNA fragment of 100 to 300 bp was excised and purified using MagExtractor-PCR & Gel clean up (TOYOBO) to prepare a library. All libraries were mixed in equal amounts, and used for analysis in the next generation sequencer (Illumina MiSeq System (Illumina)). The analytical sample used for the next-generation sequencer was prepared using TruSeq Nano DNA Library Prep Kit (Illumina). Sequencing was performed according to the operation manual of Illumina.
The nucleotide sequence data (only Q20 or more) obtained from the sequencing was first classified for each library and further classified according to the EST loci. Allele frequencies for each library (isolate) and EST locus were determined, and the genetic diversity (HT, HS), gene differentiation coefficient (GST) (Nei, 1987) and genetic distance (Nei, 1972) were calculated from the allele frequencies.
2.3. Results
With primer pairs designed using the nucleotide sequences information of reported B.
xylophilus(Kikuchi et al., 2007)and sequences obtained from a next-generation sequencer, ten EST loci acquired sufficient information (more than 50 reads per locus· population) and are shown in Table 2-2. Table 2-2 also shows the number of sequences and the number of alleles per locus of the damaged tree population (the number of alleles with a frequency of 1%
or higher and the total number of alleles). The heterozygosity of each subpopulation in ten polymorphic loci is shown in Appendix (Table S2-1), and detailed information of the allele
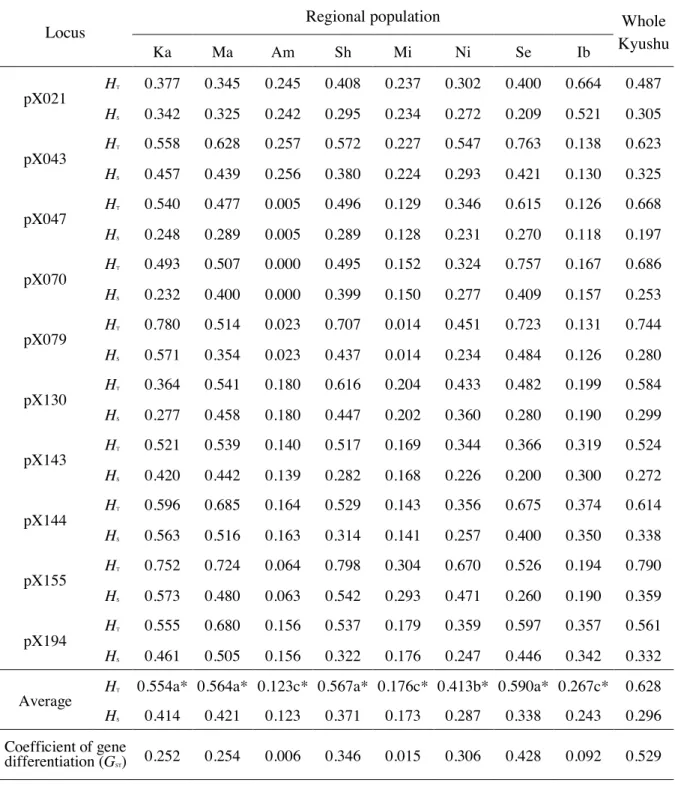
population were 116.0 ± 33.8 (pX070) ~ 201.2 ± 63.9 (pX144). In addition, as shown in Table 2-3 (HT), the genetic diversity of each locus in the entire Kyushu region ranged from 0.487 (pX021) to 0.790 (pX155) with an average of 0.628.
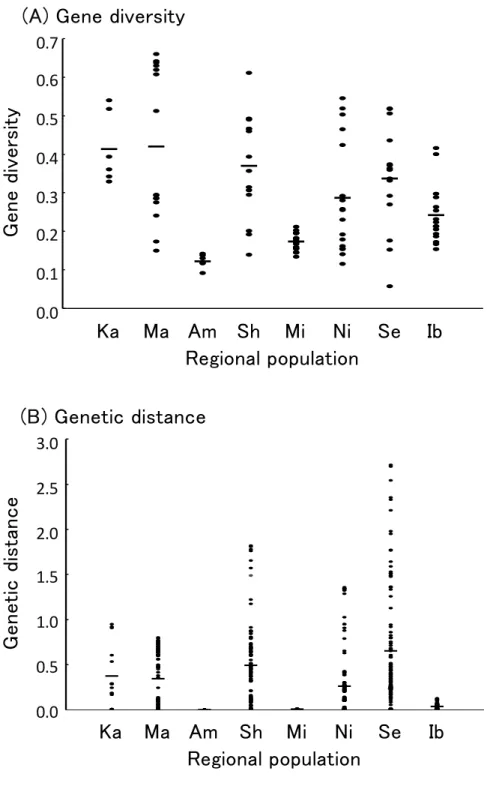
Genetic diversity in eight regional populations of Kyushu (Table 2-1) was evaluated by Nei (1987) using the data set of ten polymorphic loci (Fig. 2-1 (A)). The expected heterozygosity value (HS in Table 2-3) of each tested damage tree within each regional population of B. xylophilus was taken as representative of the genetic diversity of the population. The genetic diversity of the regional population ranged from 0.123 (Amakusa) to 0.421 (Matsuura), and the average value was 0.296. The highest genetic diversity was 0.421 ± 0.196 in Matsuura, then 0.414 ± 0.092 in Karatsu. Shintomi (0.371 ± 0.136) and Sendai (0.338 ± 0.135) also showed relatively high diversity. On the other hand, the lowest genetic diversity values were obtained for Amakusa (0.123 ± 0.018) and Miyazaki (0.173 ± 0.022). A bottleneck test was performed for these two populations using Tajima’s D. The results showed that seven out of the eight effective loci in Amakusa had a significant negative bias (six loci were at the 0.1% level and one locus was at the 5% level), while eight out of the ten effective loci in Miyazaki showed significant negative bias (all of the loci were at the 0.1% level).
These negative biases were observed in the population-processed bottleneck. The total heterozygosity (HT in Table 2-3) of the regional population, which was calculated from the average allele frequency of the damaged tree population, ranged from 0.123 (Amakusa) to 0.590 (Sendai).
The highest polymorphism in the population of damaged trees was observed in Matsuura, with a frequency of 0.660. In this regional population, six out of 16 trees exceeded 0.6, which was confirmed to contain a large number of B. xylophilus population that has a high diversity. In addition, one damaged tree population exceeding 0.6 was also identified in Shintomi. On the other hand, the diversity of each damaged tree population of Amakusa was
0.091 to 0.142, and all six of the tested tree populations showed extremely low values. The diversity of Miyazaki ranged from 0.134 to 0.212, and was low in all 18 tree populations.
Values of six tree populations in Karatsu were 0.330 to 0.541, and all of the populations showed similar diversity. In order to evaluate the difference in genetic composition between damaged tree populations in each regional population, the genetic distances (Nei, 1972) of all pairs of the damaged tree populations were calculated and the average value was used as a measure of the genetic difference of the population (Fig. 2-1 (B)). The highest was confirmed in Sendai (0.647 ± 0.660), followed by Shintomi (0.0.488 ± 0.458). On the other hand, the average genetic distance between Amakusa (0.001 ± 0.000) and Miyazaki (0.003 ± 0.002) was extremely small, indicating that there was no difference in the genetic composition of the damaged tree populations. Fig. 2-2 shows the relationship between average gene diversity and mean genetic distance. Naturally, in regional populations with extremely low genetic diversity (Amakusa, Miyazaki, Ibusuki), the average genetic distance was also extremely small (a significant positive correlation among eight populations (r2= 0.781*)). However, in regional populations with relatively high genetic diversity (Matsuura, Karatsu, Shintomi, Sendai), a tendency for genetic differences between damaged tree populations to increase as genetic diversity of regional populations increases was not confirmed (a significant negative correlation among 4 populations (r2= -0.991*)).
In order to evaluate the genetic structure in individual regional populations, the gene differentiation coefficient (GST: Nei, 1987) was calculated from the total gene diversity (HT) and the average value (HS) of genetic diversity of the damaged tree population (Table 2-3).
The G for Sendai was the largest at 0.428, followed by 0.346 for Shintomi. On the other
2.4. Discussion
In this study, all sequence variations in EST loci obtained by the next generation sequencer were captured and alleles were detected from the polymorphism. As a result, ten loci were developed for B. xylophilus with high variability (average 0.628 (0.487 - 0.790), Table 2-3). Compared to the DNA markers, such as SNPs and SSRs, that have been frequently used in many studies which only captured mutations at specific sites on the nucleotide sequences (Tautz and Renz 1984; Brookes, 1999), the method in the present study made it possible to utilize all of the mutations on the nucleotide sequences. It is considered to be an effective method when only the allele frequency of the investigated individual is obtained in this study. Since abundant EST nucleotide sequence information has already been reported (Kikuchi et al., 2007), it is not difficult to increase the number of loci. It is hoped that this innovation will lead to more detailed findings in future population genetic study of B.
xylophilus.
Genetic diversity was used to assess the genetic diversity of regional populations (Nei, 1987). As a result, it was observed that the regional population differed greatly (0.123-0.590) (HT in Table 2-3). Four populations were divided into three groups according to genetic diversity (Karatsu (0.554), Matsuura (0.564), Shintomi (0.567), Sendai (0.590)) with high diversity. Nichinan (0.413) with moderate diversity, and three populations ((Amakusa: 0.123, Miyazaki: 0.176, Ibusuki: 0.267) with low diversity. A significant difference at the 1% level among these three groups was revealed through the Kruskal-Wallis test (Kruskal and Wallis, 1952). Zhou et al. (2007) evaluated the genetic diversity of three populations of Kanto (Tanashi, Tsukuba, Chiba) using four SSR markers. They reported two populations (Tsukuba, Chiba) rich in diversity and one population of Tanashi with extremely poor diversity in the results. It can be seen from these facts that populations of high diversity and populations of extremely low diversity exist quite normally in the regional population of B. xylophilus.
Based on the genetic differentiation coefficient (GST), the genetic structure of the entire Kyushu population was analyzed. It was found that more than half (GST = 0.529) of the total genetic diversity (HT = 0.628) was present in the regional population, and there were mutations between the regional populations. This confirmed that there is a large genetic difference between the regional populations. Kishi (1988) reported the propagation path of B.
xylophilus of Kyushu based on past damage records. According to the report, there are four routes invaded from four places as Nagasaki, Sasebo, Nichinan and Aira, which is supported by polymorphism analysis of rDNA by Nose et al. (2009). The high GST value revealed that recent studies have shown that systematically different B. xylophilus populations from North America have invaded Kyushu and their influence is still strong.
In the highly diverse regional populations (Karatsu, Matsuura, Shintomi, Sendai), there is also a large difference between the damaged tree populations (Fig. 2-1 (A)). Furthermore, the genetic distances among the damaged tree populations (Karatsu: 0.370, Matsuura: 0.340, Shinnito: 0.488, Sendai: 0.647) are large (Table 2-4, Fig. 2-1 (B)). Obviously, the genetic composition of damaged tree species is very different. Among the four regional populations that maintain high diversity, 25 to 43% of all genetic mutations were present among damaged tree populations (Table 2-3), and the genetic distances among damaged tree populations were also large (Table 2-4). The investigation in Kanto by Zhou et al. (2007) also revealed that within the population of Tsukuba and Chiba with high diversity, the genetic distance was also large. Judging by the beetles which are vectors for B. xylophilus, the genetic composition of B. xylophilus in the tree that holding the beetle before emergence was strongly reflected by the genetic composition of the B. xylophilus in the next injured tree. Therefore, it is
difference in postprandial behavior (Zhou et al., 2007) also have a complex but important relationship; thus it is understandable that large genetic composition differences have developed among the damaged tree populations.
On the other hand, in Amakusa, Miyazaki and Ibusuki with low diversity, GST was extremely small (0.006, 0.015, 0.092, respectively) and genetic variation in almost all regional populations exists in individual damaged tree populations. In addition, the genetic distance between damaged tree populations was also small (Amakusa: 0.001, Miyazaki: 0.003, Ibusuki: 0.034) (Table 2-4, Fig. 2-1 (B)), and the genetic composition of the damaged tree populations was also similar in these three populations. In the area destroyed by PWD in the past, the number of B. xylophilus drastically decreased due to the decline of the pine forest. It seems that the small surviving population (Bottleneck effect; Bonnell and Selander, 1974) would proliferate again with the regeneration of the pine forest. On the other hand, we believe that in the artificial expansion, the genetic diversity of newly introduced B. xylophilus populations in pine forest was originally low (Founder effect; Mayr, 1954). Even in the areas damaged by PWD, it is believed that the founder effect would occur when B. xylophilus was newly transmitted naturally to nearby pine forests by a very small number of vectors. Zhou et al. (2007) reported the existence of a population with extremely low diversity (Tanashi) among the three regional populations of the investigated Kanto, and they inferred that it was influenced by the founder effect and genetic drift according to the progress of fragmentation of the pine forest by urbanization. As a result of examining the presence or absence of a significant bottleneck has been observed using Tajima 'D (Tajima, 1989) for two populations (Amakusa, Miyazaki) in which the diversity was low in this study. Since both the Kanto and Kyushu revealed a very low-diversity population, the impact of the bottleneck/founder effect seems to have played a significant role in the formation of regional populations in Japan. The Amakusa sampling site in Amakusa, which showed the least diversity this time is the same
area as Amakusa Kamishima (Amakusa) in the study of Nose et al. (2009) where sampling was done from 2006 to 2007. At that time, four of the seven rDNA haplotypes mainly present in Kyushu were detected and were diverse populations of Kyushu. In this regard, it has suffered serious damage from PWD since 2009. It is presumed that the population size of B.
xylophilus drastically decreased due to the large-scale annihilation of pine forest, but the bottlenecked population has nonetheless survived.
It is clear that in Kyushu, B. xylophilus populations with rich genetic diversity and B.
xylophilus populations lacking genetic diversity were both exciting. As with the Amakusa phenomenon mentioned above, even in those who have maintained diversity in the past, there may be a decline in the diversity of some populations. In particular, Kyushu was the first region in which B. xylophilus was found to be invasive. It has already been a century since 1905, when then species invaded Nagasaki (Yano, 1913). The period over which the pine forests have been exposed to the depredations of PWD is longer in Kyushu than in other areas. It can be argued that the history of damage caused by repeated PWD over the years has revealed the polarization of diversity possessed by a regional population of B. xylophilus.
To date, little quantitative evaluation of the genetic diversity and genetic structure of B.
xylophilus populations has been performed. In this study, the genetic population analysis method was used to quantify the genetic diversity harbored at each level: the entirety of Kyushu, regional populations, and damaged tree populations. Large differences in genetic characteristics among regional populations of B. xylophilus were also revealed by the population structure analysis. Nowadays, PWD has spread throughout Japan, excepting Hokkaido. In order to elucidate the genetic diversity and structure of the population in the
Tables
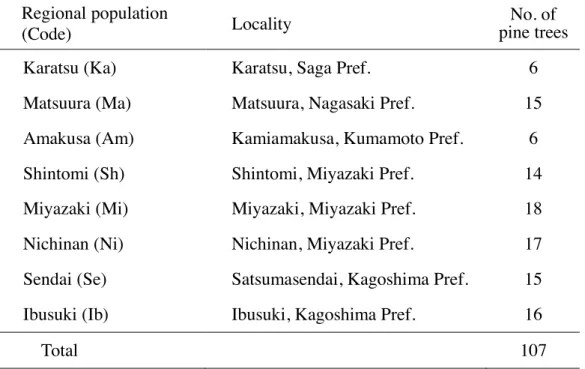
Table 2-1. The sampling sites of pinewood nematode and the number of damaged pine trees used in this study
Regional population
(Code) Locality No. of
pine trees
Karatsu (Ka) Karatsu, Saga Pref. 6
Matsuura (Ma) Matsuura, Nagasaki Pref. 15
Amakusa (Am) Kamiamakusa, Kumamoto Pref. 6
Shintomi (Sh) Shintomi, Miyazaki Pref. 14
Miyazaki (Mi) Miyazaki, Miyazaki Pref. 18
Nichinan (Ni) Nichinan, Miyazaki Pref. 17
Sendai (Se) Satsumasendai, Kagoshima Pref. 15
Ibusuki (Ib) Ibusuki, Kagoshima Pref. 16
Total 107
Table 2-2. The PCR primer sequences of the ten putative loci, the numbers of the effective sequences, and the detected alleles in pinewood nematode
Locus Sequences of primer pair No. of
sequences* No. of
alleles** Accession No. of DDBJ pX021 Fw: TTGTAACCTCCTGACAACTCGCTCAC
146.3±48.3 4 (64) CJ982155
Rv: TTATGGTCGGATCTTATCTTGTCCTC
pX043 Fw: TTATGCCAACATTCTCATAAACAGACTTCG
137.4±40.4 6 (58) CJ984741
Rv: TTCCCAACCAACGTAGAGGAGACTC
pX047 Fw: TTGAGTCATTTGGCAAGAGGACTTCA
140.3±38.7 5 (32) CJ983640
Rv: TTGTACTTGAAGTCAAACTTTCCACGAG
pX070 Fw: TTGTCCAAATCGGAAACGCCTG
116.0±33.8 6 (42) CJ984816
Rv: TTCCTTTCCGGTGATCAGTTGCTC
pX079 Fw: TTAAAGGACGGCACCAACCCACA
134.9±39.6 9 (16) CJ984251
Rv: TTGCTCGTCTCGGTACTGACCTG
pX130 Fw: TTGCGGTTCAACTGATCCTACATCGAC
157.5±47.3 4 (51) CJ984817
Rv: TTATCTCCAGATCCCGAGCCAC
pX143 Fw: TTAGTTGGTCAAAGCAAACGCTCA
143.5±51.3 3 (41) CJ983461
Rv: TTAATGACGCCACGACAGCAC
pX144 Fw: TTATCGTTCATTATGAGATTGCCGTTG
201.2±63.9 7 (41) CJ983946
Rv: TTACAATCTGATTCGCCAAGTCCA
pX155 Fw: TTGACAAGCCCGACCAACAGC
181.2±53.6 7 (36) CJ982187
Rv: TTACCTGAATAGTTCCAGCCGAGA
pX194 Fw: TTGCTAGTTTGTTCCTCCAATCCGA
132.7±41.7 6 (43) CJ979751
Rv: TTGTCCCTTCGAGGTCTTCCGA
* Values indicate the average number and the standard deviation of effective sequences per subpopulation.
** Value indicates the number of alleles with a frequency of 1% or more, while the value in the parentheses indicates the number of all alleles.
Table 2-3. Genetic diversity (HT, HS) and genetic population structure (GST) of pinewood nematode estimated from ten putative loci
Locus Regional population Whole
Kyushu
Ka Ma Am Sh Mi Ni Se Ib
pX021 HT 0.377 0.345 0.245 0.408 0.237 0.302 0.400 0.664 0.487 HS 0.342 0.325 0.242 0.295 0.234 0.272 0.209 0.521 0.305
pX043 HT 0.558 0.628 0.257 0.572 0.227 0.547 0.763 0.138 0.623 HS 0.457 0.439 0.256 0.380 0.224 0.293 0.421 0.130 0.325
pX047 HT 0.540 0.477 0.005 0.496 0.129 0.346 0.615 0.126 0.668 HS 0.248 0.289 0.005 0.289 0.128 0.231 0.270 0.118 0.197
pX070 HT 0.493 0.507 0.000 0.495 0.152 0.324 0.757 0.167 0.686 HS 0.232 0.400 0.000 0.399 0.150 0.277 0.409 0.157 0.253
pX079 HT 0.780 0.514 0.023 0.707 0.014 0.451 0.723 0.131 0.744 HS 0.571 0.354 0.023 0.437 0.014 0.234 0.484 0.126 0.280
pX130 HT 0.364 0.541 0.180 0.616 0.204 0.433 0.482 0.199 0.584 HS 0.277 0.458 0.180 0.447 0.202 0.360 0.280 0.190 0.299
pX143 HT 0.521 0.539 0.140 0.517 0.169 0.344 0.366 0.319 0.524 HS 0.420 0.442 0.139 0.282 0.168 0.226 0.200 0.300 0.272
pX144 HT 0.596 0.685 0.164 0.529 0.143 0.356 0.675 0.374 0.614 HS 0.563 0.516 0.163 0.314 0.141 0.257 0.400 0.350 0.338
pX155 HT 0.752 0.724 0.064 0.798 0.304 0.670 0.526 0.194 0.790 HS 0.573 0.480 0.063 0.542 0.293 0.471 0.260 0.190 0.359
pX194 HT 0.555 0.680 0.156 0.537 0.179 0.359 0.597 0.357 0.561 HS 0.461 0.505 0.156 0.322 0.176 0.247 0.446 0.342 0.332
Average HT 0.554a* 0.564a* 0.123c* 0.567a* 0.176c* 0.413b* 0.590a* 0.267c* 0.628 HS 0.414 0.421 0.123 0.371 0.173 0.287 0.338 0.243 0.296 Coefficient of gene
differentiation (GST) 0.252 0.254 0.006 0.346 0.015 0.306 0.428 0.092 0.529
HT: total gene diversity of population; HS: average gene diversity wthin population
* a, b, and c indicate significant differences of three groups at p <0.01 by Kruskal-Wallis test.
Table 2-4. Average pairwise genetic distances (Ds) between and within eight regional populations of pinewood nematode
Population Ka Ma Am Sh Mi Ni Se Ib
Ka 0.370
± 0.321
Ma 0.386
± 0.277 0.340
± 0.299
Am 0.664
± 0.242 0.608
± 0.254 0.001
± 0.000
Sh 0.418
± 0.222 0.478
± 0.297 0.689
± 0.261 0.488
± 0.456
Mi 0.375
± 0.221 0.528
± 0.342 0.563
± 0.014 0.413
± 0.457 0.003
± 0.002
Ni 0.362
± 0.218 0.485
± 0.319 0.613
± 0.186 0.404
± 0.442 0.227
± 0.285 0.262
± 0.334
Se 1.024
± 0.511 1.153
± 0.657 1.083
± 0.373 1.058
± 0.610 1.540
± 0.821 1.242
± 0.730 0.647
± 0.661
Ib 1.214
± 0.371 1.269
± 0.920 1.686
± 0.249 1.380
± 0.868 2.581
± 0.534 1.913
± 0.777 0.947
± 0.588 0.034
± 0.029 Values indicate the average and the standard deviation of the pairwise genetic distances.
Diagonal element indicates the distance within a population, and element below the diagonal indicates the distance between populations.
Figures
Fig. 2-1. The gene diversity of the populations within damaged trees (subpopulation) ((A) Gene diversity) and the pairwise genetic distances among the subpopulations ((B) Genetic distance) in eight regional populations of pinewood nematode
“-” indicates the average gene diversity (A) or the average pairwise genetic distance (B) in each regional population.
0 1 2 3 4 5 6 7 8 9
0.7 0.6 0.5 0.4 0.3 0.2 0.1 0.0
0 1 2 3 4 5 6 7 8 9
3.0 2.5 2.0 1.5 1.0 0.5 0.0
Fig. 2-2. Relationship between the average gene diversity and the average pairwise genetic distance among subpopulations in eight regional populations of pinewood nematode
0.5 0.4
0.3 0.2
0.1 0.0
0.5 0.4 0.3 0.2 0.1 0.0 0.6 0.7
Chapter 3. High mitochondrial genome diversity and intricate population structure of pinewood nematode, Bursaphelenchus xylophilus in Kyushu
3.1. Introduction
Pine wilt disease (PWD), one of the most serious forest problems worldwide, originated in North American countries (Dwinell, 1997) spreading to many others during the 20th century. In USA and Canada, PWD is not considered a primary pathogen of native pines (Leal et al., 2013), whereas in invasion areas, such as Japan, Korea, China, and Portugal, it exerts serious damage to forest ecosystems (Yun et al., 2012).
In Japan, PWD was first recorded at Nagasaki prefecture, northwestern part of Kyushu, in 1905. During the last century, this disease has been responsible for the yearly loss of 700,000 m3 of pinewood (Mamiya and Shoji, 2009). In China, PWD was first observed in Nanjing in 1982, but it rapidly expanded (Yang, 1995; Zhang and Luo, 2003; Wu, 2004) and over one million hectares of pine forests have died due to PWD (Zhao, 2008). In South Korea, PWD was first identified in the Gumjung Mountain Region of Busan in 1988 (Yi et al., 1989), but it widely spread to 57 cities and prefectures until 2010 (Jung et al., 2010a). In Europe, PWD was first reported in Portugal in 1999 (Mota et al., 1999). During the next decade, nearly 510,000 ha of Portuguese pine forests were destroyed due to PWD (Valadas et al., 2012). By 2008, the disease spread across the country (Rodrigues, 2008) and, more recently, the PWD was detected in Madeira Island, 1,000 km southwest of mainland Portugal (Fonseca et al., 2012). PWD has been detected also in Spain (Abelleira et al., 2011; Robertson et al., 2011), and, throughout the world, 44 Pinus species have been infected by PWD under natural conditions (Shi et al., 2013).
The pinewood nematode (PWN), Bursaphelenchus xylophilus (Steiner and Buhrer, 1934), Nickle, 1970 (Nematoda: Aphelenchoididae), which is a kind of plant parasite, is the