Introduction
Nonalcoholic fatty liver disease (NAFLD) is considered one of the phenotypes of metabolic syndrome, or an addi- tional feature of metabolic syndrome.
1,2Visceral fat accu- mulation has been reported to be a more important risk fac- tor for the development of metabolic syndrome than subcutaneous fat,
3and therefore, hepatic fat infiltration in NAFLD is correlated with visceral fat accumulation.
2,4,5In fact, Koda et al. reported that abdominal subcutaneous fat thickness was not different among hepatic steatosis scores, as evaluated semi-quantitatively by ultrasonography, and
visceral fat was the most important factor for the develop- ment of hepatic steatosis.
6However, Koda et al. also dem- onstrated that the change in abdominal subcutaneous fat thickness was weakly correlated with changes in hepatic fat deposits.
6Furthermore, Choudhary et al. reported that sub- cutaneous adipose tissue (SAT) volume defined as fat super- ficial to the abdominal and back muscles was correlated with hepatic steatosis and severity of liver disease, whereas vis- ceral adipose tissue (VAT) volume was not correlated with severity of liver disease in Indian patients with NAFLD.
7Thus, abdominal SAT may be an important adipose tissue compartment that should not be overlooked.
MS#AMN 07155
Abdominal subcutaneous adipose tissue accumulation is positively correlated with hepatic steatosis in Sprague-Dawley rats
Katsuhisa O
magari1,2, Chisato Y
oshikawa1, Shin-ichi I
noue1, Yuna T
anaka1, Toshie M
urayama1, Mayuko I
chimura2, Ayako M
iyata1, Sawako M
ori1, Mai K
amogawa1, Eri H
irao1, Shigeko K
ato1,2, Kazuhito S
uruga1,2, Koichi T
suneyama31 Department of Nutrition, Faculty of Nursing and Nutrition, University of Nagasaki, Nagasaki, Japan
2 Division of Nutritional Sciences, Graduate School of Human Health Sciences, University of Nagasaki, Nagasaki, Japan
3 Department of Diagnostic Pathology, University of Toyama, Toyama, Japan
The precise roles of visceral (VAT) or subcutaneous adipose tissue (SAT) on hepatic fat accumulation have not been fully elucidated. In this report, we examined the correlation between VAT or SAT volume and severity of hepatic fat accumulation. In the present study, Sprague-Dawley (SD) rats were fed a standard diet containing 10% fat or a high-fat diet containing 45% or 60%
fat for 16 weeks. Abdominal VAT and SAT volume, as well as fat percentage of the liver were measured by computed tomography (CT). Hepatic triglyceride (TG) content and histopathological findings of hepatic steatosis were also examined. Abdominal SAT weight/body weight ratio was positively and strongly correlated with abdominal VAT weight/body weight ratio. Fat percentage of the liver by CT evaluation, hepatic TG content, and hepatic steatosis score by histopathological evaluation showed positive cor- relations with one another. Fat percentage of the liver by CT evaluation and hepatic TG content was positively correlated with both the abdominal VAT weight/body weight ratio and SAT weight/body weight ratio, respectively. Furthermore, hepatic TG con- tent was negatively correlated with the abdominal VAT weight/SAT weight ratio. Our data suggest that abdominal SAT accumula- tion is positively correlated with hepatic steatosis in SD rats, rather than abdominal VAT accumulation. Further investigations are needed in order to clarify the precise mechanisms of SAT and VAT effects on the development of hepatic fat accumulation.
ACTA MEDICA NAGASAKIENSIA 59: 47−56, 2014 Key words: hepatic steatosis, subcutaneous adipose tissue, visceral adipose tissue, computed tomography, Sprague-Dawley (SD) rats
Address correspondence: Katsuhisa Omagari, M.D.,Department of Nutrition, Faculty of Nursing and Nutrition, University of Nagasaki, 1-1-1 Manabino, Nagayo-cho, Nagasaki 851-2195, Japan
Tel & fax: +81-95-813-5201, E-mail: [email protected] Received March 28, 2014; Accepted June 4, 2014
The aim of the present study was to elucidate the correla- tion between abdominal VAT or SAT volume and severity of hepatic fat accumulation by computed tomographic (CT), biochemical, or histopathological evaluation in Sprague- Dawley (SD) rats fed a normal or high-fat diet.
Materials and Methods Animals and experimental design
Five-week-old male SD rats (n=19) were purchased from Japan SLC Inc. (Hamamatsu, Japan). Rats were housed in individual cages that were kept in a room maintained at 22- 24℃ with 50-60% relative humidity and a 12-hour light/
dark cycle. All rats were acclimatized for 7 days, during which they had access to standard diet containing 10% fat (5.5% soybean oil and 4.4% lard, kcal) (D12450B; Research Diets Inc., New Brunswick, NJ, USA) and water ad libitum.
After acclimation, rats were randomly divided into 3 groups:
a control group (C group, n=6) fed a standard diet (D12450B;
Research Diets); a middle-high fat diet group (M group, n=6) fed a diet containing 45% fat (5.5% soybean oil and 39.4% lard, kcal) (D12451; Research Diets); and a high-fat diet group (H group, n=7) fed a diet containing 60% fat (5.5% soybean oil and 54.4% lard, kcal) (D12492; Research Diets). The proximate compositions of the diets fed to rats are shown in Table 1. Daily energy intake and body weights were monitored during the study.
Table 1. Dietary compositions by grams and kilocalories.
Component Control
(D12450B*) Middle-high fat
(D12451*) High-fat
(D12492*)
gram kcal gram kcal gram kcal
Casein 200 800 200 800 200 800
L-cystine 3 12 3 12 3 12
Cornstarch 315 1260 72.8 291 0 0
Maltodextrin 35 140 100 400 125 500
Sucrose 350 1400 172.8 691 68.8 272
Cellulose 50 0 50 0 50 0
Soybean oil 25 225 25 225 25 225
Lard 20 180 177.5 1598 245 2205
Mineral mix 10 0 10 0 10 0
Dicalcium phosphate 13 0 13 0 13 0
Calcium carbonate 5.5 0 5.5 0 5.5 0
Potassium citrate, 1H2O 16.5 0 16.5 0 16.5 0
Vitamin mix 10 40 10 40 10 40
Choline bitartrate 2 0 2 0 2 0
Yellow, red, or blue dye 0.05 0 0.05 0 0.05 0
Total 1055.05 4057 858.15 4057 773.85 4057
Protein (%) 19 20 24 20 26 20
Carbohydrate (%) 67 70 41 35 26 20
Fat (%) 4 10 24 45 35 60
Total 100 100 100
Energy (kcal/gram) 3.8 4.7 5.2
*This number was provided by Research Diets Inc. (New Brunswick, NJ, USA).
At 22 weeks of age, rats underwent CT measurement, and were sacrificed under anesthesia (pentobarbital sodium) after 12-hour fasting. Blood samples were taken from the inferior vena cava or the heart for analysis of biochemical parameters.
Serum samples were kept at −20℃ until analysis. Livers were removed, washed in cold saline, and weighed. Liver portions (approximately 5g) were fixed in 10% neutral buffered formalin for histopathological examination. Other liver portions (0.5g) were immediately frozen in liquid nitrogen and were stored at −80℃ for hepatic total cholesterol (TC) and triglyceride (TG) measurement.
All procedures were performed in accordance with the Guide for the Care and Use of Laboratory Animals (eighth edition, National Research Council of the National Academies), and were approved by the Animal Usage Committee of the University of Nagasaki, Japan.
Computed tomography (CT) imaging
Computed tomographic (CT) images were obtained using an X-ray CT system (Latheta LCT-100 Lite; Hitachi Aloka Medical Ltd., Tokyo, Japan) for imaging experimental animals according to the manufacturerʼs protocol. Rats at 22 weeks of age were anesthetized with isoflurane before CT scanning, and were then mounted on a holder and placed in the X-ray CT system. In the present study, CT imaging from the upper end of the diaphragm to the root of the tail was evaluated. Quantitative assessment of the lesion area was performed with Latheta software version 3.00 (Hitachi Aloka Medical). Abdominal weight of the muscle, VAT, and SAT were calculated from cumulative area measurement and mean CT values (Hounsfield unit, HU) of each CT slice.
Abdominal VAT weight/body weight ratio, abdominal SAT weight/body weight ratio, and abdominal VAT weight/SAT weight ratio were also calculated. Fat percentage of the liver (%) was calculated as follows: (mean CT value of muscle – mean CT value of liver) / (mean CT value of muscle – mean CT value of fat) x 100, in accordance with the manufacturerʼs information, which was modified from a previously reported formula.
8Serum biochemical analysis
Serum TC and TG levels were measured using the cholesterol oxidase DAOS method (Cholesterol E test Wako, Wako Pure Chemical Industries Ltd., Osaka, Japan) and the GPO DAOS glycerol method (Triglyceride E test Wako, Wako Pure Chemical Industries), respectively. Serum high- density lipoprotein cholesterol (HDL-C) and free fatty acid
(FFA) levels were measured using the phosphotungstic acid magnesium chloride precipitation method (HDL-cholesterol E test Wako; Wako Pure Chemical Industries), and the ACS ACOD method (NEFA C test Wako; Wako Pure Chemical Industries), respectively. Serum glucose levels were measured using the mutarotase and glucose oxidase method (Glucose C II test Wako; Wako Pure Chemical Industries).
Serum insulin levels were measured with a rat insulin enzyme-linked immunosorbent assay (ELISA) kit (Morinaga Institute of Biological Science Inc., Yokohama, Japan).
Serum adiponectin levels were measured with a mouse/rat ELISA kit (Otsuka Pharmaceuticals Co., Ltd., Tokyo, Japan).
Serum leptin levels were measured with a Leptin ELISA kit (Morinaga Institute of Biological Science). Because the units of measurement in the present study were not same as in the previously reported homeostasis model assessment-insulin resistance (HOMA-IR) and adipose tissue insulin resistance (Adipo-IR),
9,10“HOMA-IR index” was calculated as the product of fasting serum glucose (mg/dL) × fasting serum insulin (ng/mL) concentration, while “Adipo-IR index” was calculated as the product of fasting serum FFA (mEq/L) × fasting serum insulin (ng/mL) concentration.
Hepatic TC and TG concentrations
Lipids in the livers were extracted from frozen livers (0.5g) with the Bligh-Dyer extraction method,
11and extracted TC and TG were measured using individual assay kits (Cholesterol E test Wako and triglyceride E test Wako, respectively) as described above.
Histopathological examination
After fixation in neutral-buffered formalin, liver tissues were embedded in paraffin, sectioned, and processed for hematoxylin-eosin (HE) staining for histopathological examination. All histopathological examinations were performed by a pathologist (K.T.) who was blinded to the experimental and serological data. Histopathological findings were scored using the NASH Clinical Research Network Scoring System based on four semi-quantitative factors, as described previously:
12steatosis (0-3); lobular inflammation (0-3); hepatocyte ballooning (0-2); and fibrosis (0-4). In the present study, scores for steatosis, lobular inflammation, and hepatocyte ballooning were further classified as follows:
score 0.5, the feature was between scores 0 and 1; score 1.5,
between scores 1 and 2; and score 2.5, between scores 2 and
3.NAFLD activity score (NAS) was defined as the unweighted
sum of the scores for steatosis, lobular inflammation, and
hepatocyte ballooning; thus, scores ranged from 0 to 8. A NAS of 0 to 2 was not considered to be diagnostic of steatohepatitis, and scores of 5 or greater were considered to be diagnostic of steatohepatitis.
12Statistical analysis
All values were expressed as mean ± standard error (SE).
Differences between the three groups were tested for statistical significance using one-way analysis of variance (ANOVA), followed by Bonferroni multiple comparison test, chi-squared test, or Fisherʼs exact probability test.
Correlations between two variables were determined by Spearmanʼs rank correlation coefficient. All analyses were performed using IBM SPSS statistics software program, version 21 (IBM Co., Somers, NY, USA) on a Windows computer. A p value of less than 0.05 was considered to be statistically significant.
Results
Food intake, body weight, and liver weight/body weight ratio Cumulative energy intake during the 16-week study period was not significantly different among the groups, but body weight at 22 weeks of age and weight gain during the 16- week study period was significantly larger in the M group than that in the C group (p=0.036 and 0.027, respectively).
Liver weight/body weight ratio was significantly larger in the C group than in the H group (p=0.041, Table 2).
Computed tomography (CT) parameters
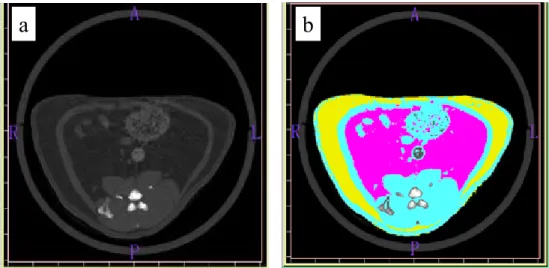
Representative CT imaging for quantitative assessment of the lesion area is shown in Figure 1. Abdominal VAT weight/
body weight ratio and SAT weight/body weight ratio were larger in the M group and H group than those in the C group (p<0.001 and 0.003, respectively). Abdominal VAT weight/
SAT weight ratios were not significantly different among the groups. Body weight at 22 weeks of age and weight gain during the 16-week study period were not correlated with abdominal VAT weight/SAT weight ratios (p=0.424 and 0.258, respectively). Mean CT value of the liver was highest in the C group (74.4 ± 2.5 HU), followed by the M group (56.4 ± 3.8 HU) and the H group (42.5 ± 3.8 HU, p<0.001).
The calculated fat percentage of the liver was lowest in the C group, followed by the M group and the H group (p<0.001, Table 2).
Serum biochemical parameters
Serum TC and HDL-C levels were significantly higher in the M group than in the H group (p=0.017 and 0.014, respectively). Serum TG and FFA levels were significantly higher in the C group than in the H group (p=0.001 and 0.026, respectively). There were no significant differences in serum levels of glucose, insulin, adiponectin, leptin, HOMA- IR index, and Adipo-IR index among the groups (Table 2).
Fig.1
a b
Figure 1. Representative CT imaging for quantitative assessment of lesion area. (a): Raw gray scale scan slice. (b): Selected areas of abdominal visceral adipose tissue (VAT) and subcutaneous adipose tissue (SAT) are indicated in pink and yellow, respectively. A, anterior; P, posterior; R, right; L, left.
Hepatic lipid concentrations
Hepatic TC concentrations were highest in the H group and lowest in the C group, but there were no significant differences.
Hepatic TG concentrations were significantly higher in the H group than those in the C group (p=0.017, Table 2).
Histopathological observation
There were no significant differences in score/grade of hepatic steatosis, lobular inflammation, hepatocyte ballooning, or NAS among the three groups. NAS of 5 points or greater, or hepatic fibrosis was not observed in any rats (Table 2).
Table 2. Cumulative energy intake, body weight, liver weight/body weight ratio, CT parameters, serum biochemical pa- rameters, hepatic lipid contents, and histopathological findings in rats at 22 weeks of age.
Parameter C group
(n=6) M group
(n=6) H group
(n=7)
Cumulative energy intake (kcal) 9822 ± 272 11207 ± 272 10976 ± 216
Final body weight (g) 547 ± 13a 598 ± 10b 579 ± 14ab
Weight gain (g) 382 ± 14c 437 ± 10d 416 ± 13cd
Liver weight/BW ratio (%) 2.8 ± 0.1e 2.7 ± 0.1ef 2.5 ± 0.1f
CT parameters
Abdominal VAT weight / BW ratio (%) 7.8 ± 0.3g 11.7 ± 0.5h 11.6 ± 0.4h Abdominal SAT weight / BW ratio (%) 3.4 ± 0.3i 5.9 ± 0.4j 5.9 ± 0.5j Abdominal VAT weight / SAT weight ratio (%) 234.1 ± 14.0 201.0 ± 13.6 207.1 ± 16.3 Fat percentage of liver (%) 2.4 ± 0.7k 8.1 ± 1.3l 12.8 ± 1.3m Serum biochemical parameters
Serum TC (mg/dL) 110 ± 4no 119 ± 13n 79 ± 8o Serum TG (mg/dL) 195 ± 17p 144 ± 15pq 108 ± 7q Serum HDL-C (mg/dL) 59 ± 1rs 65 ± 6r 41 ± 3s Serum FFA (mEq/L) 0.64 ± 0.06t 0.55 ± 0.03tu 0.43 ± 0.05u Serum glucose (mg/dL) 190 ± 10 170 ± 10 183 ± 7 Serum insulin (ng/mL) 4.7 ± 0.2 5.1 ± 1.0 5.3 ± 0.6 Adiponectin (μg/mL) 3.5 ± 0.2 5.0 ± 0.5 4.3 ± 0.8 Leptin (ng/mL) 14.5 ± 1.2 20.7 ± 1.4 19.4 ± 1.8 HOMA-IR index (glucose x insulin) 2.22 ± 0.16 2.17 ± 0.44 2.42 ± 0.30 Adipo-IR index (FFA x insulin) 2.97 ± 0.22 2.85 ± 0.70 2.26 ± 0.31 Hepatic lipid contents
Hepatic TC (mg/g liver) 3.9 ± 0.5 6.3 ± 1.1 7.1 ± 0.9 Hepatic TG (mg/g liver) 31.8 ± 7.0v 58.6 ± 12.3vw 74.3 ± 8.6w Histopathological findings (score)
Steatosis (0/0.5/1/1.5/2) 3/1/2/0/0 1/4/1/0/0 1/3/2/1/0 Lobular inflammation (0/1/2) 4/2/0 3/3/0 2/4/1 Hepatocyte ballooning (0/0.5/1) 6/0/0 3/2/1 2/4/1 NAS (0-2/2.5-4.5/5-8) 6/0/0 4/2/0 5/2/0
Fibrosis (0/1-4) 6/0 6/0 7/0
Values are means ± SE. Different superscript letters within the same parameter indicate significant differences at p<0.05.
CT, computed tomography; BW, body weight; VAT, visceral adipose tissue; SAT, subcutaneous adipose tissue; TC, total cholesterol;
TG, triglyceride; HDL-C, high-density lipoprotein cholesterol; FFA, free fatty acid; NAS, NAFLD activity score.
Correlations between adipose and liver tissue variables Correlations between adipose and liver tissue variables by anthropometric, CT, biochemical, or histopathological evaluation are summarized in Table 3. Abdominal SAT weight/body weight ratio was correlated positively and strongly with abdominal VAT weight/body weight ratio (r=0.801, p<0.001). Abdominal SAT weight/body weight ratio and abdominal VAT weight/SAT weight ratios revealed a strong negative correlation (r=-0.765, p<0.001).
Hepatic fat accumulation indices, i.e., fat percentage of liver on CT evaluation, hepatic TG content, and hepatic steatosis score by histopathological evaluation showed
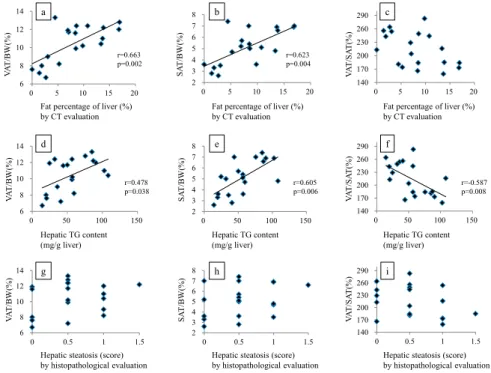
positive correlations with one another (Figure 2). Of these hepatic fat accumulation indices, fat percentage of the liver by CT evaluation was positively correlated with both abdominal VAT weight/body weight ratio and SAT weight/
body weight ratio. Hepatic TG content was also positively correlated with both abdominal VAT weight/body weight ratio and SAT weight/body weight ratio. Moreover, hepatic TG content was negatively correlated with abdominal VAT weight/SAT weight ratios. On the other hand, hepatic steatosis score by histopathological evaluation was not correlated with any of abdominal VAT or SAT weight/body weight and VAT weight/SAT weight ratios (Figure 3).
Table 3. Correlations between adipose and liver tissue variables by anthropometric, CT, biochemical, or histopathological evaluation.
Parameter LW/BW VAT/BW SAT/BW VAT/SAT L-%fat H-TC H-TG HS LI HB NAS
LW/BW 1.000
VAT/BW 0.002 1.000
(0.994)
SAT/BW 0.101 0.801 1.000
(0.682) (<0.001)
VAT/SAT -0.366 -0.342 -0.765 1.000 (0.123) (0.152) (<0.001)
L-%fat -0.010 0.663 0.623 -0.420 1.000
(0.969) (0.002) (0.004) (0.074)
H-TC 0.174 0.400 0.475 -0.454 0.665 1.000
(0.477) (0.090) (0.040) (0.051) (0.002)
H-TG 0.181 0.478 0.605 -0.587 0.749 0.900 1.000
(0.459) (0.038) (0.006) (0.008) (<0.001) (<0.001)
HS 0.267 0.233 0.216 -0.336 0.546 0.743 0.771 1.000
(0.270) (0.336) (0.375) (0.159) (0.016) (<0.001) (<0.001)
LI 0.222 0.351 0.321 -0.284 0.470 0.614 0.665 0.580 1.000
(0.360) (0.141) (0.180) (0.238) (0.042) (0.005) (0.002) (0.009)
HB 0.259 0.533 0.390 -0.239 0.709 0.548 0.547 0.495 0.434 1.000
(0.284) (0.019) (0.099) (0.325) (0.001) (0.015) (0.015) (0.031) (0.063)
NAS 0.353 0.395 0.360 -0.369 0.661 0.769 0.802 0.848 0.833 0.757 1.000
(0.138) (0.095) (0.130) (0.120) (0.002) (<0.001) (<0.001) (<0.001) (<0.001) (<0.001) Data are shown in terms of r values (p values).
LW/BW, Liver weight/body weight (BW) ratio; VAT/BW, Abdominal visceral adipose tissue (VAT) weight/BW ratio by computed tomography (CT) evaluation; SAT/BW, Abdominal subcutaneous adipose tissue (SAT) weight/BW ratio by CT evaluation; VAT/SAT; Abdominal VAT weight/SAT weight ratio by CT evaluation; L-%fat, Fat percentage of liver by CT evaluation; H-TC, Hepatic total cholesterol; H-TG, Hepatic triglyceride; HS, Hepatic ste- atosis by histopathological evaluation; LI; Lobular inflammation by histopathological evaluation; HB, Hepatocyte ballooning by histopathological evalu- ation; NAS, NAFLD activity score
Figure 3. Correlations between VAT/BW, SAT/BW, or VAT/SAT and fat percentage of the liver by CT evaluation (a-c), hepatic TG content (d-f), or hepatic steatosis score by histo- pathological evaluation (g-i). VAT/BW, abdominal visceral adipose tissue (VAT) weight/body weight (BW) ratio by computed tomography (CT) evaluation; SAT/BW, abdominal subcu- taneous adipose tissue (SAT) weight/BW ratio by CT evaluation; VAT/SAT, abdominal VAT weight/SAT weight ratio by CT evaluation.
Figure 2. Correlations between hepatic fatty accumulation indices. Fat percentage of the liver by CT evaluation and hepatic TG content (a), fat percentage of the liver by CT evaluation and hepatic steatosis score by histopathological evaluation (b), and hepatic TG content and hepatic steatosis score by histopathological evaluation (c) showed positive correlations. CT, computed tomography; TG, triglyceride.
0 3 6 9 12 15 18
0 20 40 60 80 100 120
0 2 4 6 8 10 12 14 16 18
0 0.5 1 1.5 0
20 40 60 80 100 120
0 0.5 1 1.5
Hepatic TG content (mg/g liver) Fat percentage of liver (%) by CT evaluation
Fat percentage of liver (%) by CT evaluation Hepatic TG content (mg/g liver)
Hepatic steatosis (score)
by histopathological evaluation Hepatic steatosis (score) by histopathological evaluation r=0.749
p=<0.001
r=0.546
p=0.016 r=0.771
P<0.001
Fig.2
a
b c
Fig.3
6 8 10 12 14
0 5 10 15 20
2 3 4 5 6 7 8
0 5 10 15 20
140 170 200 230 260 290
0 50 100 150
140 170 200 230 260 290
0 5 10 15 20
2 3 4 5 6 7 8
0 50 100 150
6 8 10 12 14
0 50 100 150
6 8 10 12 14
0 0.5 1 1.5 2
3 4 5 6 7 8
0 0.5 1 1.5 140
170 200 230 260 290
0 0.5 1 1.5
VAT/BW(%) VAT/BW(%) VAT/BW(%) SAT/BW(%) SAT/BW(%) SAT/BW(%) VAT/SAT(%) VAT/SAT(%) VAT/SAT(%)
Fat percentage of liver (%)
by CT evaluation Fat percentage of liver (%)
by CT evaluation Fat percentage of liver (%)
by CT evaluation
Hepatic TG content
(mg/g liver) Hepatic TG content
(mg/g liver) Hepatic TG content
(mg/g liver)
Hepatic steatosis (score)
by histopathological evaluation Hepatic steatosis (score)
by histopathological evaluation Hepatic steatosis (score)
by histopathological evaluation r=0.663
p=0.002 r=0.623
p=0.004
r=0.478
p=0.038 r=0.605
p=0.006 r=-0.587
p=0.008
a b c
d e f
g h i
In order to elucidate the correlation between abdominal VAT or SAT volume and severity of hepatic fat accumulation, SD rats were fed a normal diet or high-fat diet (containing 45% or 60% fat) for 16 weeks in the present study. In SD rats fed a high-fat diet for a relatively short period (3 to 12 weeks), hepatic fat accumulation can be observed before a significant increase in peripheral fat deposition.
13In the present study, abdominal VAT and SAT weight/body weight ratios were significantly larger at 22 weeks of age in groups fed a high-fat diet (M and H group) than those fed the normal diet (C group). Hepatic fat accumulation as evaluated by CT measurement of fat percentage of the liver and hepatic TG concentration were also significantly larger in high-fat diet groups (M or H group) than those in the normal diet group (C group). Because final body weight and weight gain during the 16-week study period were not correlated with abdominal VAT weight/SAT weight ratios, it is unlikely that SAT deposition occurred prior to VAT deposition. As abdominal VAT weight/body weight ratio revealed a strong positive correlation with abdominal SAT weight/body weight ratio, there were no correlations in abdominal VAT weight/SAT weight ratios among the three groups.
Visceral and subcutaneous adipose tissues have different structures and functions. Visceral adipose tissue is more cellular, vascular, innervated, and contains a large number of inflammatory and immune cells, lesser preadipocyte differentiating capacity and a greater percentage of large adipocytes than SAT. Moreover, VAT is also metabolically more active in producing adipocytokines such as leptin, tumor necrosis factor-alpha (TNF-alpha), interleukin 6, angiotensinogen, plasminogen activator inhibitors-1 (PAI- 1), and adiponectin. These adipocytokines flow directly into the liver via the portal vein.
2,3,7,14Therefore, visceral fat accumulation may be a more important risk factor for the development of metabolic syndrome or hepatic fat accumulation than subcutaneous fat.
2-5In the present study, hepatic fat accumulation indices such as fat percentage of the liver by CT evaluation and hepatic TG content were positively correlated with abdominal VAT weight/body weight ratio, as reported previously.
6In the present study, abdominal SAT weight/body weight ratio also revealed positive correlations with hepatic fat accumulation indices. It was particularly noteworthy that hepatic TG content was negatively correlated with abdominal VAT weight/SAT weight ratios. This suggests that hepatic TG content was correlated more strongly with abdominal SAT weight than VAT weight. Subcutaneous fat accumulation
represents the normal physiological buffer for excess energy intake with limited energy expenditure. In humans, about 80% of all body fat is in the subcutaneous area and visceral fat accounts for up to 10-20% of total fat in men and 5-8% in women.
14Therefore, it is possible that SAT volume actually contributes to more absolute risk for metabolic syndrome or hepatic fat accumulation than VAT volume because SAT volume is greater than VAT volume.
3Hepatic fat accumulation is reported to be associated with hepatic insulin resistance,
15although hepatic fat accumulation was not correlated with insulin resistance in the present study (Table 2). Adipocytes from VAT were reported to be more insulin-resistant than those from SAT.
14However, Garg reported that SAT was more strongly associated with insulin resistance than VAT in human studies.
16Maruyama et al. also reported that changes in fasting insulin concentration were correlated more strongly with changes in SAT volume than those in VAT volume in 744 adults.
17In this context, Ishikawa et al. reported that SAT regulates systemic insulin sensitivity by altering fat storage and the expression of TNF- alpha by adipocytes in VAT. Therefore, the balance between SAT and VAT accumulation may be important in systemic insulin resistance in metabolic syndrome.
18Amati et al. also reported that VAT and thigh SAT had markedly opposite associations with insulin sensitivity; thigh SAT exerted a protective influence against peripheral insulin resistance.
19However, this was not evident in the present study, as “adipo- IR index” was not statistically different among the C, M and H groups (Table 2), and fasting serum insulin and glucose were not significantly correlated with abdominal SAT weight/body weight ratio or abdominal VAT weight/body weight ratio (data not shown).
In the present study, hepatic fatty accumulation indices such as fat percentage of the liver by CT evaluation, hepatic TG content, and hepatic steatosis score by histopathological evaluation showed positive correlations with one another (Figure 2). However, correlations between such hepatic fat accumulation indices and abdominal VAT or SAT deposits did not show identical results. Measurement of fat percentage of the liver by CT is a simple, non-invasive method for evaluating all parts of the liver, but this method requires expensive equipment and exposure to radiation. Chemical measurement of hepatic lipid concentration has the advantages of being precise and able to measure TG, as well as TC, but this method evaluates only a small part of the liver tissue, and therefore runs the risk of “sampling error”.
Histopathological evaluation of the liver can evaluate both
steatosis and other features, such as lobular inflammation,
hepatocyte ballooning, and fibrosis. However, this method
Discussion
also evaluates a small part of the liver tissue, and therefore runs the risk of “sampling error”. In clinical settings, percutaneous liver biopsy has a risk of complications such as bleeding, pain, and hypotension.
20In the present study, it should therefore be noted that hepatic fat accumulation as evaluated by fat percentage of the liver by CT evaluation, hepatic TG content, and hepatic steatosis score by histopathological evaluation were negatively correlated with abdominal VAT weight/SAT weight ratios (r=-0.420, -0.587, and -0.336, respectively) (Table 3 and Figure 3), although only hepatic TG content showed a significant difference.
This finding indicates that hepatic fat accumulation is more closely correlated with abdominal SAT weight than with VAT weight.
It is known that increased serum TG and decreased serum HDL-C levels are associated with severity of NAFLD.
21However, serum TC levels were significantly lower in the H group than those in the M group, and serum TG and FFA levels were significantly lower in the H group than those in the C group in the present study (Table 2). This may be due to the “12-hour fasting” and the subsequent imbalance in TG acquisition and removal in the liver of rats fed a high-fat diet. Cahova et al. reported that serum TG and FFA in hereditary hypertriglyceridemic (HHTg) rats fed a high-fat diet and fasted for 24 hours were lower than those in HHTg rats fed a high-sucrose diet.
22The authors concluded that high-fat diet associated steatosis was characterized by downregulated FFA synthesis de novo, increased FFA oxidation, and significantly impaired very low density lipoprotein (VLDL) output.
22In conclusion, our results showed that abdominal SAT accumulation, rather than abdominal VAT accumulation, is positively correlated with hepatic steatosis in SD rats.
Therefore, physicians, nurses, dieticians, and investigators should pay closer attention to SAT status, in addition to VAT.
Further investigations will be needed in order to clarify the precise mechanisms responsible for the effects of SAT and VAT on the development of NAFLD.
Conflict of interest
The authors have no conflicts of interest to declare.
Acknowledgements
This study was partly supported by a Grant-in-Aid for Scientific Research from the Japanese Ministry of Education,
Culture, Sports, Science, and Technology to K. Omagari (No. 24614011), and by the Project Research Fund of University of Nagasaki to S. Kato.
References
1) Marchesini G, Brizi M, Bianchi G, et al. Nonalcoholic fatty liver dis- ease: a feature of the metabolic syndrome. Diabetes 50: 1844-1850, 2001 2) Eguchi Y, Eguchi T, Mizuta T, et al. Visceral fat accumulation and
insulin resistance are important factors in nonalcoholic fatty liver dis- ease. J Gastroenterol 41: 462-469, 2006
3) Fox CS, Massaro JM, Hoffmann U, et al. Abdominal visceral and sub- cutaneous adipose tissue compartments. Association with metabolic risk factors in the Framingham Heart Study. Circulation 166: 39-48, 4) Mahmood S, Taketa K, Imai K, et al. Association of fatty liver with 2007 increased ratio of visceral to subcutaneous adipose tissue in obese men. Acta Med Okayama 52: 225-231, 1998
5) Gastaldelli A, Cusi K, Pettiti M, et al. Relationship between hepaic/
visceral fat and hepatic insulin resistance in nondiabetic and type 2 diabetic subjects. Gastroenterology 133: 496-506,2007
6) Koda M, Kawakami M, Murawaki Y, Senda M. The impact of vis- ceral fat in nonalcoholic fatty liver disease: cross-sectional and longi- tudinal studies. J Gastroenterol 42: 897-903, 2007
7) Choudhary NS, Duseja A, Kalra N, Das A, Dhiman RK, Chawla YK.
Correlation of adipose tissue with liver histology in Asian Indian pa- tients with nonalcoholic fatty liver disease (NAFLD). Ann Hepatol 11:
478-486, 2012
8) Lubura M, Hesse D, Neumann N, Scherneck S, Wiedmer P, Schur- mann A. Non-invasive quantification of white and brown adipose tis- sues and liver fat content by computed tomography in mice. PLoS ONE 7: e37026, 2012
9) Gastaldelli A, Harrison SA, Belfort-Aguilar, et al. Importance of changes in adipose tissue insulin resistance to histological response during thiazolidinedione treatment of patients with nonalcoholic ste- atohepatitis. Hepatology 50: 1087-1093, 2009
10) Lomonaco R, Ortiz-Lopez C, Orsak B, et al. Effect of adipose tissue insulin resistance on metabolic parameters and liver histology in obese patients with nonalcoholic fatty liver disease. Hepatology 55:
1389-1397, 2012
11) Bligh EG, Dyer WJ. A rapid method of total lipid extraction and puri- fication. Can J Biochem Physiol 37: 911-917, 1959
12) Kleiner DE, Brunt EM, Van Natta M, et al. Design and validation of a histological scoring system for nonalcoholic fatty liver disease. Hepa- tology 41: 1313-1321, 2005
13) Omagari K, Kato S, Tsuneyama K, et al. Effect of a long-term high-fat diet and switching from a high-fat to low-fat, standard diet on hepatic fat accumulation in Sprague-Dawley rats. Dig Dis Sci 53: 3206-3212, 2008 14) Ibrahim MM. Subcutaneous and visceral adipose tissue: structural
and functional differences. Obes Rev 11: 11-18, 2010
15) Samuel VT, Liu Z-X, Qu X, et al. Mechanism of hepatic insulin resis- tance in non-alcoholic fatty liver disease. J Biol Chem 279: 32345- 32353, 2004
16) Garg A. Regional adiposity and insulin resistance. J Clin Endocrinol Metab 89: 4206-4210, 2004
17) Maruyama M, Fukui T, Yoshitaka S, et al. Both visceral fat and sub- cutaneous fat affect insulin resistance. Ningen Dock (Official Journal of Japan Society of Ningen Dock) 24: 146-150, 2009 (in Japanese with English abstract).
18) Ishikawa K, Takahashi K, Bujo H, Hashimoto N, Yagui K, Saito Y.
Subcutaneous fat modulates insulin sensitivity in mice by regulating TNF-alpha expression in visceral fat. Horm Metab Res 38: 631-638, 2006
19) Amati F, Pennant M, Azuma K, et al. Lower thigh subcutaneous and higher visceral abdominal adipose tissue content both contribute to insulin resistance. Obesity 20: 1115-1117, 2012
20) Bravo AA, Sheth SG, Chopra S. Liver biopsy. N Engl J Med 344: 495- 500, 2001
21) Razavizada M, Jamali R, Arj A, Talari H. Serum parameters predict the severity of ultrasonographic findings in non-alcoholic fatty liver disease. Hepatobiliary Pancreat Dis Int 11: 513-520, 2012
22) Cahova M, Dankova H, Palenickova E, Papackova Z, Kazdova L. The opposite effects of high-sucrose and high-fat diet on fatty acid oxida- tion and very low density lipoprotein secretion in rat model of meta- bolic syndrome. J Nutr Metab 2012: 757205: Cited 26 Mar 2014. Avail- able from URL: http://dx.doi.org/10.1155/2012/757205