Acta med. Nagasaki. 13 : 1-13
Studies on the Body Surface Area of Japanese
SHIGEKI FUJIMOTO and TSUTOMU WATA NARE*1
Department of Hygiene, Nagasaki University School of Medicine, Nagasaki, Japan
A. Regional Rates by Sex, Age and Body Shape Received for publication, July 10, 1969
Surface area of 201 Japanese (both sexes) from infancy to old age selected statistically by sex, age and body shape were measured and the regional rates calculated and discussed. The results are as follows.
1. There was no difference between either side of the body for age or sex. 2. The rate of head, face and neck decreased while that of the lower extremities increased with aging. 3. After adolescence regional rates could be differenciated between the sexes. The rates of the thigh of the female were considerably higher than that of the male. 4. As for body shape, rate of the head, face and neck tended to lower toward obesity and rose toward slenderness. The rates of the trunk, upper and lower extremities revealed the opposite tendency to the former. 5. These results vary little as compared to other studies done on Japanese.
However, compared to a German or an American revealed a higher rate for limbs. The rate was definetely lower for the Westerner.
INTRODUCTION
For heat radiation, scientific studies on clothing and for human engineering, it is very important to divide the body surface area into various regions and observe them separately.
TAKAHIRA, NIIYA, KOBAYASHI and KOIKE in Japan as well as MEEH in Germany, DUBOIS in USA classified and examined comparatively the regional rates of body surface area by race, sex and age. In their works, however, the number of the subjects were as less as between 1 and 10 in sex and age. Moreover, the statistic reasons and formalities enough to represent the parent population of the selected subjects were not clear.
In this study, 201 Japanese of both sexes from neonatal to old age were chosen as the subjects, who had Japanese standard physique by sex and age, and such as of obesity and slenderness after adolescence.
Then the surface area of them was measured actually and seperately according to regions, and discussed by body shape, sex and age.
*ユ藤 本薫 喜 ・渡 辺 孟
METHOD
The subjects were 201 Japanese of both sexes from neonatal to 76 years of old as shown in the upper part of Table 1. As shown in the
series of this study, they were consisted of such people as follows, and were classified by sex and age. They were of Japanese standard physique and body shape chosen from a special group of people who were measured actually by sex and age, (and the group itself is authorized as a sampling group of Japnese). Besides them, people of obesity and slenderness were chosen especially from those of 12-40 years of age. Coefficient of obesity and slenderness and Rohrer index were used mainly to select the subjects.
Table 1. Regional rates of body surface by sex and age (%)
\\ _ Age 0 1 2 3 4-56-9 1011 12-14 15-17 18-20 20^-40 50^-
Part N 12 18 13 12 12 12 14 9 10 10 10' 9 9 16 12 11 12 1 Hair 8.9 9.'0 8.6 8.4 7.5 6.5 5.8 4.8 4.8 4.3 4.6 4.3 4.7 4.0 4.5 4.0 4.6 2 Forehead 1.4 1.3 1.2 0.9 0.9 0.7 0.7 0.8 0.7 0.6 0.6 0.6 0.6 0.7 0.7 0.6 0.6 3 Face 3.9 3.7 3.5 3.4 2.9 3.8 3.3 2.3 2.2 2.2 2.0 2.0 2.1 2.0 2.2 2.1 2.1 4 Ear 1.0 1.0 0.9 0.8 0.7 0.5 0.5 0.5 0.4 0.5 0.6 0.5 0.5 0.6 0.6 5 Neck 3.3 3.2 3.2 2.6 3.1 2.7 2.5 2.8 2.5 2.7 2.4 2.7 2.4 2.6 2.5 2.6 2.1 6 Upper front trunk 8.214.014.6 6.612.710.911.311.012.111.411.9 7.8 7.6 6.2 7.413.513.6
7 Lower front trunk 6.5 6.4 5.7 5.0 6.6 5.1
8 Upper back trunk 8.811.612.2 8.811.613.111.410.710.311.811.1 9.4 8.7 9.8 8.512.512.2
9 Lower back trunk 3.6 3.1 2.8 2.5 2.8 3.4
10 Hip 9.5 7.9 8.2 8.2 9.3 8.9 8.710.110.310.2 9.9 7.9 9.1 9.8 9.6 8-8 8.9 11 Upper arm 6.9 6.9 7.5 7.4 7.2 7.7 7.7 7.7 7.6 8.0 8.1 8.1 8.1 8.4 7.9 7.9 8.0 12 Lower arm 5.7 5.8 5.6 5.9 5.9 6.1 6.0 9.2 6.0 6.4 6.3 6.3 6.0 5.5 5.7 6.4 5.9 13 Hand 5.2 6.1 5.0 5.7 5.5 5.2 5.3 5.3 5.1 5.4 4.7 5.0 4.6 5.3 5.1 5.9 5.5 14 Thigh 11.111.812.0 12.812.614.214.914.616.614.818.315.617.914.617.115.215.7
15 Leg 9.510.310.811.712.513.614.614.613.413.912.813.713.113.412.812.713.0
16 Foot 6.6 7.5 6.7 7.4 7.6 7.6 8.0 8.4 7.9 7.8 7.0 7.6 6.8 7.3 7.1 7.4 7.2 N: stands for number of subjects, correspondingly.
RESULTS
1. Regional rates by sex and age
After calculating the regional rates of surface area by sex and
age, the rates that differ only a little from each other are put
together and their mean values are shown in Table 1. As there was
no significant difference between either side of the body for any age or sex, the total values are shown.
It seems that the further integration of age group causes much more errors judging from the degree of difference among the values.
The rate of head, face and neck decreases with aging and that of the lower extremities such as thigh increases.
After adolescence, the differences of the regional rates between sexes became significant, and the regional rates of the thigh is considerably higher in female.
2. Regional rates according to body shape
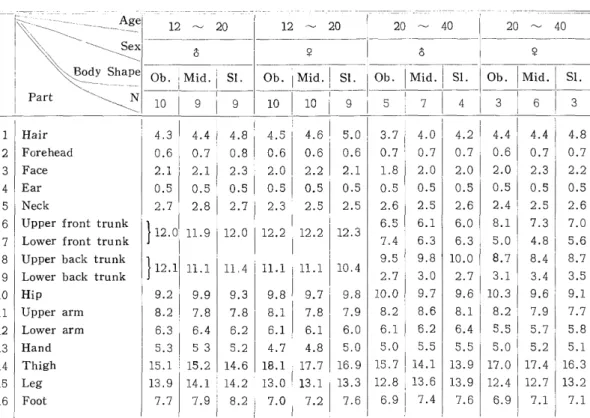
The values divided into 12 groups as shown in Table 2 were arranged from the regional rates of the people of 12-40 years of age who included many samples in any sex and age, and body shape.
Body shape was evaluated by HIRATA'S obesity-slenderness index C J31/Weight(Kg) H x 103 in three grades, namely obesity (higher than
eight (cm)
24), slenderness (lower than 22) and middle (between the both numbers). Judging from this, the rate of head, face and neck as well as hair part of head are higher in middle and slenderness than in obesity. The rates of the limbs, upper and lower extremities show
Table 2. Regional rates of body surface by shape (/0/0)
-_- - Agel 12 20 12 20 20 40 20 40
Body Shape Ob
. Mid. Sl. Ob. Mid. Sl. I Ob. Mid. Sl. Ob. Mid. Sl.
Part N 10 ' 9 9 10 10 9 5 7 4 3 6 3
1 Hair 4.3 4.4 4.8 4.5 4.6 5.0 3.7 4.0 4.2 4.4 4.4 4.8
2 Forehead 0.6 0.7 0.8 0.6 0.6 0.6 0.7 0.7 0.7 0.6 0.7 0.7
3 Face 2.1 2.1 2.3 2.0 2.2 2.1 1.8 2.0 2.0 2.0 2.3 2.2
4 Ear 0.5 0.5 0.5 0.5 0.5 0.5 0.5 0.5 0.5 0.5 0.5 0.5
5 Neck 2.7 2.8 2.7 2.3 2.5 2.5 2.6 2.5 2.6 2.4 2.5 2.6
6 Upper front trunk 6.5 6.1 6.0 8.1 7.3 7.0
112.0 11.9 12.0 12.2 12.2 12.3
7 Lower front trunk 7.4 6.3 6.3 5.0 4.8 5.6
8 Upper back trunk 9.5 9.8 10.0 8.7 8.4 8.7
} 12.1 11.1 11.4 11.1 11.1 10.4
9 Lower back trunk 2.7 3.0 2.7 3.1 3.4 3.5
10 Hip 9.2 9.9 9.3 9.8 9.7 9.8 10.0 9.7 9.6 10.3 9.6 9.1
11 Upper arm 8.2 7.8 7.8 8.1 7.8 7.9 8.2 8.6 8.1 8.2 7.9 7.7
12 Lower arm 6.3 6.4 6.2 6.1 6.1 6.0 6.1 6.2 6.4 5.5 5.7 5.8
13 Hand 5.3 5 3 5.2 4.7 4.8 5.0 5.0 5.5 5.5 5.0 5.2 5.1
14 Thigh 15.1 15.2 14.6 18.1 17.7 16,9 15.7 14.1 13.9 17.0 17.4 16.3
15 Leg 13.9 14.1 14.2 13.0 13.1 13.3 12.8 13.6 13.9 12.4 12.7 13.2
16 Foot 7.7 7.9 8.2 7.0 7.2 7.6 6.9 7.4 7.6 6.9 7.1 7.1
I ~
quite an opposite tendency to the former, and this is remarkable in the back side of trunk and thigh. Moreover the ratio of the other parts to head, face and neck is always largest in obesity, next in middle and slenderness.
3. Comparison with the results of other studies, especially with those of the foreigners
There are some results comparable with ours concerning sex, age or regional rates of body surface area. They are the results of MEEH
in Germany and NIIYA, TAKAHIRA in Japan and of DUBOIS in USA.
Though there are some other comparable results except these, they are almost the same with each other. So some typical studies men- tioned above were selected.
First, compared with Germans dividing into 11 regions as shown in Table 3, the rate of head, face and neck of German males is a little higher than that of Japanese males and the rate of trunk of the formers is lower. The rates of thigh and waist of the forrners are higher again than Japanese males. As for children, Germans are higher in the rates of head, face and neck, and in thigh and waist, but lower extremities. Distinctive characters of the two races appeares
clearly even on the body surface area of both child and adult.
Next, comparing American males and Japanese males of about the Table 3. Comparison of regional rates of body surface of
Japanese and foreigners (1) (%)
Worker Meeh Author Niiya Taka- hira Meeh Author Niiya
_
Subject - G.m Jap.m Jap.f Jap.m Jap.f Jap.m G.b bJ&'g Jap.b JaP•g
Age 15-66 15-70 15-49 19-67 17^-37 18-58 8^-13 6-11 9 11
Pa rt N 8 46 31 10 10 j 10 4 26 1 1
I Hair 4.2 4.1 4.6 4.3 4.8 6.8 6.1 5.3 5.4
II Face 2.5 3.2 3.2 3.1 3.3 1 10 5.0 4.2 3.7 3.9
III Neck 3.5 2.6 2.4 2.4 2.2 3.6 2.6 2.9 2.1
IV Upper arm 7.5 8.1 8.0 8.2 1 8.4 1
14 6.8 7.7 8.3 7.9
V Lower arm 6.2 6.1 6.0 6.1 5.8 5.7 6.0 6.0 5.7
VI Hand 5.3 5.4 4.8 5.3 4.8 6 5.1 5.3 5.9 5.5
VII Upper trunk 16.1 }25 .1 }23.8 16.6 16.2 25 15.9 23.3 14.6 15.5 } }
VIII Lowe rtrunk 6.2 8.1 7.7 7.2 7.1 7.9
IX Waistthigh 26.9 24.3 27.3 25.3 27.6 1 38 24.4 23.0 24.0 25.7
X Leg 13.5 13.4 12.9 13.4 12.8 12.0 14.1 13.8 12.9
XI Foot 11 7.1 7.5 7.0 7.2 6.4 7 7.5 7.8 8.4 7.5
G. m stands for German male. As well Jap. m for Japanese male, Jap. f for
Japanese female, G. b for German boy and Jap. b & g for Japanese boy and
girl, respectively.
Table 4. Comparison of regional rates of body surface of Japanese and foreigners (2) (%)
Worker DuBois Author
Subject USA m Jap. m
Age 18 32 18 40
N 5 25
Part
a Head & Face 6.3 7.3
b Trunk 35.0 37.3
c Arm 14.4 14.1
d Hand 5.2 5.2
e Thigh 19.2 15.0
f Leg 13.1 13.5
g Foot 6.8 7.4
Trunk includes neck and hip.
same age by dividing into 7 parts from `a' to `g' as shown in Table 4, Japanese are higher in the rate of head and. face and in limbs, and Americans are higher in the rate of upper extremities.
DISCUSSION
In the study of the regional rates of surface area, we must have several ways to express them in compliance with the purposes. For example, in the study of physique, skin temperature, exchange of body heat and so on, we may change the combination of body region, also by pose or action of the subjects.
Thus, it is extremely difficult for the regional rate to answer all of these purposes at the same time. Therefore, in comparison with the results accomplished before, much more subjects with clearer statistical base was selected and measured so that standards of the regional rates for Japanese people could be made by sex, age and body shape.
It seems to suffer no inconvenience for the above pattern to be used as standards of regional rates for Japanese, For example, at first, this can be applied for 12 division method generally utilized for the comprehensive indication of the skin temperature,
Next, in comparison with the foreigners, Germans are higher than
Japanese in the rate of head, face and neck region, and Americans
lower. The more characteristic result of this comparison is that
Japanese are superior to the. foreigners in the trunk and foreigners in
the lower extremities. In case of comparing DuBOIS's formula (C-71.
84) generally used in Foreign country and TAKAHIRA' S (C-72.46) in Japan, however, this result is contradictory to the fact that Japanese have larger surface area than the foreigners under the same condition in height and weight.
This result suggested that TAKAHIRA' S formula was unreasonable.
For, one has two larger `lower extremities, its total surface area must be larger than that of one who has one larger trudk.
Currently the physical growth and the changing of physical proportion are remarkable in the young people in Japan. It is likely that the Japanese physique and body shape will undergo a considerable change in future, and at the same time, the construction of body shape seems to change gradually from normal to obesity, or to tall.
So that in the study of body surface area, the consideration for the variety of body shape as in this study may become more important.
Any way the further investigation should be expected.
CONCLUSION
Surface area of 201 Japanese (both sexes) from infancy to old age selected statistically by sex, age and body shape were measured and the regional rates calculated and discussed. The results are as follows.
1. There was no difference between either side of the body for age or sex.
2. The rate of head, face and neck decreased while that of the lower extremities increased with aging.
3. After adolescence regional rates could be differentiated between the sexes. The rates of the thigh of the female were considerably
higher than that of the male.
4. As for body shape, rate of the head, face and neck tended to lower toward obesity and rose toward slenderness. The rates of
the trunk, upper and lower extremities revealed the opposite
tendency to the former.
5. These results vary little as compared to other studies done on Japanese. However, compared to a German or an American
revealed a higher rate for limbs. The rate was definitely lower for the Westerner.
6. Judging statistically the subjects and methods in this study, the regional rates of body surface described in this paper by sex, age
and body shape are acceptable to be used as a standard for the
Japanese people for the study and review of all physical parts.
B. Caluculation Formulas in Three Stages over All Age The various calculation formulas for estimating body surface area are devised from actual measurements of body weight, height and surface area on 201 Japanese from neonatal to old age, and then compared and examined concerning error. As the result of the comparative examination, the following three formulas are taken as the most fitting ones for Japanese over all age.
1. Infants
S = WO.473 X HO.655 X 95.68 2. 1-5 years
S=WO.423 XHO.362x381.89 3. Over 6 years to old age S = W0.444 X HO.663 x88.83
INTRODUCTION
It is very convenient to have the formula or the graph from which body surface area could be calculated comparatively easily by physical measurements such as height and weight that can be measured easily.
It is better if errors of the values calculated from the formula or graph are small enough to be permitted in comparison with the accuracy of the other measurements and studies.
As for the method of the measurement, gampi paper-planimeter method is the best one, for it answers the all-comprehensive purpose exceedingly. On measuring 201 Japanese of both sexes selected statistically, some calculation formulas most suitable for each sex and age are required.
After finishing the measurement of subjects over all age, it has been examined that the formula with less number and slightest possibility of error from any points of view could cover the Japanese over all age. After all, as mentioned in this study, the three calculation formulas in three stages of age, newborn, young child and over 6 years to old age answered the first purpose exceedingly.
METHOD
1. The materials of this study are actually measured surface area and some other physical measurements such as height and weight
in 201 Japanese from neonatal to old age (108 males and 93
females).
2. Formulas used for the investigation are as follows (The following
surface area, height and weight are their logarithms. Units are
cm 2 , cm and kg respectively.),
Formula A
Multiple regression equation of weight and height for surface area in newborn only (under 1 years).
Formula B
Multiple regression equation of weight and height for surface area in newborn and young child (0-5 years).
Formula C
Corrected formula H by logarithm regression equation of index of obesity and slenderness of every newborn or young child for C (constant) to which the formula S=WO.425 x HO.725 x C is most suitable.
Formula D
Multiple regression equation of weight and height for surface area in young child (1-5 years).
Formula E
The same formula as the formula C in young child (1-5 years) Formula F
The formula corrected by applying the parabola, which is described separately with years (months) by C for which each of newborn and young child (0-5 years) fits the most in the formula S = WO. 425 x HO. 725 x C Formula G
The formula which requires the most fair constant for each sex and age in the formula S = W0.425 x HO.725 x C
Formula H
TAKAHIRA' S formula . Formula I
FUJIMOTO-WATANABE' S for the people over 12 years of age.
Formula J
FUJIMOTO-WATANABE' S for the people over 6 years of age.
These are the major ones. They are showm in the Table 5.
Concerning the simple formula and multiple regression equation of anti-logarithm of height, weight and chest circumference, they were omitted because of many discontented points after investigation.
RESULTS
The distribution of constant (C) of each age of the most conformable
values of the whole subjects (0-old age) in the formula S =WO.425 X
Table 5. Formulas Used for Investigation Formula A : S=WO.473 x HO.655 x 95.68
Formula B : S=W0.469xH0.424x269.19 Formula C : S=WO.603 x HO.192 X518.74 Formula D : S=WO.423 x HO.362 x 381.89 Formula E : S=W 0.654 x H0.037 X912.43
Formula F : S=W0.425 xH0.725 x (-0.240x2-0.578x+78.20)
(x : Yearlyage showing monthly age by the decimal system) Formula G : "C" in the formula WO. 425 x HO. 725 X C
stands for either of the values
shwon in the right hand space of
Table 2 and Table 5.
Formula H S=WO.425 x H0.725 x 72.46 Formula I : S=W0.423 x H0.615 x 102.65 Formula J : S=W0.444 x H0.663 x 88.83
S Surface area in cm2, W : Body weight in kg H : Height in cm
H0.725 X C is rather wide in newborn (under 1 year) and young child (1-5 years) which is different from that in the people after adolescence as shown obviously in Fig. 1.
Such difference between the two seems to cause great error in case of using only one formula for the subjects over all age. Therefore, as mentioned before, all the subjects were classified by 4 periods, newborn, young child, school child and after adolescence, and each of them was investigated.
1. Period of newborn and young child
Eight calculation formulas from A to H were used to calculate the
Fig. 1. Distribution of the most conformable values of constant (C) of the whole
subjects (0-old age) in the formula S=WO.425 x H0.725 x c
surface area of newborn and young child (0-5 years). The error (%) between calculated values and actually measured ones was examined.
The subjects in the period of newborn . and young child were divided into 5 age groups from 0 to 4-5 years and each of them was applied to each formula respectively. The mean value of the above mentioned error was shown in the Table 6 and mean square of error was in the Table 7.
On outlining these facts, in case of calculating the surface area of newborn and young child together with one formula, great error is caused in newborn, and moreover the disparity of error among age is large. So it seems better to divide into two periods, newborn and young child on calculation.
Therefore it is indicated that the formula A is distinctly superior to the other formula concerning the period of newborn. Then the formula E and G as well as D can be applied to the period of young child. Formula E makes great errores pecially in 4-5 year, and formula
Table 6. Mean value of ' Error in Each Formula of Newborn and Young child (%)
Formula C
onstnat
Age \ A B C D E F G H of G
0- 12 -0.24 1.45 -0.16 - - -0.29 -0.1 -7.1 78.08
1^ 18 - -1.88 -2.16 0.27 -1.66 -1.66 00.
.00 - -86..20-7'4 78.77 77.25
2- 13 - -1.69 -1.33 -10.87 -1.48 -1.36 0.0 -4.9 75.85
3^- 12 - 0.26 1.41 0.14 1.25 -0.54 -0.0 -1.4 73.55
4.5 12 - 2.27 3.38 1.15 2.44 -0.96 0.0 3.9 69.76
Total -0.12 ~ -0.01 0.17 -0.09 -1.03
Table 7. Mean Square of Error in Each Formula of Newborn and Young Child (%)
Formula
Ag \ A B C D E F G H
0 4.03 12.15 10.13 - - 8.62 7.73 6.68
1 - 3.94 3.13 3.53 3.51 4.05 3:75 13.36 2.65
2 - 1.28 1.42 1.96 2.13 4.20 1.67 3.87
3 - 3.12 4.75 4.03 5.94 3.65 4.81 4.66
4.5 I - 3.09 9.82 3.45 13.41 6.21 4.06 3.48
Total 6.79 9.25 3.55 8.62 5.16
G requires calculation in every stage of age. Therefore, it is proper to use formula D which can be used for the whole period of young child and makes slightly smaller error than formula G. Formula D is not wellformed with large constant, and it seems to be caused by the variety of young child.
2. Over 6 to old age
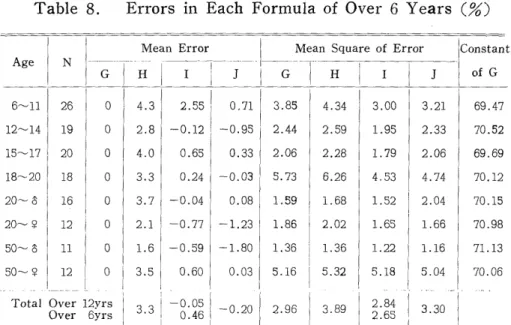
The surface area of the subjects over 12 years looks most stabilized as shown in Fig. 1. FUJIMOTO-WATANABE'S general-use formula for the people over 12 years was published before. Though, for the purpose of covering the subjects over all age with as few formulas as possible, the results of calculation by four formula G, H, I, J are examined concerning the subjects over 6 years. The mean error and mean square of error are shown in Table 8. Judging from the mean value of error, TAKAHIRA' S formula should be omitted because the rate of error is higher than others by 3-4%. Formula G is out of the question because it requires the most adaptable constant every stage of age. In comparison with I and J, formula J is better than I. For, the formula J is to be used for the subjects over 6 years (the rate of error is 0.20
%) while the formula I is for those who over 12 years and limit should be extended as low as 6 years (the rate of error in 6-11 years is 2.55
%). In formula J, the rates of error through all age is reasonable and the difference between each age is not so remarkable. So it can be used to calculate the surface area of the subjects over 6 years of age.
The mean square of error in formula H is large as a whole. In formula G, it is a little larger in some stages of age. In formula I, it is the smallest. In formula J it is not so small as in I in the youth, while
Table 8. Errors in Each Formula of Over 6 Years (%)
Mean Error Mean Square of Error Constant
Age N -
G H I J G H I J of G
6^-11 26 0 4.3 2.55 I 0,71 3.85 4.34 3.00 3.21 69.47
12-14 19 0 2.8 -0.12 -0.95 2.44 2.59 1.95 2.33 70.52
15-17 20 0 4.0 0.65 , 0.33 2.06 2.28 1.79 2.06 69.69
18-20 18 0 3.3 0.24 -0.03 5.73 6.26 4.53 4.74 70.12
20--8 16 0 3.7 -0.04 0.08 1.59 1.68 1.52 2.04 70.15
I
20- Y 12 I 0 2.1 -0.77 -1.23 1.86 2.02 1.65 1.66 70.98
50-6 11 0 1.6 -0.59 -1.80 1.36 1.36 1.22 1.16 71.13
I
50-9 12 0 3.5 0.60 0.03 5.16 5.32 5.18 5.04 70.06
Total Over 12yrs -0.05 2.84
Over 6yrs 3'3 ± 0.46 -0.20 2.96 3.89 2 65 3.30
i I I I