late pregnancy with physiological lower
extremity oedema in Vietnam: A cross sectional and correlational study
著者 ド ティ ラン アイン
著者別表示 Do Thi Lan Anh journal or
publication title
博士論文本文Full 学位授与番号 13301甲第4991号
学位名 博士(保健学)
学位授与年月日 2019‑09‑26
URL http://hdl.handle.net/2297/00059262
Original Article Journal of Wellness and Health Care Vol.43 ⑴ 11〜21 2019
Disability and physical activity of women in late pregnancy with physiological lower extremity oedema in Vietnam:
A cross sectional and correlational study
Do Thi Lan Anh
1), 2), Mayumi Okuwa
3)*, Junko Sugama
4)Abstract
Purpose: This study was performed to identify risk factors associated with physiological lower extremity oedema in late pregnancy and to evaluate the relationship between disability and physical activity in women with such oedema in late pregnancy.
Method: This cross-sectional and correlational study was performed in 300 healthy pregnant women giving birth at gestational week 38 – 42 at Haiphong Hospital of Obstetrics and Gynaecology, Vietnam. Oedema was assessed at three sites, i.e., the foot, medial malleolus and pretibial edge, of both lower extremities. The degree of swelling at each site was graded according to the Fukazawa method, and oedema was given a grade of 0 – 3 at each point on each leg, with the final oedema score taken as the sum of these grades. Women with a score ≥ 2 in at least one leg were defined as positive for oedema.
All of the women included in the study completed the 12-item World Health Organisation Disability Assessment Schedule (WHODAS) questionnaire and the Pregnancy Physical Activity Questionnaire (PPAQ).
Results: Parity (OR, 2.18; 95%CI, 1.18 – 4.03, p = 0.01), gestational weight gain (OR, 1.19;
95%CI, 1.1 – 1.29, p < 0.01), foetal weight (OR, 1.002; 95%CI, 1.000 – 1.005, p = 0.05) and gestational week (OR, 2.61; 95%CI, 1.04 – 6.59, p = 0.04) were risk factors associated with physiological oedema in late pregnancy. The WHODAS scores were significantly higher in the oedema group than the non-oedema group in the following domains: total score, mobility, participation, getting along and self-care. The PPAQ scores were not significantly different between the groups. The oedema group showed weak negative correlations between WHODAS (total score) and PPAQ (exercise, moderate activity) (r = −0.3, −0.28), WHODAS (mobility) and PPAQ (exercise, moderate activity) (r = −0.28, −0.32), WHODAS (life activities) and PPAQ (exercise) (r =−0.21) and WHODAS (self-care) and PPAQ (moderate activities) (r = −0.23). There were also weak positive correlations between severity of oedema and WHODAS (total score, cognition, and participation; r = 0.29, 0.23, 0.27, respectively).
Conclusion: Gestational week, gestational weight gain, parity and foetal weight were shown to be risk factors associated with physiological oedema in pregnancy. Women in late pregnancy with physiological lower extremity oedema were more likely to have disability. The results presented here suggested that additional advice, such as dietary salt restriction, leg elevation and left-side sleeping, and specific treatments are required to reduce the incidence of lower extremity oedema during pregnancy.
KEY WORDS
physiological lower extremity oedema, disability, physical activity, risk factors, pregnant women.
1 ) Division of Health Sciences, Graduate School of Medical Sciences, Kanazawa University, Kanazawa, Japan
2 ) Nursing Faculty of Haiphong University of Medicine and Pharmacy, Haiphong, Vietnam and Clinical Nurse of Haiphong Hospital of Obstetrics and Gynaecology, Haiphong, Vietnam
3 ) Department of Clinical Nursing, Faculty of Health Sciences, Institute of Medical, Pharmaceutical and Health Science, Kanazawa University, Kanazawa, Japan
4 ) Advanced Health Care Science Research Unit, Innovative Integrated Bio-Research Core, Institute for Frontier Science Initiative, Kanazawa University, Kanazawa, Japan
* Corresponding author
Introduction
Physiological oedema is very common in pregnancy.
Internal factors related to this oedema include an increase in fluid volume, an alteration in venous smooth muscle tone, increased pressure within the veins caused by the gravid uterus reducing venous return from the lower body, and decreased colloid osmotic pressure of plasma
1). External factors include hot weather and prolonged sitting/standing
2). Most previous studies indicated that the prevalence of oedema tends to increase significantly over time. Gardenghi et al.
3)showed that the prevalence of lower limb oedema in healthy primigravidae in a cohort study in Brazil was 0%, 20%, and 55% in the 1
st, 2
nd, and 3
rdtrimesters, respectively. Lebech et al.
4)also stated that the weekly prevalences of lower limb oedema in normal pregnancy in a longitudinal study were 20% and 60% in weeks 31 and 42, respectively. Thus, gestational week is a very important factor related to this oedema. However, many pregnant women have physiological oedema, whereas some in the same gestational week do not.
In these cases, are there any other factors related to physiological oedema? Reeder and Martin stated that
“Swelling of lower extremities is very common during pregnancy and is sometimes very uncomfortable”
2). Fahad and Sana
5)also found that 76% of women reported a feeling of heaviness, with 89% having pain in the lower extremity. Despite knowledge of this uncomfortable condition, no study to date has evaluated the effects of physiological oedema on the daily lives of pregnant women. Therefore, we investigated whether oedema and its severity are associated with disability or reduction of physical activity (PA) in women. According to the World Health Organization (2001), disability was defined as “a decrement in each functioning domain”
6). The results of the present study are expected to contribute to the establishment of effective treatment protocols for physiological oedema in Vietnam, where
no standard intervention has been established, and healthcare providers have limited awareness. Based on the conceptual framework (Figure 1), this study had 2 aims:
a) To identify risk factors associated with physiological lower extremity oedema in late pregnancy;
and
b) To evaluate disability by the World Health Organization Disability Assessment Schedule (WHODAS) score and PA by the Pregnancy Physical Activity Questionnaire (PPAQ) score of women in late pregnancy with physiological lower extremity oedema in Vietnam.
Methods
1. Study design and participants
This was a cross-sectional, observational study conducted in the labour ward of Haiphong Hospital of Obstetrics and Gynaecology, Haiphong, Vietnam, from September 2017 to March 2018. Participants were pregnant women who came to deliver at the labour ward. All women who met the following inclusion criteria were recruited: 1. 18-45 years old; 2. full-term pregnancy (38
thweek-42
ndweek); and 3. in the latent phase of the first stage of labour (the cervix was dilated
≤3 cm). Exclusion criteria: 1) unilateral leg swelling, cardiovascular, renal, metabolic, or systemic diseases, malnutrition, preeclampsia, or mental diseases; 2) unhealthy pregnancy, such as artificial fertilization (intrauterine insemination (IUI) and in vitro fertilization (IVF), threatened abortion, threatened preterm labour, multiple pregnancies, abnormal foetus or foetal support system (placenta, umbilical cord, amniotic sac); and 3) much labour pain or refused to participate without any reasons.
2. Data collection
The data were collected from medical records, physical assessments and interviews, and self- administered questionnaires.
1 ) Characteristics of the pregnant women
Variables included: age, gestational week, BMI, gestational weight gain, co-morbidity (hyperemesis, anaemia, urinary/reproductive infections, and constipation), parity, highest education level, living status, living accommodation, current job, fundal height, Figure 1. Conceptual framework
Figure 1. Conceptual framework
Physical activity Disability
Internal factors External factors
Aim a)
Aim b)
Physiological lower extremity oedema
abdominal circumference, foetal weight.
Variables selected as internal factors related to physiological lower extremity oedema were: age, gestational week, BMI (based on the height and pre- pregnancy weight), gestational weight gain (based on current weight and pre-pregnancy weight), co-morbidity (hyperemesis, anaemia, urinary/reproductive infections, constipation), parity, and foetal weight (based on fundal height and abdominal circumference).
Variables selected as external factors related to physiological lower extremity oedema were: highest level of education, living accommodation, and current job.
2 ) Clinical assessment
All assessments were done in the latent phase of the first stage of labour.
Measuring fundal height, waist circumference, limb circumferences, current swelling status, and all other evaluations were conducted by a trained researcher.
Each measurement (in cm) was done twice with only one tape. Fundal height is generally defined as the distance from the pubic bone to the top of the uterus.
Abdominal circumference was measured at the level of the umbilicus by the cross-over technique. Limb circumference was considered to be the circumference measurement of both lower extremities at 3 positions:
(1) foot/toe junctions – measured at the distal end of the foot, at the metatarsal-phalangeal joint; (2) ankles – measured medially and laterally above the malleolus where the diameter is smallest; and (3) 20 cm below the centre of the patella. The intraclass correlation coefficient (ICC) (1, 1) of limb circumference measurements in the pre-test was >0.9 at all positions.
Each circumference measurement was done twice with the same measuring tape. Current swelling status was considered the degree of swelling of both lower extremities at: ( 1) dorsum of the foot – 2 cm from the base of the middle toe; (2) medial malleolus; and (3) pretibial – 20 cm below the centre of the patella.
The right thumb was used to place about 50-60 mmHg of pressure on the above positions for a duration of 10 seconds at each site, then removed
7). To ensure stable power, calibration was performed before the real test began. First, the rater pressed on a pressure evaluator (Palm Q; Cape, Yokosuka, Japan). Next, another person checked the reading on the pressure evaluator and
ensured that the range was 50-60 mmHg (ICC (1, 1) = 0.865). Stable pressure was important for pressing and accurate evaluation, as well as to avoid skin damage.
The duration of pressure on the participant was measured with a stopwatch in every experiment.
3 ) Interventions for oedema: Women were interviewed about interventions by medical doctors or nurses to reduce oedema. They included advice (diet, left-side sleep, elevated legs, rest, skin care, exercise) and specific interventions (bandage, compression garment, massage, physiotherapy, water immersion).
4 ) Questionnaires
Two sets of questionnaires were administered: the WHODAS 2.0 12-item questionnaire and the PPAQ.
The WHODAS 2.0 12-item self-administered questionnaire is a generic measure. The instrument does not target a specific disease and captures the level of functioning difficulty in six domains ( 1 domain/2 items) of life: cognitive - understanding and communicating; mobility - moving and getting around;
self-care - attending to one’s hygiene and dressing;
life activities - domestic responsibilities; leisure and work participation - joining in community activities;
and getting along - interacting with other people. Each item is scored from 0 to 4 using a 5-point Likert scale (none, mild, moderate, severe, extreme, or cannot do)
6). The total score ranges from 0 to 48, and a high score indicates major daily living limitations. The WHODAS 2.0 was translated into the Vietnamese language by the investigators. The translation process entailed two phases: (1) forward translation, involving translation of the WHODAS 2.0 12 items from English to Vietnamese by a bilingual researcher; and ( 2) back-translation, involving two independent bilingual translators, both of whom majored in English teaching and translation.
Then, two researchers carefully compared the back-
translated version with the original English version
item-by-item to evaluate conceptual equivalence. The
measure has been used extensively across cultures,
including samples of pregnant women
8) 9). The
WHODAS-12 showed a moderate level of convergence
with a locally developed index of functioning among a
sample of pregnant women living in deprived conditions
in South Africa
9). Internal reliability (Cronbach’s
alpha) for the total pool of items was 0.89 in a study
of explosive anger among pregnant and post-partum
women in Timor-Leste
10). The WHODAS 2.0 12 items have been validated and demonstrated to have agreement with the WHODAS 36 for total score, and it was a good instrument for screening functioning and disability among postpartum women, with and without severe maternal morbidity
11).
The PPAQ is a widely used tool for the assessment and measurement of PA levels of pregnant women.
Individuals were interviewed to select the category of the time spent in activities including household/
caregiving, occupational, sports/exercise (i.e., “none”,
“less than 1/2 hour per day”, “1/2 to almost 1 hour per day”, “1 to almost 2 hours per day”, “2 to almost 3 hours per day”, “ 3 or more hours per day”). The PPAQ is divided into 3 activity domains: household/
caregiving, occupational, and sports/exercise. In addition, the PPAQ consists of 4 intensity domains:
sedentary (<1.5 METs), light activity (1.5-2.9 METs), moderate activity (3.0-5.9 METs), and vigorous activity (>6.0 METs)
12). The duration of time spent in each activity/day was converted to a daily duration score (based on Compendium)
12). The daily duration score was multiplied by 7 to get the weekly duration score.
This score was multiplied by its intensity value (based on Compendium)
12)to arrive at a measure of average weekly energy expenditure (MET-hr/wk), so that Total activity=sum of (duration*intensity) of all activities
12). More weekly energy expenditure is related to a higher PA level.
The PPAQ had 32 questions and had been translated to Vietnamese and validated. The ICC test-retest was 0.88 for total activity, and the analysis of validity showed a moderate correlation (p=0.02) between PPAQ total and step counts
13).
1 ) Data analyses
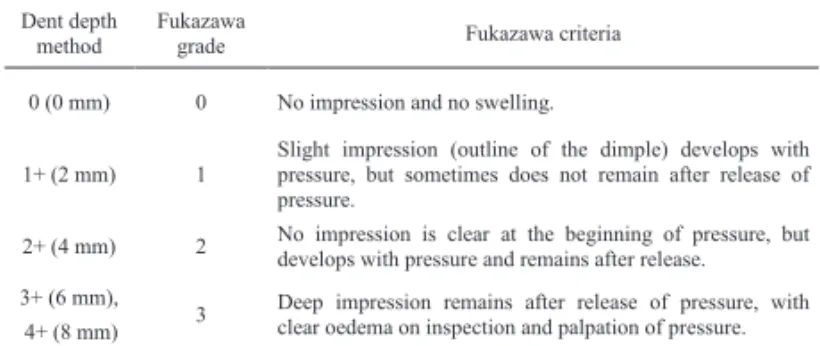
During data collection, oedema for each site was graded based on the Dent depth method. Pitting depths of 0, 2, 4, 6, or 8 mm were given grades of 0, 1+, 2+, 3+, or 4+, respectively
14). Although a pitting model was made to represent all depths of pitting for the rater to practise, accurately distinguishing among all depths, especially severe oedema (i.e., 3+ and 4+), was difficult using visual assessment. Additionally, Dent depth assessed oedema at each separate position without regard to general swelling status. Therefore, after data collection, the grades were converted from
the Dent depth method to those of the Fukazawa method
15), with grades from 0 to 3 (Table 1). The sum of scores from the three sites was used as the total oedema score for each leg. Oedema was defined as present if the woman had at least one leg showing a total score ≥2
15). The non-oedema group comprised women having both legs with total score <2. In the oedema group, the leg with the higher total score was chosen for subsequent analysis. If a woman had the same total score in each leg, the right leg was chosen for analysis.
Circumference at each position was considered the average of 2 measurements.
Pre-pregnancy BMI was estimated from self-reported pre-pregnancy weight and height, using the following equation:
Pre-pregnancy BMI was categorized according to the World Health Organization: under-weight, BMI< 18.5 kg/m
2; normal, 18.5≤ BMI< 25 kg/m
2; overweight, BMI
≥25 kg/㎡ .
Foetal weight calculation was estimated from fundal height (cm) and abdominal circumference (cm) by the Yakubova formula
16)The data are presented as means and standard deviations, medians and minimum-maximum, or frequencies and percentages. Associations between variables were analysed by the Mann-Whitney test or the independent t-test and the chi-squared test or Fisher’s exact test.
For aim a), logistic regression analysis was used to identify associated risk factors for oedema.
Table 1. Conversion from Dent depth method to Fukazawa method Table 1. Conversion from Dent depth method to Fukazawa method Dent depth
method Fukazawa
grade Fukazawa criteria
0 (0 mm) 0 No impression and no swelling.
1+ (2 mm) 1 Slight impression (outline of the dimple) develops with pressure, but sometimes does not remain after release of pressure.
2+ (4 mm) 2 No impression is clear at the beginning of pressure, but develops with pressure and remains after release.
3+ (6 mm),
3 Deep impression remains after release of pressure, with clear oedema on inspection and palpation of pressure.
4+ (8 mm)
Multicollinearity between all demographic variables was assessed before entering them into the logistic model. All variables were examined at the same time.
Estimates of odds ratios (ORs) with 95% confidence intervals (CIs) and P values are reported.
For aim b), the Mann-Whitney test was used to compare the WHODAS and PPAQ scores between the oedema and non-oedema groups. Spearman’s correlation analysis was used to analyse the relationships between WHODAS and PPAQ scores, and between oedema severity and WHODAS and PPAQ scores. The correlation coeffi cient r was considered as follows:
0.2 <│r│≤ 0.4 (weak); 0.4<│r│≤ 0.7 (moderate);
0.7 <│r│≤ 1.0 (strong)
IBM SPSS v.23 was used for statistical analysis, with p=0.05 as the level of signifi cance.
6 ) Ethical considerations
The recruited women were volunteers. The content and purpose of the study were explained to all women, and their written, informed consent was obtained. This study was approved by the Medical Ethics Committee of Kanazawa University (No. 772) and the Board of Directors of Haiphong Hospital of Obstetrics and Gynaecology.
Results
1. Characteristics of the pregnant women
A total of 368 women were eligible to participate.
Of these, 68 were excluded from the study based on the exclusion criteria: pathological diseases (n=13, pre-eclampsia: 12, venous insufficiency: 1); refusal (n=37); and foetal support system abnormality (n=18) (Figure 2). No women had unilateral leg oedema, since it was an exclusion criterion. Thus, 300 participants were evaluated in this study and categorised using the Fukazawa method
15), with oedema (total score ≥2) in 141 women and non-oedema (total score < 2) in 159 women. Table 2 shows the characteristics of the late pregnant women. There were signifi cant diff erences in parity, pre-pregnancy BMI, gestational weight gain in pregnancy, abdominal circumference, calculated foetal weight, and hyperemesis in pregnancy between the two groups.
2. Associated risk factors for physiological lower extremity oedema in late pregnancy
Logistic regression analysis showed that parity,
gestational weight gain in pregnancy, calculated foetal weight, and gestational week were risk factors for oedema (Table 3).
3. Characteristics of physiological lower extremity oedema
There were significant differences between the Figure ₂. Flow diagram of participants
Sum=0, 1 at both legs Sum=2 at least one leg
Figure 2. Flow diagram of participants Included women
(n=300) Admitted women
(n=368) Exclusion (n=68)
Pathological diseases: 13 Refusal: 37
Abnormal foetal support system: 18
Non-oedema group
(n=159) Oedema group
(n=141)
The sum of scores from the three sites was used as the total oedema score for each
legTable ₂: Characteristics of late pregnant women
Table 2: Characteristics of late pregnant women
Variables Non-oedema group (n=159)
n (%), median (min-max) Oedema group (n=141) n (%), median (min-max) P value
Age (years) 27 (18-42) 27 (18-45) 0.49a
Gestational week, 0.56b
38 44 (27.7) 43 (30.5)
39 40 (25.2) 43 (30.5)
40 58 (36.5) 45 (31.9)
41 16 (10.1) 10 (7.1)
42 1 (0.6) 0 (0.0)
Parity, 0.03
1 75 (47.2) 83 (58.9)
≥ 2 84 (52.8) 58 (41.1)
BMI pre-pregnancy, 0.03
Under weight (BMI<18.5) 40 (25.2) 20 (14.2)
Normal (18.5≤BMI<25) 113 (71) 110 (78)
Obesity (BMI≥25) 6 (3.8) 11 (7.8)
Gain weight in pregnancy (kg) 13 (5-25) 16 (5-28) <0.01a
Fundal height (cm) 31 (26-34) 31 (27-35) 0.26a
Abdominal circumference (cm) 95.5 (86-110) 99 (88-114) <0.01a
Foetal weight (g) 3162.5 (2850-3575) 3250 (2950-3675) <0.01a
Co-morbidity in this pregnancy
Hyperemesis, <0.01
No 48 (30.2) 66 (46.8)
Yes 111 (69.8) 75 (53.2)
Anemia, 0.15
No 129 (81.1) 123 (87.2)
Yes 30 (18.9) 18 (12.8)
Urinary/Reproductive infections, 0.99
No 78 (49.1) 69 (48.9)
Yes 81 (50.9) 72 (51.1)
Constipation, 0.47
No 79 (49.7) 76 (53.9)
Yes 80 (50.3) 65 (46.1)
Table 2: Characteristics of late pregnant women (continue)
Variables Non-oedema group (n=159)
n (%), median (min-max) Oedema group (n=141) n (%), median (min-max) P value
Living status, 0.76
Nuclear family 56 (35.2) 51 (36.2)
Extended family 103 (64.8) 90 (63.8)
Living accommodation, 0.21
Owner 142 (89.3) 119 (84.4)
Rent 17 (10.7) 22 (15.6)
Current job, 0.5
Housework 40 (25.1) 35 (24.8)
Worker 54 (34.0) 57 (40.4)
Office 65 (40.9) 49 (34.8)
Highest education, 0.29b
School diploma 63 (39.6) 71 (50.4)
Technical college 36 (22.6) 25 (17.7)
University 56 (35.2) 41 (29.1)
Master 4 (2.6) 4 (2.8)
BMI, Body mass index based on WHO standard criteria.
Data are presented as median (min-max), frequency (percentage). a: Man-Whitney; b: Fisher exact; others: Chi-square Gestational week: Based on last menstrual period or estimated due date in medical records at the first trimester Parity: Number of pregnancies ≥28 weeks
Hyperemesis: Persistent nausea or vomiting at early pregnancy
Constipation: Having less than three bowel motions per week with stools that are hard and difficult to pass
oedema and non-oedema groups in lower limb circumferences at 3 positions, grade of swelling at 3 positions, oedema severity, numbness, tingling, and heaviness (Table 4).
The oedema group received more interventions than the non-oedema group, but only 37.6% of women with oedema were identified and given interventions. All interventions were advice at any oedema severity (Table
5).
4. Disability and physical activity of women in late pregnancy with physiological lower extremity oedema Table 6 presents the WHODAS and PPAQ scores in the oedema and non-oedema groups. The oedema group had higher scores overall and in the domains of mobility, participation, getting along, and self-care of the WHODAS questionnaire.
Table 7 presents the correlations between WHODAS Table 3. Logistic regression analysis: risk factors for physiological
lower limb oedema in late pregnancy
Table 3. Logistic regression analysis: risk factors for physiological lower limb oedema in late pregnancy
Variables Adjusted OR 95% CI P value
BMI
Underweight (BMI<18.5) 1
Normal (18.5≤BMI<25) 0.25 0.05-1.19 0.08
Overweight (BMI≥25) 0.41 0.11-1.51 0.18
Gestational weight gain (kg) 1.19 1.1-1.29 <0.01
Hyperemesis in pregnancy
No 1
Yes 1.26 0.73-2.16 0.41
Anemia in pregnancy
No 1
Yes 1.42 0.69-2.92 0.34
Constipation in pregnancy
No 1
Yes 1.14 0.67-1.96 0.63
Parity
1 1
≥2 2.18 1.18-4.03 0.01
Gestational week
Group 1 1
Group 2 2.61 1.04-6.59 0.04
Living status
Nuclear family 1
Extended family 1.17 0.67-2.05 0.58
Current job
Housework 1
Worker 1.08 0.55-2.12 0.83
Office 1.62 0.88-2.99 0.12
Foetal weight (g) 1.002 1.000-1.005 0.05
Group 1: Gestational week of 38, 39, 40 week Group 2: Gestational week of 41, 42 week
Table 4. Characteristics of oedema
Table 4. Characteristics of oedema
Variables Non-oedema group (n=159)
n (%), mean ± SD Oedema group (n=141) n (%), mean ± SD P value Circumference (cm)
Foot 21.7 ± 1.3 22.9 ± 1.3 <0.01a
Ankle 20.1 ± 1.4 22.3 ± 1.3 <0.01a
Pretibial edge 30.7 ± 2.7 33.9 ± 2.7 <0.01a
Grade of swelling
Foot, <0.01b
Grade 0 157 (98.7) 49 (34.8)
Grade 1 2 (1.3) 75 (53.2)
Grade 2 0 (0.0) 17 (12.0)
Ankle, <0.01b
Grade 0 159 (100.0) 8 (5.7)
Grade 1 0 (0.0) 75 (53.2)
Grade 2 0 (0.0) 58 (41.1)
Pretibial edge, <0.01b
Grade 0 48 (30.2) 2 (1.4)
Grade 1 111 (69.8) 136 (96.5)
Grade 2 0 (0.0) 3 (2.1)
Severity (sum), <0.01b
0 46 (28.9) 0 (0.0)
1 113 (71.1) 0 (0.0)
2 0 (0.0) 45 (31.9)
3 0 (0.0) 45 (31.9)
4 0 (0.0) 39 (27.7)
5 0 (0.0) 11 (7.8)
6 0 (0.0) 1 (0.7)
7 0 (0.0) 0 (0.0)
8 0 (0.0) 0 (0.0)
9 0 (0.0) 0 (0.0)
Table 4. Characteristics of oedema (continue)
Variables Non-oedema group (n=159)
n (%), mean ± SD Oedema group (n=141) n (%), mean ± SD P value
Feeling of pain in lower extremity, 0.29
No 149 (93.7) 127 (90.1)
Yes 10 (6.3) 14 (9.9)
Feeling of numbness in lower extremity, <0.01
No 135 (84.9) 72 (51.1)
Yes 24 (15.1) 69 (48.9)
Feeling of tingling in lower extremity, <0.01b
No 156 (98.1) 129 (91.5)
Yes 3 (1.9) 12 (8.5)
Feeling of weakness in lower extremity, 0.1b
No 159 (100) 138 (97.9)
Yes 0 (0) 3 (2.1)
Feeling of heaviness in lower extremity, <0.01
No 153 (96.2) 54 (38.3)
Yes 6 (3.8) 87 (61.7)
Data are presented as mean ± SD, frequency (percentage).
a: t independent, b: Fisher exact, others: Chi-square
Table 5. Interventions for oedema
Table 5. Interventions for oedema
Categories Non-oedema group (n=159) Oedema group (n=141) P value
No intervention 156/159 (98.1%) 88/141 (62.4%) 0.01
Interventions 3/159 (1.9%) 53/141 (37.6%)
Diet advice 2/159 (1.3%) 47/141 (33.3%) <0.01
Elevated leg advice 3/159 (1.9%) 37/141 (26.2%) <0.01
Left-side sleep advice 0/159 (0.0%) 27/141 (19.1%) <0.01
Rest advice 0/159 (0.0%) 5/141 (3.5%) 0.02a
Skin care advice 0/159 (0.0%) 0/141 (0.0%) N.A
Massage 0/159 (0.0%) 0/141 (0.0%) N.A
Physiotherapy 0/159 (0.0%) 0/141 (0.0%) N.A
Exercise advice 0/159 (0.0%) 0/141 (0.0%) N.A
Compression garment 0/159 (0.0%) 0/141 (0.0%) N.A
Bandage 0/159 (0.0%) 0/141 (0.0%) N.A
Water immersion 0/159 (0.0%) 0/141 (0.0%) N.A
Note: a women can get more than one intervention N.A: Not applicable; a: Fisher exact; others: Chi-square
Table 6. WHODAS scores and PPAQ scores in the oedema and non- oedema groups
Table 6. WHODAS scores and PPAQ scores in the oedema and non-oedema groups Non-oedema group
(n=159) Oedema group
(n=141) P value WHODAS
Total score 14 (5-24) 15 (6-25) <0.01
Mobility 3 (1-7) 4 (1-8) <0.01
Life activities 3 (0-5) 3 (1-5) 0.32
Cognition 2 (0-5) 2 (0-3) 0.93
Participation 3 (1-6) 4 (1-6) <0.01
Getting along 1 (0-4) 2 (0-4) <0.01
Self-care 2 (0-5) 2 (0-5) 0.02
PPAQ (MET-hr/week)
Total activity 130.3 (51.5-225) 129.3 (29.4-211.4) 0.33 Total activity (light and above) 76.3 (15.9-173.2) 70.2 (8.4-188.6) 0.18 By type
Household 57.4 (4.0-146.1) 49.7 (8.4-124.3) 0.17
Work 71.05 (0-110.6) 71.05 (0-110.6) 0.63
Exercise 0 (0-9.6) 0 (0-11) 0.93
By intensity
Sedentary 54.6 (1.8-102.2) 54.6 (0-109.2) 0.71
Light activities 71.4 (7.9-162.4) 63.35 (8.4-173.6) 0.16
Moderate activities 0.88 (0-63) 0 (0-47.3) 0.56
Data are presented as median (min-max). Man-Whitney.
Vigorous activities: not found in both groups
scores and PPAQ scores. There were generally weak negative correlations between WHODAS (total score, mobility, life activities, self-care) scores and domains of exercise with moderate activities of PPAQ in the oedema group. There was no correlation between them in the non-oedema group.
Table 8 presents correlations of the severity of oedema with WHODAS and PPAQ scores. There were weak positive correlations between severity of oedema and WHODAS (total score, cognition, and participation) scores: women who had more severe swelling had a higher WHODAS score.
Discussion
This study had two main findings regarding physiological lower extremity oedema in pregnancy:
first, gestational week, parity, gestational weight gain
in pregnancy, and foetal weight were risk factors for physiological lower extremity oedema in late pregnancy;
and second, women with physiological oedema had more disability than women without oedema.
1. Risk factors associated with physiological lower extremity oedema in late pregnancy
This research identified 3 new factors besides gestational week: parity, gestational weight gain in pregnancy, and foetal weight.
The present research showed that women in the 41
stand 42
ndgestational weeks had a higher risk of oedema than women in the 38
th, 39
th, and 40
thgestational weeks.
This is presumably because the longer the foetus remains in the uterus, the bigger it grows, and the more pressure it puts on the vena cava. Most previous studies also confirmed the role of gestational weeks in the risk of physiological oedema. Gardenghi et al.
3)showed that the prevalence of lower limb oedema in healthy primigravidae in the 1
st, 2
nd, and 3
rdtrimesters was 0%, 20%, and 55%, respectively. Lebech et al.
4)also stated that the weekly prevalences of lower limb oedema in normal pregnancy in a longitudinal study in weeks 31 and 42 were 20% and 60%, respectively.
Although 38-42 gestational weeks are full-term pregnancies, from 40 weeks, women should get frequent examinations and be very carefully monitored. Overdue babies are large, which puts much pressure on the vena cava, causing oedema, which also makes it difficult to have a normal labour. Prolonged pregnancy puts both mother and baby at increased risk for complications.
Most pregnant women will be induced by 42 weeks or earlier if the mother or baby has any problems.
Parity is also a risk factor for oedema. Parity ≥2 is associated with a higher risk of oedema than parity=1.
This could be explained by the fact that, in pregnancy, the vena cava and lower limb venous system experience pressure from the foetus. This damages the venous system, which can lead to easier swelling in later pregnancies. Multiparous status is not only associated with a high risk of oedema due to venous insufficiency, but also a high risk of many dangerous maternal complications.
Excess weight gain was likely to be due to oedema.
However, it cannot be interpreted as a causal relationship because the study was observational. It could be that woman who had swelling in pregnancy Table 7. Correlations between WHODAS scores and PPAQ scores in
the oedema and non-oedema groups
Table 7. Correlations between WHODAS scores and PPAQ scores in the oedema and non-oedema groups WHODAS
Total score Mobility Life activities Cognition Participation Getting along Self-care Oedema group (n=141)
PPAQ
Total activity -0.02 -0.02 0.02 -0.06 0.12 -0.01 -0.003
By type
Household/caregiving -0.05 0.06 -0.1 -0.17* 0.04 -0.03 -0.1
Occupational 0.05 -0.12 0.08 0.07 0.17* 0.007 0.06
Sport/exercise -0.3** -0.28** -0.21* -0.14 -0.16 -0.15 -0.2*
By intensity
Sedentary 0.03 0.07 0.07 0.001 0.08 -0.16 0.13
Light activities -0.02 -0.02 -0.04 -0.09 0.12 -0.04 -0.08
Moderate activities -0.28** -0.32** -0.17* -0.18* -0.16 -0.05 -0.23**
Non-oedema group (n=159) PPAQ
Total activity -0.03 0.03 -0.001 -0.15 0.07 0.003 0.002
By type
Household/caregiving 0.04 0.08 -0.02 -0.09 0.1 0.12 -0.1
Occupational -0.14 -0.1 0.01 -0.15 -0.06 -0.13 0.06
Sport/exercise -0.08 -0.12 -0.12 0.08 -0.13 0.02 -0.03
By intensity
Sedentary 0.08 0.1 0.006 -0.02 0.1 -0.03 0.1
Light activities -0.06 -0.03 0.03 -0.15 0.05 0.03 -0.05
Moderate activities -0.1 -0.12 -0.14 0.04 -0.14 0.03 -0.07
Spearman correlation coefficient. *p < .05. **p < .01.
Table 8. Correlations between severity of oedema and WHODAS scores and PPAQ scores
Table 8. Correlations between severity of oedema and WHODAS scores and PPAQ scores Severity of oedema
WHODAS
Total score 0.29**
Mobility 0.16
Life activities 0.17*
Cognition 0.23**
Participation 0.27**
Getting along 0.19*
Self-care 0.06
PPAQ
Total activity -0.17*
By type
Household/caregiving -0.07
Occupational -0.1
Sport/exercise -0.22 By intensity
Sedentary -0.1
Light activities -0.04 Moderate activities -0.04 Spearman correlation coefficient. *p < .05. **p < .01
and increased water retention gained more weight than women without swelling.
Foetal weight is also a factor for oedema. At the end of pregnancy, the weight of the foetus is quite different among pregnant women even in the same gestational week. A heavier foetus puts more pressure on the vena cava, and there is likely to be a higher risk of oedema.
We suggest control of weight during pregnancy not only for the mother, but also for the foetus. A big foetus may be more likely to cause a difficult labour, resulting in caesarean delivery. “Eating for two” or “prefer a heavy baby at delivery” was the point of view of previous generations, but it is dangerous, because women who exceed their recommended weight gain can develop health problems, such as backaches, varicose veins, and gestational diabetes.
2. Disability and physical activity of women with physiological lower extremity oedema
1 ) There was more disability but the same PA level among women in late pregnancy with oedema compared to women without oedema. Women with oedema have more difficulty in daily life with mobility, getting along, participation, and self-care. This could be due to the change of appearance with severe oedema and the feeling of heaviness, tingling, and numbness in the lower extremities. To the best of our knowledge, this is the first study to evaluate the effect of oedema on daily life of pregnant women. Although there were no differences in PA between the oedema and non- oedema groups, total activity of Vietnamese women was generally lower than in some other countries, such as Poland (168.8 MET-hr/wk)
17)and France (158.46 MET-hr/wk)
18). The total activity (light and above) were low, as in China (62.9 MET-hr/wk)
19)and a previous study in Vietnam (71.4 MET-hr/wk)
13). In particular, most women did not have exercise, compared to Poland (11 MET-hr/wk) and France (3.4 MET-hr/
wk). According to the Clinical Practice Guidelines for Exercise during pregnancy, women should achieve 8.5 MET-hr/wk to meet the recommendation
20)(2003). New recommendations suggest that women increase the amount of PA expenditure to at least 16 MET-hr/wk. To achieve the minimum expenditure of 16 MET hours per week, one could walk 3.2 km per hour for 6.4 hours per week (2.5 METs, light intensity), or preferably exercise on a stationary bicycle for 2.7 hours per week (6.0–7.0
METs, more vigorous intensity)
21)(2011).
2 ) There were weak negative correlations between WHODAS and PPAQ scores. Surprisingly, more disability was associated with reduction of exercise and moderate activities.
3 ) There were weak correlations between severity of oedema and the WHODAS. More severe oedema was related to more disability.
These findings could have two explanations. First, this is physiological oedema, a bilateral, not severe swelling, that is not acutely dangerous, so it causes an inappreciable effect on PA. Second, Vietnamese women had generally low levels of PA and exercise, and they themselves were inactive in pregnancy because of culture, as in China, since >60% of the women in this study lived in an extended family, so that, in pregnancy, their mother-in-law and other people would do their housework for them. In addition, exercise was not recommended in pregnancy even if it was thought to have negative effects on the foetus. Hence, the impact of oedema on PA could not actually be evaluated.
Several suggestions flow from these findings.
Recommendations for PA, especially exercise in pregnancy, should be immediately implemented by health staff. Regular prenatal exercise was reported to have a favourable effect on maternal health, reduce the risk of excessive gestational weight gain
22), prevent hypertensive disorders
23), enhance psychological well- being
24), and improve physical fitness
25). With the increased disability, with a positive relationship between swelling and disability in women with oedema, we can conclude that interventions to reduce oedema are necessary. In this study, only 37.6% of patients with oedema received interventions, and all of them were advice, regardless of swelling severity. Other oedema treatments for pregnant women, including compression, bandages, water immersion, and massage, were not observed in this research. A further study needs to be done in this hospital to evaluate whether verbal interventions have sufficient effects as oedema treatment.
Limitations
This study had some limitations. This study involved
only a single site. A multisite design would provide
more reliable results, which may be more broadly
applicable to general populations. Additionally, all participants were in late pregnancy, so that risk factors and results of the WHODAS scores and PPAQ scores could not be generalised to all stages of pregnancy.
This study used a cross-sectional design, so it cannot be interpreted to show a causal relationship between oedema and risk factors or between oedema and disability and PA. For the associations between oedema and disability and PA, univariate analysis was used, which cannot control confounding. Foetal weight was calculated based on the formula of fundal height and abdominal circumference, but this formula may be biased due to not including the status of the amniotic sac (whether it is ruptured).
Conclusion
Gestational week, gestational weight gain, parity and foetal weight were shown to be risk factors associated with physiological oedema in pregnancy. Women in late pregnancy with physiological lower extremity oedema
were more likely to have disability. These results suggest that it is necessary to supply more advice, such as dietary salt restriction, leg elevation, and left- side sleeping, and specific treatments to reduce lower extremity oedema.
Acknowledgments
The authors are grateful to and sincerely thank the management board and health staff of Haiphong Hospital of Obstetrics and Gynaecology, with special thanks to all of the pregnant women who participated in this study. The authors also appreciate the support of Ms. Misako Dai and Ms. Kanae Mukai from the Department of Clinical Nursing, Institute of Medical, Pharmaceutical and Health Science, Kanazawa University, for this research.
Conflicts of interest None.
References
1 ) Cunningham FJ, Gant NF, Leveno KJ, et al.(2001):
Williams Obstetrics (21st edition), 174, McGraw- Hill, New York
2 ) Reeder SJ, Martin LL (1987): Maternity nursing (Sixteenth Edition), 413-451, Lippincott, Philadenphia
3 ) Gardenghi LA, Dezotti NR, Dalio MB, et al. (2017):
Gestational lower limb edema and venous reflux in healthy primigravidae, Int Angiol, 36 (6), 569–573 4 ) Lebech M, Hansen M, Knudsen A (1996):
Headache, fatigue and edema of the lower limb during the third trimester of normal pregnancy, Ugeskr Laeger, 158 (47), 6778-6780 (Article in Danish with English abstract)
5 ) Fahad T, Sana. S (2015): Frequency of lower extremity edema during third trimester of pregnancy, S Asian J Med Sci, 1 (2), 41-43
6 ) Üstün TB, Kosstanjsek N, Chatterji S, et al. (2010):
Measuring Health and Disability, Manual for WHO Disability Assessment Schedule WHODAS 2.0, 4-90, WHO Press, World Health Organization, Geneva
7 ) Sato A, Dai M, Fujimoto Y, et al. (2015): A cross- sectional study of elderly individuals with oedema and skin injuries in long-term care facilities.
J Tsuruma Health Science Society, Kanazawa University, 39 (2), 63-73
8 ) Bindt C, Appiah-Poku J, Te Bonle M, et al. (2012):
Antepartum depression and anxiety associated with disability in African women: Cross-Sectional Results from the CDS Study in Ghana and Côte d’Ivoire, PLoS ONE 7 (10), e48396
9 ) Schneider M, Baron E, Davies T, et al. (2015):
Making assessment locally relevant: measuring functioning for maternal depression in Khayelitsha, Cape Town, Soc Psychiatry Epidemiol, 50, 797-806 10) Silove D, Rees S (2015): Prevalence and correlates
of explosive anger among pregnant and post- partum women in post-conflict Timor-Leste, BJPsych Open, 1 (01), 34–41
11) Silveira C, Souza RT, Costa ML, et al. (2018):
Validation of the WHO Disability Assessment Schedule (WHODAS 2.0) 12-item tool against the 36-item version for measuring functioning and disability associated with pregnancy and history of severe maternal morbidity, Int J Gynaecol Obstet, 141, 39–47
12) Chasan TL, Schmidt MD, Roberts DE, et al.
(2004): Development and validation of a pregnancy physical activity questionnaire, Med Sci Sports Exerc, 36 (10), 1750–1760
13) Ota E, Haruna M, Yanai H et al. (2008): Reliability
and validity of the Vietnamese version of the
pregnancy physical activity questionnaire (PPAQ),
Southeast Asian J Trop Med Public Health, 39 (3),
562–570
14) Bobak IM, Jensen MD, Zalar MK (1989): Maternity and Gynaecology Care, the Nurse and the Family ( 4th edition), pp 701, The C.V Mosby Company, California
15) Fukazawa R, Koyama S, Kanetaka H, et al. (2013):
Leg edema detected on comprehensive geriatric assessment for elderly outpatients and its associated risk factors, Nihon Ronen Igakkai Zasshi, 50 (3), 384-391 (in Japanese with English abstract)
16) Korda I, Obstetrics and Gyneacology, School of Medicine, Western Sydney University, Parramatta, 2150, Australia: Organization of obstetric care.
Physiological duration of pregnancy, labor and post-natal period. https://www.slideplayer.com/
slide/7806185/ (assessed March 24th 2019)
17) Krzepota J, Sadowska D, Biernat E (2018):
Relationships between physical activity and quality of life in pregnant women in the second and third trimester, Int J Environ Res Public Health, 15, 2745 18) Waerdena J, Nakamuraa A, Pryora L, et al. (2019):
Domain-specific physical activity and sedentary behavior during pregnancy and postpartum depression risk in the French EDEN and ELFE cohorts, Prev Med, 121, 33–39
19) Xiang M, Konishi M, Hu H, et al. (2016): Reliability and validity of a Chinese-translated version of a
pregnancy physical activity questionnaire, Matern child Health J 20, 1940-1947
20) Davies GA, Wolfe LA, Mottola MF, et al. (2003):
Joint SOGC/CSEP clinical practice guideline:
exercise in pregnancy and the postpartum period, Can J Appl Physiol 28 (3), 330-341
21) Zavorsky GS, Longo LD (2011): Exercise guidelines in pregnancy: new perspectives. Sports Med, 41 (5), 345–360
22) Muktabhant B, Theresa L, Pisake L, et al. (2015):
Diet or exercise, or both, for preventing excessive weight gain in pregnancy. Cochrane Database Syst Rev 6, 15
23) Magro-Malosso ER, Saccone G, Di Tommaso M, et al. (2017): Exercise during pregnancy and risk of gestational hypertensive disorders: a systematic review and meta-analysis. Acta Obstet Gynecol Scand, 96 (8), 921–931
24) Haakstad LA, Torset B, Bø K (2016): What is the effect of regular group exercise on maternal psychological outcomes and common pregnancy complaints? An assessor blinded RCT, Midwifery 32, 81–86
25) Kramer MS, McDonald SW (2006): Aerobic
exercise for women during pregnancy. Cochrane
Database, Syst Rev, 19
ベトナムにおける下肢浮腫を有する妊娠後期妊婦の生活機能障害と身体活動:
横断的相関研究
ド ティ ラン アイン
1), 2),大桑 麻由美
3)*,須釜 淳子
4)要 旨