Chemical characteristics of R chondrites:
Implications for nebular and parent body processes
Applicant: Rahat Khan Supervisor: Mitsuru Ebihara
Dissertation for a Ph. D. Degree
Graduate School of Science and Engineering Tokyo Metropolitan University
2015
~ JC ~ R :::J / ~ 7-1 I' O){t~~~~~: ti!~i*ff~PlwHiO)ii~l~ c
O)~jf (~)t)
-~i8~~
;4J fc f~ -
.± ~ /ZJ
~ A Jrr;
It )fJ ~
~ A )"-3\f ?t-*~
~ A ::: 3r tr~
DISSERTATION FOR A DEGREE OFDOCTOR OF PHILOSOPHY IN SCIENCE
TOKYO METROPOLITAN UNIVERSITY
TITLE : Chemical characteristics of R chondrites: Implications for nebular and parent body processes
AUTHOR : Rabat Khan
EXAMINED BY Examiner in chief Examiner
Examiner Examiner
~t,l:~0~
µ / J y -
~ - (Y»ZfA
~ ~ W 4
QUALIFIED BY THE GRADUATE SCHOOL OF SCIENCE AND ENGINEERING
TOKYO METROPOLITAN UNIVERSITY
Dean
Date
I
Contents
Page #
Acknowledgments III
Abstract IV
Cahapter-1: Introduction
1.1 Meteorites 2
1.2 Classification of meteorites 2
1.3 R chondrites 6
1.4 R chondrites constituents 7
1.5 Mineralogy of R chondrites 9
1.6 Textural characteristics of R chondrites 11
1.7 Shock effect 11
1.8 R chondrite chronology 12
1.9 Oxygen isotopic composition 12
1.10 Bulk chemical composition 14
1.11 Motivation of this work 14
1.12 Objective of this work 17
Chapter-2: Experimental
2.1 Sample information 19
2.2 Experimental techniques 21
2.3 Instrumental neutron activation analysis 21 2.4 Inductively coupled plasma mass spectrometry 26
2.4.1 Internal calibration method 26
2.4.2 Isotope dilution technique 32
2.5 Inductively coupled plasma atomic emission spectrometry 52
II
Chapter-3: Results
3.1 Major, Minor and Trace elements abundances: INAA data 55 3.2 Detailed abundances of REEs, Th and U: ICP-MS data 60
3.3 Phosphorus abundance: ICP-AES data 64
3.4 Volatile elements abundances: MS-ID 66
Chapter-4: Discussion
4.1 Comparison with literature data and possible terrestrial weathering
74 4.2 Taxonomic study: A bulk chemical composition approach 79
4.3 Nebular processes 80
4.3.1 Oxidation 80
4.3.2 HREE-LREE fractionation 82
4.3.3 Thorium-Uranium fractionation 83
4.4 Systematic variation of volatile elements in R chondrites 85 4.4.1 Volatile elements in R chondrites: comparison with
ordinary chondrites
89
4.4.2 Condensation model 94
4.4.3 Metamorphic model 99
4.4.4 Impact and the parent body of R chondrites 101
Chapter-5: Conclusion 102
References 105
III
Acknowledgments
I would like to express my humble gratitude to my supervisor Prof. Mitsuru Ebihara for his invaluable guidance, advice and encouragement for this research. Without his philosophical directions this research could not be conclusive. I am very much thankful to Assistant Prof. Dr. Naoki Shirai for his continuous training on analytical techniques and invaluable advises regarding the cosmochemistry as well as the Japanese life. Associate Prof. Dr. Yasuji Oura is gratefully acknowledged for his kind helps during the tenure of my PhD work.
I thank Dr. Akira Yamaguchi of the National Institute of Polar Research (NIPR, Japan) and the curator of Johnson Space Center, NASA (USA) for kindly providing me the meteoritic samples. I am grateful to Dr. Shun Sekimoto of Kyoto University Research Reactor Institute for helping me to irradiate my samples. I am also thankful to Mr. Kazuya Kumagai for his technical assistance for the ICP-AES experiment.
I am grateful to many people who have helped me over the years, particularly the
members of Cosmochemistry laboratory of Tokyo Metropolitan University. This work is
partially supported by Asian Human Resources Fund defrayed by the Tokyo metropolitan
government, Japan.
IV
Abstract
To study the compositional trends associated with their systematic variation with petrologic grade and their fractionation, 41 elements (Na, Mg, Al, P, Ca, Sc, V, Cr, Mn, Fe, Co, Ni, Zn, As, Se, Br, Cd, In, Sb, La, Ce, Pr, Nd, Sm, Eu, Gd, Tb, Dy, Ho, Er, Tm, Yb, Lu, Os, Ir, Au Tl, Pb, Bi, Th and U) have been determined in 15 R chondrites (PRE 95411, ALH 85151, Y 793575, Y 983270, A 881988, MIL 07440, LAP 03639, Y 983720, Y 983097, LAP 04840, MIL 11207, Y 980702, Y 980703, LAP 02238, PCA 91002), covering all petrologic types. For the determination of volatile elements (Zn, Pb, Tl, In and Cd), very precise isotope dilution technique coupled with ICP-MS was used followed by solvent extraction and anion exchange column chromatography. Bi was determined by using
208
Pb/
209Bi ratio. Detailed abundances of rare earth elements (REEs), Th and U were determined by ICP-MS using internal calibration method.
149Samarium spike was used for recovery calculation. In ICP-MS experiments, necessary isobaric and oxide interferences were corrected. Phosphorus was determined by ICP-AES using Be as internal standard.
Other elemental abundances were determined by instrumental neutron activation analysis using a research reactor of Kyoto University Research Reactor Institute (KURRI) and the gamma-counting facilities of KURRI and TMU. Accuracy and precision of all analytical data have been ensured by analyzing the Smithsonian Allende powder repeatedly and comparing their abundances with the literature values.
CI-normalized volatile elements abundances (Pb, Bi, Tl, In and Cd) in R chondrites
are decreasing with the increasing degree of metamorphism, excluding for the highly
weathered MIL 11207.8 and Y 793575.44. Lead abundances in R chondrites vary from
0.33×CI to 0.64×CI. With a similar trend, Bi (0.15-0.63×CI), In (0.15-0.56×CI), Tl (0.02-
0.79×CI) and Cd (0.03-0.81×CI) also change among the petrologic suite of R chondrites of
this study. Distinguishing the petrologic type 3 from petrologic type 4 is difficult – only Tl
can do so. Similarly, distinguishing the petrologic type 4 from 5/6 is also difficult – only Bi
can separate these petrologic types. But petrologic type 3 and 5/6 can be easily
distinguished by the CI-normalized volatile elements abundances. For unequilibrated
chondrites, CI-normalized Bi, Tl, In and Cd abundances in R chondrites are within the
range of ordinary chondrites. But in higher metamorphic grade, CI normalized Bi, Tl, In
and Cd abundances in R chondrites are generally higher than those of H, L and LL
chondrites with a few exceptions. The higher abundances of volatile elements in
V
equilibrated R chondrites are more prominent for Bi, In and Cd. For Tl, the trend of higher volatile elements abundances in R chondrites is also noticeable (especially for petrologic type 6), but somehow less conspicuous than Bi, In and Cd. For the systematic variation of volatile elements in R chondrites, a plausible explanation can be given; - high temperature early condensates were more depleted in volatile elements whereas low temperature later condensates were comparatively enriched with the volatile elements. If nebular condensation and accretion occurred simultaneously, the high temperature condensates were placed in the inner portion of the parent body followed by the low temperature condensates sequentially at the outer portion of the parent body. If R chondrite parent body possesses the onion-shell model, then the metamorphic heating caused the higher degree of recrystallization at the inner portion compared with that of outer portion. Impact can be responsible to convert the onion-shell parent body to rubble-pile type parent body where the different petrologic types are randomly distributed over the parent body.
CI-normalized detailed abundances of REEs in R chondrites shows a faint enrichment of heavy REEs compared with those of light REEs. REEs abundances vary from 1.2×CI to 1.5×CI. Nebular process can be responsible for such small HREE-LREE fractionation in R chondrites. To explain the nebular process in R chondrites, an analogically well explained fractionated pattern of REEs, Th and U abundances in Allende meteorite can be considered.
In Allende, HREEs are depleted compared with LREEs. According to condensation
calculation, high temperature early condensates (e.g., perovskite, hibonite, corundum etc.)
enriched with refractory HREEs could have been removed from the nebular gas, making
the remaining gas enriched with less refractory LREEs. It is likely that the Allende parent
body must have formed from such later condensates of the remaining gas. In R chondrites,
the inclination of CI-normalized REE pattern is opposite to the Allende pattern (except
positive Tm anomaly). A simple interpretation is that R chondrites formed in the nebula
where early condensates were relatively abundant. Unlike the REE fractionation pattern,
Th-U fractionation patterns are the same both in R chondrites and in Allende. In the seven
replicate measurements of Allende powder, Th/U ratio is 4.10 ± 0.20 whereas in R
chondrites, Th/U ratio is 3.81 ± 0.13. A subtle positive Ce anomaly (5.4 ± 1.5 %) is
observed in CI-normalized REE abundance pattern of R chondrites. Phosphorus
abundances in R chondrites are very close to cosmic abundance (0.9-1.1×CI). Phosphorus
abundances show anti-correlation with La, Ce, Er and Yb.
VI
In our INAA study, CI, Cr-normalized lithophile abundance pattern in R chondrites are almost flat and are comparable with those of ordinary chondrites. Mean CI-normalized Na and Mn abundances are 1.32 ± 0.07 and 1.21 ± 0.04, respectively, which are comparable with those of ordinary chondrites but much higher than those of carbonaceous and enstatite chondrites. However, CI, Cr-normalized siderophile abundance pattern in R chondrites are intermediate between H and L chondrites. A mean iron content in R chondrites is 24.6 ± 0.7 (%, 1σ, n=15, this study) whereas the mean iron contents in H, L and LL are 27.1 ± 0.7 (%, 1σ, n=22), 21.6 ± 0.5 (%, 1σ, n=20) and 18.4 ± 0.4 (%, 1σ, n=16), respectively. Bulk Ir contents in R chondrites also show the same trend as iron. CI-normalized Ni/Co ratios (~0.9) in R chondrites are comparable with those of ordinary chondrites. Moderately volatile elements, Zn and Se in R chondrites are more abundant than those in ordinary chondrites. Both of them share the same nebular condensation temperature, but they are fractionated. Enstatite chondrites are the most reduced chondritic meteorites whose Se abundances are comparable with those in R chondrite. But Zn abundances in R chondrite are remarkably higher than those in EL chondrite and comparable with CM chondrite abundances. Higher stability of ZnO in oxidized condition can be a plausible explanation for this Zn enrichment.
This study characterizes the R chondrites depending on their bulk chemical
compositions. And the bulk chemical composition is implemented to reveal the nebular and
the parent body processes.
1
Chapter-1
Introduction
2 1.1 Meteorites
Our solar system formed ~4.6 billion years ago from the collapse of a dense core inside an interstellar molecular cloud (Trieloff et al., 2003). The subsequent formation of solid bodies took place rapidly. The first stages of planetary accretion in the early solar system produced small bodies, or `planetesimals`, of rock and ice. Most of these first-born were swallowed up by the present-day planets as they grew, but some survived as asteroids, orbiting between Mars and Jupiter where no large planet formed to consume them. These asteroids suffer continuing collisions, and rocks from their interiors may find their way to the earth as meteorite (wood, 2003). The period of <10 milllion years over which planetesimals were assembled can be investigated through the study of meteorites (Allègre et al., 1995).
1.2 Classification of meteorites
1.2.1 Primary characteristics: Chemical composition
Meteorites are broadly classified into two classes – Chondrites and Nonchondrites.
Chondrites are more pristine in character whereas nonchondrites are less pristine and differentiated. Using bulk chemical compositions, chondrites are divided into clans and subdivided into groups, identified by a letter or combination of letters. Chondrites are of three clans – Carbonaceous, Ordinary and Enstatite chondrites. Carbonaceous chondrites consist of well-established eight chondritic groups – CI (Ivuna –like), CM (Mighei-like), CO (Ornans-like), CV (Vigarano-like), CB (Bencubbin-like), CR (Renazzo-like), CH (ALH A 85005-like) and CK (Karoonda-like). Depending on the metal and iron abundances, ordinary chondrites are of three groups – H (high metal), L (low metal) and LL (low metal and low iron) whereas enstatite chondrites possess only two groups – EH (high metal) and EL (low metal). Enstatite chondrites are strongly reduced, with virtually all the iron in them occurring as metal. Beside these groups, there are two other chondritic groups – one is K (Kakangari-like) chondrite and another is R chondrite (Krot et al., 2005).
1.2.2 Secondary characteristics: Petrologic types
Chondrites are divided into various petrologic types based on the degree to which
they have been thermally metamorphosed or altered. According to Van Schmus and Wood
(1967) classification, CI chondrites were considered to be the most primitive meteorites,
because their compositions provide the best match to solar elemental abundances. CI
3
chondrites are classified as petrologic type 1, some other carbonaceous chondrites are type 2, relatively unmetamorphosed ordinary and enstatite chondrites are petrologic type 3, and petrologic types 4, 5 and 6 indicate progressively higher degree of thermal metamorphism.
Type 7 have sometimes been recognized although it is unclear whether this type reflects the effects of shock as well as thermal metamorphism. Van Schmus and Wood (1967) provided mineralogical and textural criteria to recognize each petrologic type. McSween (1979) demonstrated that petrologic types 1 and 2 were the reflection of the increasing degree of aqueous alteration, while types 3-6 continued to be interpreted as increasing degree of thermal metamorphism (Fig. 1.1). Thus, the most primitive chondrites are actually petrologic type 3. Sears et al. (1980) subdivided type 3 chondrites into types 3.0 to 3.9, based on their thermoluminescence (TL) characteristics. Table 1.1 shows criteria for classifying chondrites according to petrologic type (Weisberg et al., 2006).
Aqueous alteration Pristine Thermal metamorphism
Chondrite/Type 1 2 3 4 5 6 7
CI CM CR CB CH CV CO CK H L LL EH EL R K
50 <200 250 600 700 800 900 Approximate temperature (°C)
Fig. 1.1 Classification system for chondrites. A meteorite is classified by identifying its
chemical group and petrologic type. Approximate temperatures for metamorphism or
alteration are shown at the bottom (McSween and Huss, 2010).
4
Table 1.1 Criteria for classifying chondrites according to petrologic type (Weisberg et al., 2006).
Criteria /
Petrologic type 1 2 3 4 5 6 7
Homogeneity of olivine composition
- > 5% mean deviation ≤5% Homogeneous
Structurally state of low-Ca pyroxene
- Predominantly monoclinic >20%
monoclinic
≤20%
monoclinic
Orthorhombic
Feldspar - Minor primary grains Secondary
<2 μm grains
Secondary 2-50 μm grains
Secondary >50 μm grains Chondrule
glass
Altered or absent
Mostly altered, some preserved
Clear, isotropic Devitrified Absent
Metal:
Maximum Ni (Wt%)
- <20%; taenite minor or absent
>20%; Kamacite and taenite in exsolution relationship Sulfides: Mean
Ni (Wt%)
- > 0.5% <0.5%
Matrix Fine grained opaque
Mostly fine- grained opaque
Opaque to transparent
Transparent, recrystallized Chondrule-
Matrix integration
No chondrules Sharp chondrule boundaries Some
chondrule can be discerned, fewer sharp edges
Chondrules poorly delineated
Primary textures destroyed
Carbon (Wt%) 3-5 0.8-2.6 0.2-1 <0.2
Water (Wt%) 18-22 2-16 0.3-3 <1.5
5
1.2.3 Other classification parameters: shock and weathering
Another important secondary process affecting many chondrites is shock metamorphism. Stöffler et al. (1991) quantified the shock effects observed in olivine and plagioclase, and used these for a shock classification of ordinary chondrite. Scott et al.
(1992) extended this shock classification to carbonaceous chondrites and Rubin et al.
(1997) developed a scheme for enstatite by including shock effects in othopyroxene. The classification recognizes shock stages S1 to S6, representing increasing degree of shock pressure, finally culminating in completely melted rocks. Many shocked chondrites are breccias, formed from fragments of rocks that have been cemented together to form new rocks. A chondritic breccia in which all the fragments are of the same chemical group (but usually different petrologic types) is called monomict. A breccia containing fragments of different meteorite groups is called polymict.
Terrestrial weathering has significantly altered the chemistry of some meteorites.
Weathering leaches out certain mobile elements and introduces others, as well as oxidizes metals to form rust. Based on surface rustiness and the presence or absence of surficial deposits of evaporate minerals, Antarctic meteorites are categorized (Table 1.2a based on Cassidy, 1980). Depending on oxidation effects of metallic Fe-Ni and troilite visible in polished thin section, ordinary chondrites belong to different weathering scale (Table 1.2b;
Wlotzka, 1993a). But for metal-poor CK and R chondrites, Rubin (2005) proposed weathering index which is shown in Table 1.2c.
Table 1.2a Weathering categories for Antarctic meteorites.
Weathering categories
Description Remarks
A Minor rustiness Rust haloes on metal particles and rust stains along fractures are minor.
B Moderate rustiness Large rust haloes occur on metal particles and rust stains on internal fractures are extensive.
C Severe rustiness Metal particles have been mostly stained by rust throughout.
e Evaporite minerals Evaporite minerals visible to naked eye.
6
Table 1.2b Weathering Scale for ordinary chondrites.
Weathering Scale
Description
W0 No visible oxidation of metal or sulfide. A limonitic staining may be noticeable in transmitted light.
W1 Minor oxide rims around metal and troilite;
minor oxide veins.
W2 Moderate oxidation of metals, about 20-60%
being affected
W3 Heavy oxidation of metal and troilite, 60-95%
being replaced
W4 Complete (>95%) oxidation of metal and troilite
W5 Beginning alteration of mafic silicates, mainly along cracks.
W6 Massive replacement of silicates by clay minerals and oxides
Table 1.2c Weathering index for CK and R chondrites.
Weathering index
Description Remarks
Wi-0 Unweathered <5 vol% of silicates stained brown Wi-1 Slightly weathered 5-25 vol% of silicates stained brown Wi-2 Moderately weathered 25-50 vol% of silicates stained brown Wi-3 Significantly
weathered
50-75 vol% of silicates stained brown Wi-4 Highly weathered 75-95 vol% of silicates stained brown Wi-5 Severely weathered >95 vol% of silicates stained brown
Wi-6 Extremely weathered Nearly complete brown staining of silicates.
Significant replacement of mafic silicates by phyllosilicates.
1.3 R chondrites
R chondrites have been recognized as a new, well-established chondritic group differing from carbonaceous, ordinary and enstatite chondrites since 1994 (Rubin and Kallemeyn, 1994; Schulze et al., 1994 and Bischoff et al., 1994). This group is named after the Rumuruti meteorite, the first and so far the only R chondrite fall (Schulze et al., 1994).
The Rumuruti meteoritic shower fell in Rift valley, Kenya on 1934 (Wlotzka, 1993).
7
Previously, R chondrites were known as Carlisle Lakes-like chondrites and denoted as a
`grouplet` by Rubin and Kallemeyn (1989) who analyzed three samples (Carlisle Lakes, ALH 58151 and Y 75302) of such kind. They used the term `grouplet` instead of `group`, as Wasson (1985) recommended that a meteoritic group should be required to have five or more members. Carlisle Lakes was found in Australia by 1977 and was classified as a new subclass of ordinary chondrites having high oxidation state (Binns and Pooley, 1979) while ALH 85151 and Y 75302 were discovered from Antarctica. Weisberg et al., 1991 found the highest Δ
17O value (up to 2.91) for the aforesaid meteorites and distinguished them from the other chondritic groups. After this, Acfer 217 (Bland et al., 1992), Y 793575 (Yanai, 1992), PCA 91002 (Marlow and Mason, 1992), Y 82002 (Nakamura et al., 1993) were also identified as Carlisle Lakes-type chondrites. Furthermore, clasts with strong affinities to Carlisle Lakes-type chondrites were discovered along with ordinary chondrite clasts in the Weatherford chondrite breccia (Prinz et al., 1993). The large number of these chemically and mineralogically related meteorites justifies the definition of a new group of chondrites (Rubin and Kallemeyn, 1994; and 1994 and Bischoff et al., 1994) which was R chondrite.
1.4 R chondrite constituents 1.4.1 Chondrules
Condrule abundance in R chondrites (>40%) is much lower than those in ordinary
chondrites and enstatite chondrites (60-80%) while in CI chondrites chondrule abundance is
less than 5% (Scott and Krot, 2005). All of the major chondrule types (Gooding and Keil,
1981) have been identified in R chondrites: porphyritic olivine (PO, type-I and II),
porphyritic pyroxene (PP), porphyritic olivine-pyroxene (POP), barred olivine (BO), radial
pyroxene (RP), cryptocrystalline (C) and granular olivine-pyroxene (GOP) (Kallemeyn et
al., 1996). The average chondrule diameter in R chondrite is 400 μm which is intermediate
between H (300 μm) and L (500 μm) chondrites (Scott and Krot, 2005). Bischoff et al.,
1994 found a mean chondrule diameter of 410 μm for Acfer 217. Similar mean chondrule
diameter was found for Carlisle Lakes (460 μm), ALH 85151 (410 μm), Y 75303 (420 μm),
Rumuruti (365 μm) and PCA 91002 (310 μm) (Rubin and Kallemeyn, 1989, 1994; Schulze
et al., 1994 and Kallemeyn et al., 1996). Isa et al., 2014 pointed out that a chondrule size of
400-500 μm is typical for R chondrites.
8 1.4.1.1 Al-rich chondrules
Rout and Bischoff (2008) and Rout et al., (2010) have studied 20 R chondrites of different petrologic types and reported 19 Al-rich chondrules of variable sizes (upto 550 μm) and mineralogical compositions. The dominant mineral phases in these Al-rich chondrules are plagioclase, fassaite, spinel, diopside and olivine while the accessory minerals are ilmenite and sulfides. Al-rich chondrules are also well established group of chondrules in ordinary chondrites, enstatitie chondrites and carbonaceous chondrites (e.g., Bischoff A. and Keil K, 1983, 1984; Bischoff et al., 1985; MacPherson and Huss, 2005).
1.4.2 Matrix
Based on a study of Carlisle Lakes, ALH 85151, Y 75302, Y 793575, Y 82002, Acfer 217, PCA 91002 and PCA 91241 Rubin and Kallemeyn (1993) determined R chondrite matrix abundances of 42 ± 11 vol% besides chondrules, larger mineral and lithic fragments. Matrix abundance in R chondrites is much higher than the ordinary (10-15%) and enstatite (˂0.1-10) chondrites while the highest matrix abundance is observed in CI (95%) chondrites (Scott and Krot, 2005). Bischoff (2000) reported a chondrule-matrix ratio of ~1:1 in type 3 clast from R chondrite breccias.
1.4.3 Ca, Al-rich inclusions
In 20 R chondrites of different petrologic types, Rout and Bischoff (2008) found
101 Ca, Al-rich inclusions (CAIs). The sizes of these inclusions in R chondrites are very
small. The largest CAI is 600 μm in size whereas most are ˂200 μm. According to the size
of CAIs in different chondrite groups, the following sequence can be given: CV > CM ≈
CO > CR > RC ≥ CH > OC > EC. The abundance of CAIs in R chondrites is very low
(<0.1%). According to the abundance of CAIs, chondrites can be arranged in the following
way: CC > RC > OC > EC. The dominant phases in CAIs of type 3 lithologies in R
chondrites are spinel (MgAl
2O
4), fassaite (Ca(Mg,Fe,Al)(Si,Al)
2O
6), nepheline
(Na
3KAl
4Si
4O
16), sodalite (Na
8(Al
6Si
6O
24)Cl
2) and diopside (MgCaSi
2O
6) and the
accessory phases are hibonite ((Ca,Ce)(Al,Ti,Mg)
12O
19), anorthite (CaAl
2Si
2O
3), olivine
((Mg,Fe)
2SiO
4), ilmenite (FeTiO
3) and perovskite (CaTiO
3). Perovskite is only found in
CAIs in lithologies of lower petrologic type while in higher metamorphic grade, only
ilmenite is observed. CaO in perovskite is replaced by FeO to form ilmenite during
9
secondary alteration. In several cases, grains have cores of perovskite and rims of ilmenite.
Similar observations were made for perovskite-ilmenite assemblage in CAIs from ordinary chondrites (Bischoff and Keil, 1983, 1984).
1.5 Mineralogy of R chondrite 1.5.1 Olivine
R chondrites are olivine-rich rocks with an olivine abundance of typically 65-78%
(e.g. Schulze et al., 1994; Kallemeyne et al., 1996) while in ordinary chondrites olivine abundance ranges from 40-60% (Weisberg et al., 1991). A typical olivine composition in R chondrites is Fa
37-41(e.g., Rubin and Kallemeyn, 1989, 1994; Weisberg et al., 1991;
Bischoff et al., 1994; Kallemeyn et al., 1996; Isa et al., 2014) which is much higher than that of ordinary chondrites (Fa
18-30) (Rubin, 1990; Weisberg et al., 1991). Kallemeyn et al.
(1996) reported the olivine/low-Ca pyroxene ratio ranges from 6.7 in Carlisle Lakes to
~140 in Rumuruti (and to ≥ 1500 in Y 793575). Ordinary chondrites contain much lower normative olivine/low-Ca pyroxene ratio: e.g., ~1.5 and ~2.1 in H and L chondrites, respectively (Dodd, 1981 cited by Kallemeyn et al., 1996).
1.5.2 Pyroxene
In equilibrated R chondrites, Ca-pyroxene by far the dominating mineral whereas in unequilibrated chondrites low-Ca and Ca-pyroxene occur roughly in similar proportions (Bischoff et al., 2011). The average modal abundances of low-Ca pyroxene and Ca- pyroxene in R chondrites are 4.3% and 5.8%, respectively (Kallemeyn et al., 1996). Ca- pyroxene in R chondrites is moderately higher than that in ordinary chondrite (4-5%) but low Ca-pyroxene is much lower than that in ordinary chondrites (H: ~29%, L: ~25%, LL:
~18%; Van Schmus, 1969).
1.5.3 Plagioclase
Modal abundances of plagioclase (5.5-13.0%, mean: 9.6%) in R chondrites are
similar to those in ordinary chondrite (~10%) (Kallemeyn et al., 1996). In R chondrites,
plagioclase are mostly albites or oligoclases (e.g., Rubin and Kallemey, 1989; Bischoff et
al., 1994).
10 1.5.4 Sulfides
Isa et al., (2014) demonstrated that most of the sulfide grains in equilibrated R chondrites are pentlandite ((Fe,Ni)
9S
8) and Pyrrhotite (Fe
1-xS). Monosulfide solid solution (Fe
1-xS – Ni
1-xS) is also present in equilibrated R chondrites as well as in R chondrite clasts in Bencubbin and Murchison. Troilite (FeS) abundance in ordinary chondrites is much higher than that in R chondrites (Weisberg et al., 1991).
1.5.5 Oxides
The most abundant oxides are Cr-spinels with high TiO
2and Fe
3O
4(Bland et al., 1992; Schulze et al., 1994; Bischoff et al., 1994). Remarkably high TiO
4-concentrations were published for spinels in Rumuruti (~6 wt%; Schulze et al., 1994), Carlisle Lakes and ALH 85151 (6.4 and 5.6 wt%, respectively; Rubin and Kallemeyn, 1989). Magnetite (Rubin and Kallemeyn, 1994), Ilmenite (Schulze et al., 1994, Bischoff et al., 1994) and Perovskite (Rout and Bischoff, 2008) were also reported as oxide phase in R chondrites.
1.5.6 Phosphates
Phosphates have been reported from several chondrites (e.g., Weisberg et al., 1991;
Bischoff et al., 1994; Schulze et al., 1994; Rubin and Kallemeyn, 1994; McCanta et al., 2008; Endo et al., 2010). They probably occur as a minor phase (<1 vol%) in R chondrites.
A large Cl-apatite-rich aggregate of ~500 μm × 180 μm was found in Acfer 217 (Bischoff et al., 1994). Beside chlorapatite in Rumuruti and Acfer 217, mirrillite was reported from Rumuruti (Schulze et al., 1994) and Rubin and Kallemeny (1994) determined an abundance of 0.3 vol% of chlorapatite and 0.2 vol% of mirrillite in PCA 91002. LAP 04840 contains little apatite (~0.6 vol%) as scattered euhedral and anhedral crystals with a chemically high proportion of OH relative to Cl and F (McCanta et al., 2008). Modal abundance of phosphate in R chondrites is moderately lower than those in ordinary chondrites (~0.7%, Van Schmus, 1969).
1.5.7 Metal phase
Kallemeyn et al., (1996) reported that metallic Fe-Ni is extremely rare to absent in
most of R chondrites. They analyzed Carlisle Lakes, ALH 85151, PCA91002, Y 75302, Y
793575, Y 82002, Acfer 217 and Rumuruti and found metal phase only in Rumuruti
11
(0.005%) and in ALH 85151 (0.9%) where metal phase is Ni rich (awaruite, Ni
2-3Fe). In ordinary chondrites metal phase is much higher than those in R chondrites (Weisberg et al., 1991). Kamacite and Taenite are the dominating metal phases in ordinary chondrites whereas they are completely absent in R chondrites (Van Schmus, 1969; Weisberg et al., 1991; Kallemeyn et al., 1996; Isa et al., 2014).
1.6 Textural characteristics of R chondrites
Most of the R chondrites are breccias and many are regolith breccias with solar wind implanted gases (Weber and Schultz, 1995). For instance, Acfer 217, Rumuruti, Dar al Gani 013 contain unequilibrated type 3 fragments and clasts metamorphosed to various degrees (Bischoff et al., 1994; Schulze et al., 1994; Jäckel et al., 1996; Kallemeyn et al., 1996). Impact melt (in Dar al Gani 013; Jäckel et al., 1996) and dark clast (in Rumuruti;
Schulze et al., 1994) were also reported for R chondrites.
1.7 Shock effects
Most of the R chondrites are very weakly (S2) or weakly shocked (S3) (Bischoff et al., 2011), using the shock classification scale for ordinary chondrites (Stöffler et al., 1991).
Shock stage of NWA 053, NWA 753, NWA 755, NWA 4419, Dar al Gani 417, Ouzina, Sahara 99248 were reported as S2 (Bischoff et al., 2001; Weber and Schultz, 2001;
Caporali et al., 2009) whereas Carlisle Lakes and Hammadah al Hamra 119 appear unbrecciated and have been classified as S3 chondrites (Dixon et al., 2003). The brecciated Rumuruti chondrite is only very weakly shocked (S2), but a vain in one of the clasts indicates that different fragments have experienced different degrees of shock metamorphism at different times in the evolution of the breccia (Schulze et al., 1994; Dixon et al., 2003). Acfer 217 is very weakly shocked (S2), although some fragments have experienced higher degrees of shock (Bland et al., 1992; Bischoff et al., 1994). Similar observations were made for ALH 85151 and PCA 91002 (Rubin and Kallemeyn, 1989, 1994). Nevertheless, the complex breccia Dar al Gani 013 was classified as S1 chondrite (Jäckel et al., 1996). Fragments in ALH 85151 and Rumuruti exhibit significant silicate darkening due to the dispersion of fine-grained sulfide and chromite (Kallemeyn et al., 1996). However, shock veins appear to be quite rare in R chondrites (Bischoff et al., 2011).
So far, only a few have been reported in different lithologies from R chondrites, e.g.,
Rumuruti, Y 82002 and PCA 91002 (Schulze et al., 1994; Rubin and Kallemeny, 1994).
12 1.8 R chondrite chronology
Dixon et al., (2003) determined the
39Ar-
40Ar ages for the whole-rock of Carlisle Lakes, Rumuruti, Acfer 2017 and PCA 91002 which were breccias except for Carlisle Lakes. Noticing a complicated age spectra due to the diffusive loss of radiogenic
40Ar to various extent, they reported the peak
39Ar-
40Ar ages: ≥4.35 Ga (Carlisle Lakes),
~4.47±0.02 Ga (Rumuruti), 4.30±0.07 Ga (Acfer 217) and ≥4.37 Ga (PCA 91002). R chondrites have relatively old
39Ar-
40Ar ages that overlap those of the oldest L and LL chondrites (Dixon et al., 2003 and references therein). Dixon et al. (2003) interpreted that during parent body metamorphism, the clasts were heated to different temperatures at different depths in the body. At ~4.47 Ga ago, an impact caused mixing of material from different depth and resetting the
39Ar-
40Ar ages. Rapid subsequent cooling under a rather thin regolith layer could have prevented further metamorphism of the clasts. Later impacts (~4.37 Ga ago) probably reset at least partially some of the samples. Buikin et al. (2006) and Trieloff et al. (2007) studied different lithologies from Rumuruti breccia and found that the coarse grained type 5/6 lithology has the best defined age plateau of 4.53 ± 0.01 Ga.
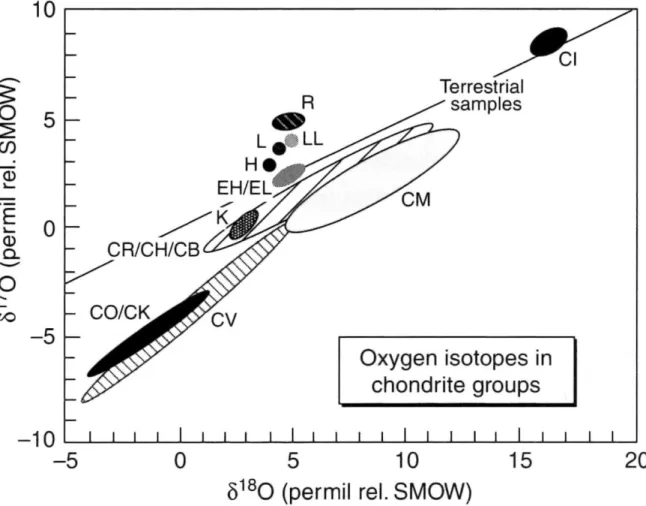
1.9 Oxygen isotopic composition
Kallemeyn et al. (1996) reported the whole-rock Δ
17O values (~2.9) for Rumuruti,
ALH 85151 and PCA 91002, which were the highest of any known meteorites. Similar
finding was also observed by Weisberg et al. (1991). Bischoff et al. (2011) reviewed the
previous literature (e.g., Schulze et al., 1994; Bischoff et al., 1994; McCanta et al., 2008)
data and calculated a mean Δ
17O value (2.71±0.31) for R chondrites. Rubin (2011)
demonstrated that the Δ
17O values increase in the inner solar system with increasing of
heliocentric distance from enstatite chondrites (0.0‰) to H, L and LL ordinary chondrites
(0.7‰, 1.1‰ and 1.3‰, respectively) to R chondrites (2.9‰). The values peak around the
R-chondrite location and then become increasingly negative among carbonaceous
chondrites with increasing of distance from the Sun: CR (-1.0‰), CV-CK (-4.2‰ to -
4.6‰), CO-CM (-4.7‰ to -5.2‰) and CI (-6.5‰). Furthermore, Greenwood et al. (2000)
measured oxygen isotopic compositions of magnetite and olivine in thin sections of PCA
91241 and PCA 91002, and discussed about a generic linkage between R chondrites and
ordinary chondrites. In their study, Δ
17O values for magnetite and olivine are ranging from
+2.5‰ to +4.3‰ and -1.2‰ to +2.9‰, respectively. Fig. 1.2 (McSween and Huss, 2010)
13
demonstrated the oxygen isotopic composition of bulk R chondrites in comparison to the other chondritic groups.
Fig. 1.2 Oxygen isotopic compositions for bulk chondrites, after Clayton (2004). By
convention,
17O/
16O and
18O/
16O ratios are plotted as deviations from the composition of
standard mean ocean water (SMOW) in unit of parts per thousand (permil). The δ values
are calculated as follows: δ
17O = [((
17O/
16O)
sample/(
17O/
16O)
SMOW) - 1] × 1000, and similarly
for δ
18O (McSween and Huss, 2010; with the permission of Cambridge University Press).
14 1.10 Bulk chemical composition
The bulk chemical compositions of R chondrites are mostly done by using instrumental neutron activation analysis (e.g., Rubin and Kallemeyn, 1989, 1994; Bischoff et al., 1994, Schulze et al., 1994; Kallemeyn et al., 1996; Palme et al., 1996; Isa et al., 2014). The general bulk chemical characteristics of R chondrites are as follows:
(a) In bulk chemical composition, R chondrites have some affinity to ordinary chondrites (Palme et al., 1996; Kallemeyn et al., 1996, Greenwood et al., 2000; Isa et al., 2014).
(b) The average CI, Mg-normalized lithophile element abundances are ~0.95×CI, which is lower than those for the carbonaceous chondrites (≥1.0×CI; Kallemyn and Wasson, 1981) and slightly higher than those for ordinary chondrites (~0.9×CI) (Kallemeyn et al., 1996).
(c) Total Fe content in R chondrites (~24wt%) (Rubin and Kallemeyn, 1989, 1994;
Bischoff et al., 1994, Schulze et al., 1994; Kallemeyn et al., 1996; Palme et al., 1996; Ozaki et al., 1998; Isa et al., 2014) is intermediate between those of H (27.1wt%) and L (21.6wt%) chondrites (Kallemeyn et al., 1989).
(d) The absence of significant depletions in Mn and Na in R chondrites and ordinary chondrites is an important feature to distinguish these groups from carbonaceous chondrites (Palme et al., 1996).
(e) Mean R chondrite abundances of refractory siderophiles (Os, Ir), common siderophiles (Ni, Co, Fe) and Au are intermediate between those in L chondrites and H chondrites (Isa et al., 2014).
(f) The abundances of Zn and Se are much higher than those of ordinary chondrites (Kallemeyn et al., 1996, Palme et al., 1996, Isa et al., 2014).
(g) Anomalous abundances of Au, Ni and Co in some R chondrites are probably due to terrestrial weathering (Kallemeyn et al., 1996; Bischoff et al., 1996; Palme et al., 1996).
1.11 Motivation of this work
Other than instrumental neutron activation analysis (INAA), some other analytical
techniques were also applied for determining the bulk chemical composition of R
chondrites, e.g., RNAA (Xiao and Lipschutz, 1992), XRF (Dreibus et al., 1995; Palme et al.,
1996), PGA (Ozaki et al., 1998), ICP-MS (Acken et al., 2011), MS-ID (Nakamura et al.,
15
1999), etc. Bulk chemical compositions of most of the R chondrites have been analyzed by neutron activation analysis techniques. However, the bulk chemical data-base for R chondrites is still not so rich like carbonaceous, ordinary and enstatite chondrites. But to understand the nebular origin and the parent body processes, a greater set of bulk chemical composition data is an essential tool.
Nakamura et al., (1999) used isotope dilution technique (MS-ID) for determining rare earth elements in five Antarctic R chondrites. Isotope dilution technique provides a very precise data for the rare earth elements, but it is unable to determine the mono-isotopic Pr, Tb, Ho and Tm. Boynton, 1978 demonstrated that detailed REE abundance pattern as well as Th and U should be determined for explaining the nebular and parent body processes. Palme et al. (1996) applied XRF for bulk chemical analysis of only three R chondrites (Rumuruti, Acfer 217 and Dar al Gani 013), especially phosphorus. Phosphorus abundance is important for explaining the REE, Th and U abundance (Goreva and Burnett, 2001). Boynton (1975) and Davis and Grossman (1979) demonstrated the REE fractionation in solar nebula in terms of fractional condensation. So, the detail abundances of REEs, Th and U along with the P abundance are important to ascertain the nebular processes of chondrites. But, for R chondrites, detail abundances of REEs, Th and U are not available.
Using RNAA, Xiao and Lipschutz (1992) analyzed one R chondrite (ALH 58151) for volatile elements. Volatile elemental abundances are important tool for explaining the nebular and/or parent body processes (Takhashi et al., 1978). Volatile elements are strongly depleted in chondritic meteorites compared with those of solar composition (CI meteorite).
For explaining the volatile composition in chondrites, two-component model has been proposed by Anders and coworkers (e.g., Anders, 1964; Larimer and Anders, 1967).
According to this model, the volatile elemental abundance pattern in chondrites was
established during accretion from solar nebula. In a regime of falling temperatures, volatile
elements would condense in succession on the fine grind dust (fraction A), but not on the
coarse-grained chondrules-plus-metal (fraction B). The composition of fraction A would
thus vary with temperature, while that of fraction B remains essentially fixed. Meteorites
last to accrete would therefore be richest in volatiles. This model can approximately explain
the systematic variation of volatile elements in type II (CM chondrites, 0.55×CI) and type
III (CV and CO chondrites, 0.32×CI) carbonaceous chondrites relative to the type I (CI
chondrites) carbonaceous chondrites (Larimer and Anders, 1967). Tandon and Wasson
16
(1967) reported a systematic variation of indium in a petrologic suite of L-group chondrites and, to explain this variation, they proposed three-component model (Tandon and Wasson, 1968). According to this model, elemental abundances were established during accretion, as in the two-component model. However, strongly depleted elements were brought in mainly by a third component (fraction C), strongly enriched in all volatile elements. Along with the two and three-component models, another condensation model was proposed known as multi-component model (Blander and Abdel-Gawad, 1969). In this model, condensation and accretion proceed simultaneously (as in two-component model), with the condensation efficiency on components A and B being governed by surface area, and the volatile content of the fine-grained dust increases with falling temperatures. However, some of the dust (along with chondrules) continually agglomerates to `chunks`, and thereafter ceases to take up volatiles on further cooling. Thus a large number of sub-components (A
1, A
2, A
3… A
n) are produced, each having a composition reflecting its agglomeration temperature. The volatile content of a given meteorite thus reflects the proportions of components A
1to A
n, rather than the accretion temperature of the meteorite itself. In all condensation models, condensation and accretion proceed simultaneously.
Metamorphism model was also proposed for explaining the volatile depletions (Wood, 1967; Dodd, 1969). In this model, all ordinary chondrites initially had the composition and mineralogy of petrologic type 3. The depletion pattern was established during metamorphism, with the most intensely metamorphosed meteorites losing the greatest proportion of volatiles. Later on, by a series of paper Lipschutz and co-workers (e.
g., Ikramuddin and Lipschutz, 1975; Ikramuddin et al., 1976, 1977) presented their heating experiment and supported the metamorphism model along with the condensation model.
That is, volatile elements are important for discussing the nebular and/or parent body
process(es). Previously, Anders, Wasson, Lipschutz and their coworkers reported volatile
elemental abundances in different chondritic meteorites (e.g., Keays et al., 1971; Takahashi
et al., 1978; Tandon and Wasson, 1967, 1968; Kaczaral et al., 1989; Wang and Lipschutz,
2007) using radiochemical neutron activation analysis. But for R chondrites, no volatile
elemental data are available (except for ALH 85151 by Xiao and Lipschutz, 1992) for
discussing their nebular and/or parent body process (es). So this study will focused on the
most thermally labile trace elements - particularly Zn, Pb, Bi, In, Tl and Cd, since these are
the most sensitive to genetic processes accompanied by significant heating (e.g.,
metamorphic heating and/or shock heating) (Lipschutz, 1997 and Wasson, 2005).
17 1.12 Objective of this study
This work will characterize R chondrites chemically from a comprehensive study of bulk chemical composition by INAA, ICP-MS, ICP-AES and MS-ID experiments, in a significant number of R chondrites of all petrologic types. The major goals of this work are as follows:
(a) Using instrumental neutron activation analysis, 24 elements (Na, Mg, Al, Ca, Sc, V, Cr, Mn, Fe, Co, Ni, Zn, As, Se, Br, Sb, La, Sm, Eu, Yb, Lu, Os Ir and Au) will be analyzed for chemical characterization of R chondrites. These elemental abundances will be used for taxonomic study and for explaining the nebular oxidation process.
(b) ICP-MS and ICP-AES experiments will provide the detailed REEs, Th and U, and P abundances, respectively. This study will explain the REEs, Th and U fractionations in R chondrites.
(c) A precise volatile elemental (Zn, Cd, In, Tl, Pb and Bi) abundances will be
presented from MS-ID experiment to explain the nebular and/or parent body
process (es).
18
Chapter-2
Experimental
19 2.1 Sample information
R chondrite is one of the rare classes of chondritic group that comprises only about 0.1% of the chondritic fall on Earth (Grady, 2000). But the recent discoveries of meteorites from Antarctica mainly by National institute of polar science (NIPR), Tokyo and US Antarctic search for meteorites program (ANSMET) provide the all petrologic specimen of R chondrites and allow us a systematic study of this group. According to the meteoritical society database, 152 chondrites are classified as R chondrite (upto July, 2014). To study the nebular and/or parent body processes of R chondrites, it is essential to consider all the petrologic grade samples.
In this study 15 antarctic R chondrites (Table 2.1) have been analyzed. Seven of them were obtained from National institute of polar research, Tokyo (Y-793575.44, A- 881988.68, Y-983270.56, Y-983720.81, Y-983097.81, Y-980702.61, Y-980703.71) and others were obtained from NASA, Johnson space center (PRE 95411.21, ALH 85151.41, MIL 07440.8, LAP 03639.33, LAP 04840.12, MIL 11207.8, LAP 02238.13, PCA 91002.64). Among these samples PRE 95411, LAP 03639 and LAP 04840 were analyzed by Isa et al. (2014), ALH 85151 by Rubin & Kallemeyn (1989) and PCA 91002 & Y 793575 by Kallemeyn et al. (1996) using instrumental neutron activation analysis. All specimens were interior chips and were free from fusion crust. For systematic study we have chosen the samples to cover all types of petrologic grade (R3 to R6). Rubin and Huber (2005) demonstrated the weathering index for the R chondrites and showed the loss of some elements, presumably by leaching. This study generally avoided requesting R chondrites exhibiting such weathering but did include one sample of C class. Weathering index for Y-980702 and Y 980703 were not assigned. The available weathering indexes (wi) from Rubin and Huber (2005) are also mentioned in Table 2.1. The total masses of the individual R chondrites were ranged from 0.6g to 0.8g, except that for ALH 85151 (0.434g).
Each of the samples was separately ground by a clean agate mortar to make homogeneous powder.
In all experiments, Smithsonian Allende (USNM 3529, split/position: 22/6) powder
was used as a control sample.
20 Table 2.1 Ancillary data for meteorites in this study
Meteorite Abbreviation Position Class
aWeathering
aFayalite (mol%)
Ferrosilite (mol%)
Sample ground (mg)
Sources
cMount Prestrud 95411 PRE 95411 21 R3 A/B 1-41
d, 40
e15-29
d829 JSC
Allan Hills 85151 ALH 85151 41 R3.6 B(wi2)
b0.1-41
f6-30
f434 JSC
Yamato 793575 Y 793575 44 R3.8 (wi4)
b633 NIPR
Asuka 881988 A 881988 68 R4 (wi3)
b35
e619 NIPR
Yamato 983270 Y 983270 56 R4 A 38.4-40.1
g623 NIPR
Miller Range 07440 MIL 07440 8 R4 Be 38
h10
h792 JSC
LaPaz Icefield 03639 LAP 03639 33 R4 A/B 19-38
i13-29
i821 JSC
Yamato 983720 Y 983720 81 R4 A 39.6, (12.8-46.9)
g616 NIPR
Yamato 983097 Y 983097 81 R5 A 35.0, (34.2-37.0)
g29.3 632 NIPR
Yamato 980702 Y 980702 61 R6 ? 38
e666 NIPR
Yamato 980703 Y 980703 71 R6 ? 39.1, (38.4-40.2)
j645 NIPR
LaPaz Icefield 04840 LAP 04840 12 R6 A/B 38
i30
i870 JSC
Miller Range 11207 MIL 11207 8 R6 Ce 39-41
k20
k854 JSC
LaPaz Icefield 02238 LAP 02238 13 R B(wi4)
b39
e, (27-46)
l18-36
l760 JSC
Pecora Escarpment 91002 PCA 91002 64 R3.8-6 A/B(wi1)
b1-44
f1-28
f829 JSC
a
Antarctic Meteoritic Newsletters,
bRubin and Huber (2005),
cJSC: Johnson Space Center, NASA, USA,
cNIPR: National Institute of Polar
Research, Tokyo, Japan,
dGrossman (1998),
eIsa et al. (2014),
fGrossman (1994),
gYamaguchi et al. (2012),
hRighter (2011),
iConnolly Jr. et
al. (2007),
jKojima et al. (2009),
kRighter (2012),
lRussell et al. (2004).
21 2.2 Experimental techniques
For a systematic study of bulk chemical composition, three different analytical techniques were used,
a) Instrumental neutron activation analysis (INAA),
b) Inductively coupled plasma atomic emission spectrometry (ICP-AES), and c) Inductively coupled plasma mass spectrometry (ICP-MS).
In ICP-MS experiment, both internal calibration method and isotope dilution technique have been applied.
2.3 Instrumental neutron activation analysis 2.3.1 Sample preparation
About 40 mg of each powdered sample (Table 2.2) was taken into a 1cm × 1cm polyethylene bag and sealed. These bags were then doubly packed by another layer of polyethylene and sealed. At the same time, JB-1 (geological standard) and Allende were also prepared as standard and control samples, respectively. For correcting the
28Si(n,p)
28Al,
27
Al(n,p)
27Mg and
27Al(n, α)
24Na effect in determining the Al, Mg and Na, Al, MgO and Si chemical reagents were prepared for short irradiation. For long irradiation, Se, Sb, Os, Ir and Au chemical standards were prepared from reagents.
Table 2.2 Sample weight for INAA experiment.
R chondrites Sample weight (g)
1. PRE 95411 0.04320
2. ALH 85151 0.03976
3. Y 793575 0.03978
4. A 881988 0.03862
5. Y 983270 0.04472
6. MIL 07440 0.03951
7. LAP 03639 0.04302
8. Y 983720 0.04116
9. Y 983097 0.04172
10. Y 980702 0.04118
11. Y 980703 0.04188
12. LAP 04840 0.04057
13. MIL 11207 0.04306
14. LAP 02238 0.04151
15. PCA 91002 0.04291
22 2.3.2 Sample irradiation and counting
To determine the short-lived elements, samples, standard, Allende and chemical reagents were irradiated separately at Kyoto University Research Reactor at 1MW for 10 seconds. After ~5 minutes cooling, the outer bag of the irradiated sample was changed with a new one and counting was taken in a HPGe detector using 300 seconds as live time. For long Irradiation, the samples were irradiated simultaneously at 1MW for 4hours. After six days of cooling and changing the outer bag, the first counting was taken for 3 hours as live time in HPGe detector at Radioisotope Research Center, Tokyo metropolitan university.
Three weeks later, counting was again taken for 12 hours to determine the long-lived radionuclides. Twenty four elements were determined in R chondrites from different irradiations and counting stages (Table 2.3).
Table 2.3 Elements analyzed at different irradiation and counting stage.
Decay time
Counting time
Elements determined Short irradiation 5 min 300 s Na, Mg, Al, Ca, V and Mn Long irradiation (first
counting)
6 days 3 hr. Na, Sc, Cr, Fe, Co, As, Br, Sb, Au, La, Sm, Yb and Lu
Long irradiation (second counting)
3 weeks 12 hr. Cr, Fe, Co, Ni, Ir, Os, Se, Eu and Zn
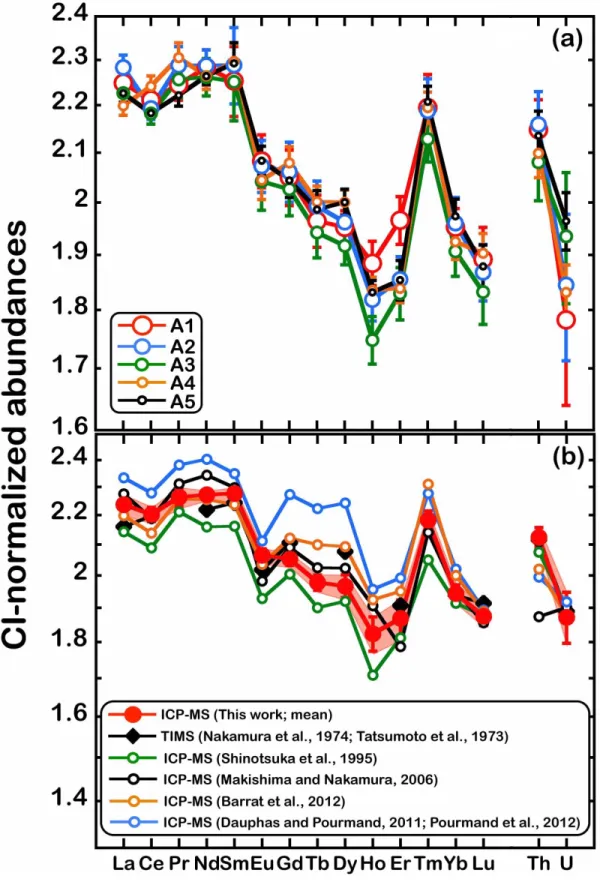
2.3.3 Accuracy and precision
For all elements, JB1 (a geological reference sample issued by Geological Survey of Japan) was used as standard except that for Os, Ir, Au and Se. For these elements, chemical reagents were used as standard. Data reductions were done by using information noted in Table 2.4. In the possible cases, we used more than one gamma-energy (in keV) for elemental abundance calculations. Elemental abundances obtained by using different gamma-energy are in good agreement with each other.
To ensure the data quality, the Allende Smithsonian powder was used as a control
sample. To do so, three replicates of Allende powder (~40 mg) were irradiated under
identical conditions at Kyoto University Research Reactor (KURR). These samples were
irradiated in two segments giving approximately six months of interval (June – December,
2012). Results are shown in Table 2.5 with 1σ uncertainty (n=3). The maximum deviation
from the mean is about 6% for Br and lower for the other elements analyzed. Relative
standard deviations of the replicate measurements are lower than the % of uncertainty
23
generated from counting statistics. In Fig. 2.1 Allende data of this study is normalized to that of literature data (Kallemeyn & Wasson, 1981 and Kallemeyn et. al., 1989). For all elements, our data are consistent with the literature data, except for La, Sm and Ir.
Lanthanum and Sm data are about 8% higher while Ir is ~10% lower compared with those of Kallemeyn & Wasson (1981) and Kallemeyn et. al. (1989). But, our La, Sm & Ir data are in good agreement with those of Wasson et. al. (2013). Furthermore, La & Sm were also determined by ICP-MS and the data of La & Sm obtained both from INAA and ICP-MS are consistent within the limit of uncertainty.
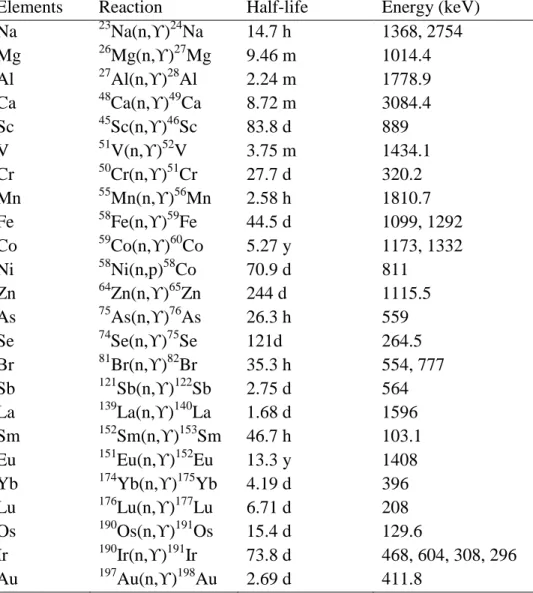
Table 2.4 Nuclear reactions, half-life and energy considered for corresponding elemental determination.
Elements Reaction Half-life Energy (keV)
Na
23Na(n,ϒ)
24Na 14.7 h 1368, 2754
Mg
26Mg(n,ϒ)
27Mg 9.46 m 1014.4
Al
27Al(n,ϒ)
28Al 2.24 m 1778.9
Ca
48Ca(n,ϒ)
49Ca 8.72 m 3084.4
Sc
45Sc(n,ϒ)
46Sc 83.8 d 889
V
51V(n,ϒ)
52V 3.75 m 1434.1
Cr
50Cr(n,ϒ)
51Cr 27.7 d 320.2
Mn
55Mn(n,ϒ)
56Mn 2.58 h 1810.7
Fe
58Fe(n,ϒ)
59Fe 44.5 d 1099, 1292
Co
59Co(n,ϒ)
60Co 5.27 y 1173, 1332
Ni
58Ni(n,p)
58Co 70.9 d 811
Zn
64Zn(n,ϒ)
65Zn 244 d 1115.5
As
75As(n,ϒ)
76As 26.3 h 559
Se
74Se(n,ϒ)
75Se 121d 264.5
Br
81Br(n,ϒ)
82Br 35.3 h 554, 777
Sb
121Sb(n,ϒ)
122Sb 2.75 d 564
La
139La(n,ϒ)
140La 1.68 d 1596
Sm
152Sm(n,ϒ)
153Sm 46.7 h 103.1
Eu
151Eu(n,ϒ)
152Eu 13.3 y 1408
Yb
174Yb(n,ϒ)
175Yb 4.19 d 396
Lu
176Lu(n,ϒ)
177Lu 6.71 d 208
Os
190Os(n,ϒ)
191Os 15.4 d 129.6
Ir
190Ir(n,ϒ)
191Ir 73.8 d 468, 604, 308, 296
Au
197Au(n,ϒ)
198Au 2.69 d 411.8
24
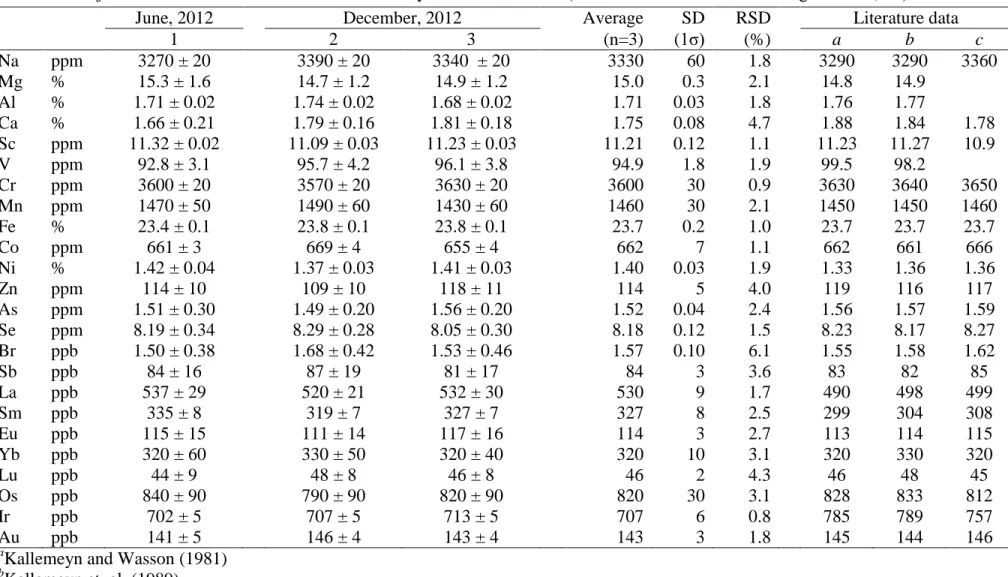
Table 2.5 Major and trace element abundances obtained by INAA for Allende (uncertainties are due to counting statistics, 1σ).
June, 2012 December, 2012 Average SD RSD Literature data
1 2 3 (n=3) (1σ) (%) a b c
Na ppm 3270 ± 20 3390 ± 20 3340 ± 20 3330 60 1.8 3290 3290 3360
Mg % 15.3 ± 1.6 14.7 ± 1.2 14.9 ± 1.2 15.0 0.3 2.1 14.8 14.9
Al % 1.71 ± 0.02 1.74 ± 0.02 1.68 ± 0.02 1.71 0.03 1.8 1.76 1.77
Ca % 1.66 ± 0.21 1.79 ± 0.16 1.81 ± 0.18 1.75 0.08 4.7 1.88 1.84 1.78
Sc ppm 11.32 ± 0.02 11.09 ± 0.03 11.23 ± 0.03 11.21 0.12 1.1 11.23 11.27 10.9
V ppm 92.8 ± 3.1 95.7 ± 4.2 96.1 ± 3.8 94.9 1.8 1.9 99.5 98.2
Cr ppm 3600 ± 20 3570 ± 20 3630 ± 20 3600 30 0.9 3630 3640 3650
Mn ppm 1470 ± 50 1490 ± 60 1430 ± 60 1460 30 2.1 1450 1450 1460
Fe % 23.4 ± 0.1 23.8 ± 0.1 23.8 ± 0.1 23.7 0.2 1.0 23.7 23.7 23.7
Co ppm 661 ± 3 669 ± 4 655 ± 4 662 7 1.1 662 661 666
Ni % 1.42 ± 0.04 1.37 ± 0.03 1.41 ± 0.03 1.40 0.03 1.9 1.33 1.36 1.36
Zn ppm 114 ± 10 109 ± 10 118 ± 11 114 5 4.0 119 116 117
As ppm 1.51 ± 0.30 1.49 ± 0.20 1.56 ± 0.20 1.52 0.04 2.4 1.56 1.57 1.59
Se ppm 8.19 ± 0.34 8.29 ± 0.28 8.05 ± 0.30 8.18 0.12 1.5 8.23 8.17 8.27
Br ppb 1.50 ± 0.38 1.68 ± 0.42 1.53 ± 0.46 1.57 0.10 6.1 1.55 1.58 1.62
Sb ppb 84 ± 16 87 ± 19 81 ± 17 84 3 3.6 83 82 85
La ppb 537 ± 29 520 ± 21 532 ± 30 530 9 1.7 490 498 499
Sm ppb 335 ± 8 319 ± 7 327 ± 7 327 8 2.5 299 304 308
Eu ppb 115 ± 15 111 ± 14 117 ± 16 114 3 2.7 113 114 115
Yb ppb 320 ± 60 330 ± 50 320 ± 40 320 10 3.1 320 330 320
Lu ppb 44 ± 9 48 ± 8 46 ± 8 46 2 4.3 46 48 45
Os ppb 840 ± 90 790 ± 90 820 ± 90 820 30 3.1 828 833 812
Ir ppb 702 ± 5 707 ± 5 713 ± 5 707 6 0.8 785 789 757
Au ppb 141 ± 5 146 ± 4 143 ± 4 143 3 1.8 145 144 146
a
Kallemeyn and Wasson (1981)
b
Kallemeyn et. al. (1989)
c