Effect of sleep bruxism for central nervous system
(睡眠時ブラキシズムが中枢神経系へ及ぼす影響)
Mai Ikuta
Nihon University Graduate School of Dentistry at Matsudo Oral Function and Rehabilitation
(Director: Prof. Osamu Komiyama)
日本大学大学院松戸歯学研究科 顎口腔機能治療学専攻 生田 真衣
(指導:小見山 道 教授)
1
Ⅰ. Abstract
Ⅱ. Introduction
Ⅲ. Materials and Methods
Research1:Comparison of first jaw motor performance between bite task at anterior and posterior teeth
Research2:Impact of sleep bruxism on training-induced cortical plasticity
Ⅳ. Result
Research1:Comparison of first jaw motor performance between bite task at anterior and posterior teeth
1. Bite force value
2. Electromyography (EMG) root mean square (RMS) amplitude 3. Coefficient of variation value of EMG RMS amplitude
Research2: Impact of sleep bruxism on training-induced cortical plasticity 1. Screening of sleep bruxism
2. Motor evoked potential recordings 3. Tooth clenching task
Ⅴ. Discussion
Research1:Comparison of first jaw motor performance between bite task at anterior and posterior teeth
Research2:Impact of sleep bruxism on training-induced cortical plasticity
Ⅵ. Conclusion
Ⅶ. References
Ⅷ. Tables and Figures
2
Ⅰ. Abstract [Objective]
The aims of the present study were threefold: first, to compare the bite force and masticatory muscle activity between anterior and posterior teeth during first jaw motor performance, second to compare the motor evoked potential (MEPs) as a measure of corticomotor control of jaw-closing muscles between healthy participants and participants with sleep bruxism (SB), and third to compare the effect of a repeated tooth clenching task (TCT) on the excitability of the corticomotor representation of the human jaw musculature between the two groups using transcranial magnetic stimulation (TMS).
[Materials and methods]
Research 1: Twenty-six participants participated in two tooth bite tasks (a tooth bite task at the anterior teeth (ATB) and a tooth bite task at the right first molar (PTB)) and three target force levels (20%, 40% and 60% MVC). Before the measurement, participants performed a maximum tooth bite on a force meter to determine the 100%
MVC at anterior teeth and posterior tooth. During all task, electromyography (EMG) activities were recorded from left (LM) and right masseter muscle (RM), left (LT) and right temporalis muscle (RT) and bite force were recorded. The variability at each target force level and in each jaw motor task was determined as the coefficient of variation (CV) of the actual bite force activity and EMG activities.
Research 2: This study was consisted two experimental sessions (a screening session and a lab session) in 38 participants. In a screening session, all participants were divided into SB and control according to screening, clinical assessment, and instrumental evaluation. Finally, in total, 19 individuals with definite SB (9 men and 10
3
women, average age: 24 ± 3 years old) and 19 individuals with no consistent reports of SB (control group) (13 men and 6 women, average age: 27 ± 10 years old) participated in this study. In a lab session, participants performed tooth clenching task (TCT) at right first molar tooth for 58 minutes at 3 force level (10%, 20%, and 40% maximum voluntary contraction (MVC)) in a randomized order. TMS was performed immediately before TCT (pre-TCT session) and 5 minutes after TCT (post-TCT session).
[Result]
Research 1: Actual bite force values and EMG RMS amplitude in each muscle were significantly dependent on target force level during ATB and PTB (P < 0.01). CV values of actual bite force level in each jaw motor task were not significantly dependent on target force level or biting task. EMG RMS amplitude during ATB and PTB were significantly dependent on force level (P < 0.01).
Research 2: The masseter MEP in the control group at 120% and 160% were significantly higher than the SB group in the pre-TCT session (P < 0.05). The masseter MEP in the control group in the post-TCT session were significantly higher than pre-TCT session (P < 0.05). However there were no significant difference between pre- and post-TCT session in the SB group (P > 0.05). FDI were only dependent on stimulus intensity (P < 0.001).
[Conclusion]
These results suggest that the mechanism of force control with regard to jaw movements contributes masticatory muscle activity and periodontal receptors, and SB may be associated with a significant reduction in the excitability of corticomotor pathways related to the masseter muscle, impaired training-induced cortical neuroplasticity with some impact on force control mechanisms and masseter muscle
4 performance.
Ⅱ. Introduction
In daily life, humans unconsciously perform functional jaw movements (mastication, etc.). To elucidate the performance of jaw movements related to functional oral motor tasks, it is essential to investigate the coordination of jaw movements. Our previous study investigated the effects of repeated jaw-motor tasks on masseter muscle performance and demonstrated that repeated tooth clenching improves the performance of masseter muscles in terms of accuracy, but not maximum voluntary contraction [1]. Hellmann et al. suggested that the masticatory muscles are remarkably prone to motor adaptation [2]. In addition, some studies also demonstrated motor learning with regard to jaw movements at anterior teeth during biting [3,4]. However, no studies have compared bite force and masticatory muscles between anterior teeth and posterior teeth when humans perform simple jaw motor tasks.
On the other hand, some studies have demonstrated that when humans perform motor tasks on the first attempt, the muscle activation used to achieve the objective of the action does not typically use the muscles available in the most effective manner [5]. In jaw motor tasks, although some studies investigated the effects of repeated jaw motor tasks for bite force or masticatory muscle activity, no studies have investigated the first performance of a jaw motor task. To clarify the mechanisms of jaw movements, it is essential to investigate the first performance of a jaw motor task. The aim of this study was to compare the bite force and masticatory muscle activity between anterior and posterior teeth during first jaw motor performance.
Sleep bruxism (SB) is defined as a repetitive jaw-muscle activity characterized
5
by clenching or grinding of the teeth and/or by bracing or thrusting of the mandible during sleep [6]. To elucidate central processing mechanisms underlying SB in humans, identifying neuroplasticity in corticomotor control of the human jaw movements may be important. Some functional magnetic resonance imaging (fMRI) studies demonstrated the effect of self-reported bruxism and tooth-grinding behavior for brain activity during tooth-clenching or -grinding tasks [7,8]. These studies suggested a potential difference of central nervous system function between a group of individuals with self-reports of bruxism and a non-bruxism group. Our previous transcranial magnetic stimulation (TMS) study on healthy participants demonstrated that the performance of repeated standardized tooth clenching tasks (TCT) for 58 min on each of five consecutive days can trigger neuroplastic changes in the corticomotor control of jaw-closing muscles [9].
In addition, Zhang et al. suggested that the sensorimotor training of the jaw muscles induced signs of neuroplastic changes in the corticomotor pathways related to the masseter muscle in healthy participants [10]. These studies suggested that repeated jaw movements can trigger neuroplastic changes in the corticomotor control of jaw-closing muscles.However, to the best of our knowledge there has been no studies on cortical plasticity in individuals with self-reports, clinical findings as well as electromyography (EMG)-based screening consistent with SB.
In behavioral studies in humans it has previously been shown that force control mechanisms appear to be different between spinal and trigeminal muscle activity [1].
For trigeminal muscle activity, some studies have investigated the effect of repeated jaw motor tasks on performance in terms of accuracy and precision related to jaw force control mechanisms [11,12]. However, no studies so far have investigated the effect of SB on performance in terms of accuracy and precision related to force control
6
mechanisms during jaw movements. For a better understanding of SB behavior, it may be important to clarify corticomotor pathways and force control mechanisms.
The aims of the present study were threefold: first, to compare the bite force and masticatory muscle activity between anterior and posterior teeth during first jaw motor performance, second to compare the motor evoked potential (MEPs) as a measure of corticomotor control of jaw-closing muscles between healthy participants and participants with SB, and third to compare the effect of a repeated TCT on the excitability of the corticomotor representation of the human jaw musculature between the two groups using TMS.
Ⅲ. Materials and methods
Research 1: Comparison of first jaw motor performance between bite task at anterior and posterior teeth
This study was carried out in 26 participants [8 women and 18 men; mean age
± standard error of the mean = 28.6 ± 3.0 years]. Abnormal stomatognathic function or anterior open bite was excluded from this experiment. There were no participants with any medical, physical, or psychological problems. Informed consent was obtained from all participants before the experiment. The Institutional Ethics Committee approved the study (EC16-012), and the guidelines set out by the Declaration of Helsinki were followed.
This study consisted of two tooth bite tasks (a tooth bite task at the anterior teeth (ATB) and a tooth bite task at the right first molar (PTB)) and three target force levels (20%, 40% and 60% maximum voluntary contraction (MVC)). All participants sat upright and relaxed on a dental chair with their head supported by a headrest, and
7 performed each jaw motor task.
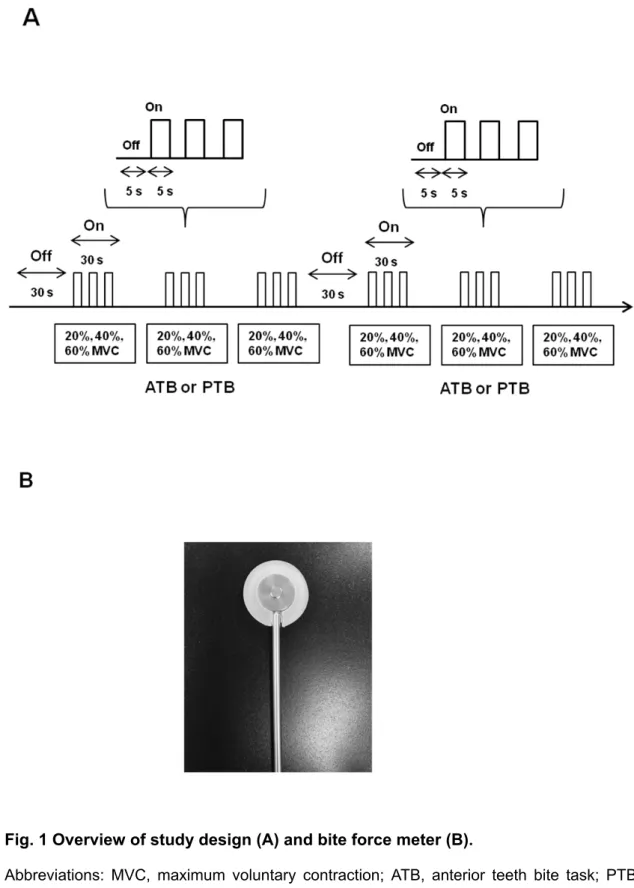
Before measurement, participants performed a maximum tooth bite on a force meter to determine the 100% MVC at the anterior teeth and posterior tooth. During all measurements, participants alternated between a 5-s rest-block and a 5-s task-block over a period of 30 s at a given auditory signal for each jaw motor task, which consisted of two jaw motor tasks and three target force levels (Fig.1 A). Three target force levels at 20%, 40%, and 60% MVC on ATB and PTB in randomized order were performed 3 times. To avoid masticatory muscle fatigue, a 30-s rest period was allowed between each jaw motor task.
A bite force meter (Unipulse F325 Digital Indicator, UNIPULSE, Tokyo, Japan) was used to measure bite force in each jaw motor task during all measurements. The design of the bite force meter (Fig. 1B) ensured that the force measurement was insensitive to the point of force applied onto the plate. A bite force meter was placed on the right side between the first molars or anterior teeth and supported by the participant during the jaw motor task. In this data analysis, initially, actual bite force value during each jaw motor task was quantified by calculation of the target force level in 5-s intervals from all participants. Second, the variability at each target force level and in each jaw motor task was determined as the coefficient of variation (CV) of the actual bite force activity.
In all measurements, electromyographic (EMG) activities were recorded during each jaw motor task. EMG activities were recorded from the left masseter (LM), right masseter (RM), left temporalis (LT), and right temporalis (RT) during ATB and PTB, using disposable bipolar surface electrodes (NM31; Nihon Kohden, Tokyo, Japan).
EMG signals were amplified 2000 times (PL3508 Power Lab 8/35, Bio research center,
8
Japan), filtered in the bandwidth 20 Hz to 1 kHz, sampled at 4 kHz and stored for off-line analysis.
In EMG data analysis, EMG activities during each jaw motor task were quantified by calculation of root mean square (RMS) EMG amplitude in each of the 5-s intervals from each EMG channel in all participants. Second, the variability at each target force level was determined as the CV of the EMG activity in each EMG channel.
All data were presented as mean values and standard error of the mean. The actual bite force value in each tooth bite task were analyzed using one-way ANOVA with target force level (20%, 40%, 60%, and 100% MVC). The CV value of actual bite force level between target force level and actual bite force values were analyzed using two-way ANOVA with target force level (20%, 40%, and 60% MVC) and tooth bite task (ATB and PTB).
The RMS EMG amplitudes in each muscle (masseter muscle and temporalis muscles) for each tooth bite task (ATB and PTB) were analyzed using two-way ANOVA with each target force level (20%, 40%, 60%, and 100% MVC) and side (left and right).
CV values of EMG RMS amplitude in each muscle (masseter muscle and temporalis muscle) in each tooth bite task (ATB and PTB) were analyzed using two-way ANOVA with each target force level (20%, 40%, and 60%) and side (left and right). When appropriate, ANOVA was followed by Bonferroni test to compensate for multiple comparisons. P values of less than 0.05 were considered to be significant.
Research 2: Impact of sleep bruxism on training-induced cortical plasticity
A total of 38 participants with normal stomatognathic function were recruited.
Exclusion criteria were any medical or psychological disorders, epilepsy, metal implants
9
in the head, a pacemaker, an implanted medicinal pump and pregnancy. Inclusion criteria were natural dentition in the first molar region and no ongoing pain in the face or any other reported chronic pain in the last 6 months. Informed consent was obtained from all participants before the experiment. The study was approved by the local ethics committee (approval No.1-10-72-417-17 Aarhus County, Denmark) and conducted in accordance with the Helsinki Declaration II.
The present study followed a three step procedure to offer the best characterization of individuals with SB [6] 1) Screening (Probable SB): self-reported SB or reported by sleep-partner of tooth-grinding noises, 2) Clinical assessment by a trained dentist: at least one or more of the following clinical signs: a) wear facets (grade
> 1), b) hypertrophy of the masseter muscle, c) evidence of wear on oral splint, d) hyperkeratosis of the cheek mucosa, e) teeth impressions on the tongue, lips or tooth, or tooth restorations fractures due to the bite forces, or sign or symptoms of traumatic occlusal contacts (Possible SB), 3) Instrumental evaluation: All the individuals were evaluated for seven nights via an ambulatory single-channel EMG device measuring temporal muscle activity (Grindcare3+, Sunstar Suisse, Etoy, Switzerland). If any participant had more than 4 recordings showing more than half of the sleeping hours with over 20 EMG events/hour, they were considered to be definite SB in this study [13].
Finally, in total, 19 individuals with definite SB (9 men and 10 women, average age: 24 ± 3 years old) and 19 individuals with no consistent reports of SB (control group) (13 men and 6 women, average age: 27 ± 10 years old) participated in this study.
All participants performed a standardized TCT consisting of three series for a total of 58 minutes according to our previous studies [9,11]. During TCT, participants were instructed to clench at their right first molar teeth on a force meter. A U-shaped
10
force meter (Aalborg University, Aalborg, Denmark) was used to measure actual force value. Before the TCT, participants performed a maximum tooth clench at their right first molar teeth on the force meter to determine the 100% maximum voluntary contraction (MVC). In the first and third series, participants were simply instructed to target different force levels without visual feedback. In the second series, visual feedback of the muscle activity level via a force meter was displayed to the participants on a monitor. One series consisted of three measurements (10%, 20% and 40% of the MVC), and one measurements consisted of one force level in a randomized order. During all measurements, participants alternated between a 30 s rest block and a 30 s task block for 360 s. In the task block, participants alternated between a 5 s rest block and a 5 s task block. For the data analysis, relative error between actual force value and target force level was calculated from the actual force value at each force level in each series to evaluate the accuracy of the performance. Second, the coefficient of variation (CV) was calculated from actual force value at each force level in each series to evaluate the precision at each target force level [14].
This study consisted of two sessions of MEP measurements by TMS: before the TCTs (pre-TCT session) and 5 min after the TCTs (post-TCT session). EMG activity from right first dorsal interosseous (FDI) muscles and the right masseter muscles were recorded with disposable bipolar surface electrodes (Neuroline 720, Ambu, Copenhagen, Denmark). The EMG signals were amplified 5000 times (Disa 15C01, DK), filtered in the bandwidth 10 Hz to 5 kHz for off-line analysis. During the recording of masseter MEPs, participants kept a special device between the anterior teeth [9,11] in order to secure constant pre-activation background of masseter, which is required for TMS to elicit a MEP [9,15,16]. The TMS was performed using a Magstim 200 stimulator
11
(Magstim Co., Whitland, Dyfed, UK) and a focal figure-of-eight stimulating coil. A flexible cap was placed over the head in a standardized way that was based on anatomical markers and in accordance with the International 10-20 electrode placement system. A coordinate system with a 1-cm location was drawn on the cap. The coil of the stimulator was oriented 45 degrees obliquely to the sagittal midline, so that the induced current flowed in a plane perpendicular to the scalp sites [9,17,18]. The scalp sites at which EMG responses were evoked in the FDI or masseter at the lowest stimulus strength were determined. The motor threshold (MT) of masseter and FDI muscles was measured and defined as the minimum stimulus intensity that produced 5 out of 10 discrete MEPs clearly discernible from the background EMG activity in each muscle [9,10]. Onset latency was measured on the non-rectified, averaged MEPs [9,17,19].
The MEPs were assessed by two methods: stimulus-response curves and motor cortex mapping as previously described [9,10,19]. Stimulus-response curves were constructed at 90% MT, 100% MT, 120% MT, and 160% MT. Twelve stimuli were presented at each stimulus level with an interstimulus interval of 10–15 s. For motor cortex mapping, TMS stimuli were delivered at the sites over the scalp identified by the snugly fitting, flexible cap marked with the 1 × 1 cm2 grid in an anterior-posterior and lateral-medial coordinate system [20]. The anterior-posterior grid lines relate to the vertex (Cz) in accordance with the 10-20 electroencephalographic (EEG) electrode placement system. The stimulator output was set at 120% MT, and eight stimuli were delivered to each site. The grid was stimulated in a regular pattern, beginning at the center of the “hot spot” and then moving anteriorly then posteriorly at increasing and decreasing latitudes; the sites typically covered 5 cm from the vertex and 5 cm anterior and posterior to the interaural line, corresponding to 25 grids. The motor cortex areas
12
(cm2) from which TMS evoked FDI and masseter MEPs having amplitudes greater than 10 µV (masseter), and 50 µV (FDI) were determined on the 1 × 1 cm2 grid. The coefficient of gravity (COG) was calculated in accordance with Ridding et al. [21].
All data are presented as mean values and standard deviation (SD). Number of EMG events during sleep, age and sex between the SB and control group were analyzed with a t-test. Relative error (accuracy) and CVs (precision) of the actual force values were analyzed with three-way ANOVA with target force level, series and group.
The motor thresholds of the masseter and FDI MEPs and onset latencies of the masseter and FDI MEPs at pre-TCT in both groups were analyzed with paired t-test.
The MEP amplitudes of the masseter and FDI MEPs were analyzed using three-way ANOVA with group, stimulus intensity and sessions as factors. The COG measures and MEP areas were analyzed using one-way analysis of variance (ANOVA). When appropriate, the ANOVAs were followed by post hoc Tukey tests to compensate for multiple comparisons. P values less than 0.05 were considered significant.
Ⅳ. Results
Research 1: Comparison of first jaw motor performance between bite task at anterior and posterior teeth
1. Bite force value
Fig.2 shows the actual bite force values for each force level during ATB and PTB. Actual bite force values were significantly dependent on target force levels during ATB and PTB (P < 0.001). Post-hoc tests demonstrated that actual bite force during 100% MVC was significantly higher than during 20%, 40%, and 60% MVC for each tooth bite task (P < 0.05), and that actual bite force during 60% MVC was significantly
13
higher than during 20% MVC for each tooth bite task (P < 0.05). Fig.3 shows CV values of actual bite force level for each jaw motor task. CV values of actual bite force level in each jaw motor task were not significantly dependent on target force level (P = 0.657) or tooth bite task (P = 0.506).
2. EMG RMS amplitude
Fig. 4 shows EMG RMS amplitude for each target force level at LM and RM (A) and LT and RT (B) during ATB, and PTB at LM and RM (C) and LT and RT (D) during PTB. EMG RMS amplitude during ATB and PTB were significantly dependent on target force level (P < 0.01). In ATB, post-hoc tests demonstrated that EMG RMS amplitude during 100% MVC was significantly higher than during 20%, 40%, and 60% MVC in LM and RM (P < 0.05) and EMG RMS amplitude during 100% MVC was significantly higher than during 20%, and 40% MVC in LT and RT (P < 0.05). In PTB, post-hoc tests demonstrated that EMG RMS amplitude during 100% MVC was significantly higher than during 20%, 40%, and 60% MVC in LM, RM, LT, and RT (P < 0.05).
3. CV value of EMG RMS amplitude
Fig.5 shows CV values of EMG RMS amplitude for each target force level at LM and RM (A) and LT and RT (B) during ATB and, PTB at LM and RM (C) and LT and RT (D) during PTB. CV values of EMG RMS amplitude at LM and RM were significantly dependent on target force level during PTB (P < 0.05). In PTB, CV values of EMG RMS amplitude during 40% MVC at LM and RM were significantly higher than during 20%
and 60% MVC (P < 0.05).
14
Research 2: Impact of sleep bruxism on training-induced cortical plasticity 1. Screening of bruxism
There was a significant difference in EMG events during sleep between SB (38.7 ± 15.1 EMG events/hour) and control group (13.6 ± 4.1; P < 0.001). There were no significant differences in age and sex between the SB and control group (P = 0.253, P = 0.199 respectively).
2. MEP recordings
For MEP recordings, the MTs of the masseter MEPs in the control group (38.4
± 2.9%) were significantly lower than in the SB group (41.1 ± 3.6%; P < 0.05). The MTs of the FDI MEPs in the SB group and control group were 39.2 ± 4.5%, 38.4 ± 4.7% (P = 0.601). The onset latencies of the masseter MEPs in the SB group and control group were 7.4 ± 0.2 ms and 7.4 ± 0.2 ms, respectively (P = 0.379). The onset latencies of the FDI MEPs in the SB group and control group were 26.9 ± 1.2 ms and 27.3 ± 0.8 ms, respectively (P = 0.512). For the stimulus-response curves, the masseter MEPs were significantly dependent on group (P < 0.01), stimulus intensity (P < 0.001) and session (P < 0.05). The masseter MEPs in the control group at 120% and 160% MT were significantly higher than in the SB group in the pre-TCT session (P < 0.05). The masseter MEPs of the control group in the post-TCT session were significantly higher than the pre-TCT session (P < 0.05), however, there were no differences in the amplitude of the masseter MEPs between pre- and post-TCT session in the SB group (P
> 0.05) (Fig. 6A).
The FDI MEPs were dependent on stimulus intensity (P < 0.001) but not group or task session (P = 0.788 and P = 0.133 respectively) (Fig. 6B). For motor cortex
15
maps, there were significantly larger masseter MEP motor cortex map areas in the pre-TCT session in control group (20.8 ± 2.7 mm2) than in the SB group (17.4 ± 4.8 mm2) (P < 0.05). The masseter MEP motor cortex maps in the post-TCT session were also significantly larger in the control group (21.7 ± 3.1 mm2) than in the SB group (17.2
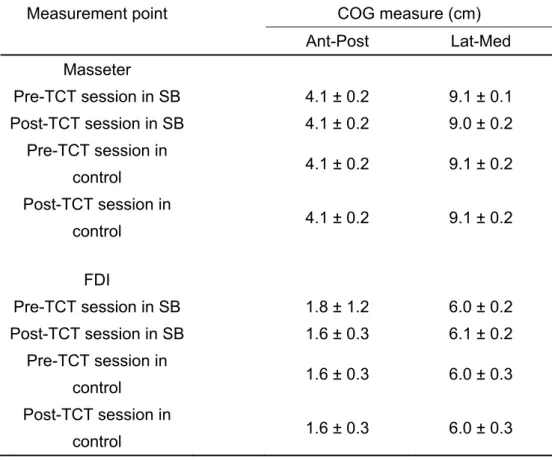
± 4.1 mm2) (P < 0.05). There were no significant differences in FDI MEP areas between the pre- and –post TCT session in any groups (Fig. 7 and Table 1). There were no significant changes amongst task sessions and groups for any of the COG outcomes (Table 2).
3. Tooth clenching task (TCT)
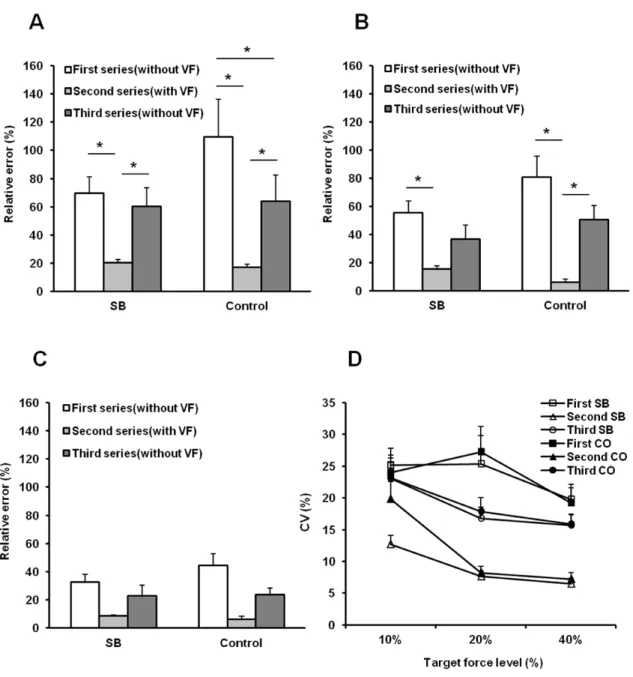
Accuracy between actual force value and target force level was significantly dependent on the series and target force level (P < 0.001, P < 0.001 respectively) but not group (P = 0.333). Accuracy in the second series was significantly higher (i.e., relative error was smaller) than in the first series at 10% and 20% MVC in both groups (P < 0.05). Although accuracy in the second series were significantly higher than in the third series at 10% and 20% MVC in the control group (P < 0.05), accuracy in the second series were significantly higher than in the third series only at 10% MVC in the SB group (P < 0.05). Accuracy in the third series were significantly higher than in the first series at 10 % MVC in the control group (P < 0.001) (Fig. 8A). Precision was significantly dependent on the series and target force level (P < 0.001, P < 0.05 respectively) but not group (P = 0.986). Precision in the second series were significantly higher (i.e., coefficient of variation was lower) than in the first and third series in both groups (P < 0.001) (Fig. 8D).
16
Ⅴ. Discussion
Research 1: Comparison of first jaw motor performance between bite task at anterior and posterior teeth
This study compared the bite force and masticatory muscle activities between anterior teeth and posterior tooth during first jaw motor performance. Actual force values, EMG RMS amplitude, and CV values of actual bite force were significantly dependent on target force level in ATB and PTB. Although CV values of EMG RMS amplitude in masseter muscles during PTB were significantly dependent on target force level, CV values of EMG RMS amplitude in masseter muscles during PTB and masseter and temporalis muscles during ATB were not.
Our previous studies investigated the effects of repeated tooth bite tasks on the first molars with device or tooth clenching tasks without device on masseter muscle accuracy performance and demonstrated that repeated tooth clenching tasks improve the performance of masseter muscles in terms of accuracy but not MVC [2]. On the other hand, some studies demonstrated motor learning in the tooth bite task at anterior teeth [3,4]. These studies suggested that repeated jaw motor tasks lead to motor learning in jaw motor performance, regardless of anterior or posterior teeth. The present study demonstrated that actual force values, EMG RMS amplitude, and CV values of actual bite force did not differ between ATB and PTB during the first jaw motor performance. The present study suggests that the mechanism of control in the jaw motor task was similar between ATB and PTB.
Our previous study showed that repeated tooth clenching can trigger neuroplastic changes in the central nervous system [9]. This finding suggests that if humans perform jaw motor tasks in their daily lives, the central nervous system
17
undergoes neuroplastic changes. Further studies are needed to investigate the effects of oral behavior (e.g., waking or sleep-related bruxism) for the first jaw motor performance during ATB and PTB.
In comparison of the occlusal contact area in individual teeth, the occlusal contact area at the first molar was higher than at the front tooth [22]. However, the present study showed that force values, EMG RMS amplitude, and CV values of actual bite force during jaw motor performance was not different between ATB and PTB. On the other hand, periodontal receptors contribute positive feedback to the jaw-closing muscles during mastication [23]. Although a force meter was placed on the right side between the first molars or anterior teeth during jaw motor task in the present study, it suggested that force control of jaw movements was regulated by periodontal receptors, not occlusal receptors.
Interestingly, CV values of EMG RMS amplitude in masseter muscle during PTB were significantly dependent on target force levels, but not the temporalis muscle during PTB, or the masseter muscle and temporalis muscle during ATB. However, CV values of actual bite force levels in each jaw motor task were not significantly dependent on target force levels. Although our previous study showed that CVs of RMS EMG amplitude from masticatory muscles were significantly influenced by visual feedback [1], the present study did not apply visual feedback during jaw motor tasks. The present study suggests that the mechanism of force control of jaw movements contributes between masticatory muscle activities and periodontal receptors. To clarify the force control of jaw movements, further studies are needed to investigate the contribution of periodontal receptors and masticatory muscle activity to the force control of jaw movements.
18
In clinical settings, several studies have demonstrated the usefulness of contingent electrical stimulation based on EMG activities on a portable device for patients with sleep bruxism [24]. To evaluate the number of sleep bruxism events from temporalis EMG activities using this portable device, participants perform 60% MVC tooth clenching without feedback, and the threshold value of sleep bruxism set at 20%
MVC. As the present study demonstrates that actual force values and EMG RMS amplitude are significantly dependent on target force levels in ATB and PTB at first performance, our results suggest that 60% MVC tooth clenching without feedback is reliable when participants use this portable device.
Research 2: Impact of sleep bruxism on training-induced cortical plasticity This TMS study for the first time demonstrated that definite SB was associated with significant changes in the excitability of corticomotor control of jaw closing muscles, but not of a hand muscle. In addition, repeated and standardized TCTs triggered significant changes in the excitability of corticomotor control of jaw closing muscles in the control group, but not in the SB group. In terms of the behavioral data for the TCT, only the control group demonstrated a significant decrease in the relative error (i.e., improved accuracy) at the lowest TCT level (10% MVC).
Byrd et al. showed that the overall extent of activated cortical areas during tooth-clenching and –grinding was reduced in participants with self-reported bruxism compared with a control group [7]. Wong et al. also showed that the participants without a tooth-grinding behavior showed a more extensive activity in the supplementary motor area during tooth-clenching than those with a tooth-grinding behavior [8]. These studies suggest that unconscious jaw motor behavior in patients with sleep or awake bruxism is
19
associated with specific alterations in the central nervous system. Our present study compared the MEPs in the corticomotor control of jaw-closing muscles between a control group and participants with definite SB, and demonstrated that the masseter MEPs in the control group at 120% and 160% MT were significantly higher than in SB group in the pre-TCT session. Moreover, there were significantly larger masseter MEP motor cortex map areas at the pre-TCT session in the control group than in SB group. In addition, the MTs of the masseter MEP in the control group were significantly lower than in SB group. Our present findings suggest that SB is associated with significant decreases in the excitability of corticomotor control of jaw closing muscles but not of a hand muscle. Although our results demonstrated that there was a significant difference in EMG events during sleep between groups, EMG events during sleep in the control group was not zero in accordance with the view that some degree of low level jaw muscle activity during sleep is a normal physiological finding [25]. Further investigations may examine if the frequency or intensity of jaw muscle activity during sleep will have an impact on cortical plasticity and underlying mechanism of sleep bruxism. For jaw movements, our previous studies showed that repeated jaw motor tasks on 5 consecutive days or within 1 hour can trigger neuroplastic changes related to jaw closing muscle in the central nervous system [9,10]. Although our previous study did not divide into two groups according to SB, the present study clearly demonstrates the need in future studies to distinguish between the clinical phenotypes of bruxism. The present results showed that the masseter MEPs in control group at the post-TCT session were significantly higher than the pre-TCT session, however, the masseter MEPs in the SB group demonstrated a remarkable lack of effect of the TCT. The present findings may therefore indicate that SB performed in daily life may be associated with a reduced
20
propensity to undergo neuroplastic changes in response to specific tooth-clenching tasks, perhaps because neuroplastic changes may already have occurred and there is no functional need for the central nervous system to react to the task.
Our previous study suggested that repeated jaw motor tasks on 5 consecutive days improves the accuracy of the performance of masseter muscles [11]. On the other hand, the previous study investigated the effects of repeated jaw motor tasks on masseter muscle performance within 1 day, and demonstrated that the accuracy of actual force values were not significantly influenced by the training task [1]. However, these previous studies did not apply specific criteria for SB. In the present study, there were no significant differences in accuracy between the groups. However, post-hoc comparisons showed that although accuracy in the second series were significantly lower than in the third series at 10% and 20% MVC in the control group, and accuracy in the second series were significantly lower than in the third series only at 10% MVC in the SB group. Importantly, accuracy in the third series was significantly lower than in the first series at 10% MVC in the control group indicating an improvement accuracy following the TCT. Additionally, there was a no significant difference in accuracy at 40%
MVC between each series. Our present results may suggest that SB is associated with not only significant neuroplasticity changes but also motor learning of jaw movements and force control during low level contractions.
The present TMS study investigated the masseter and FDI MEPs by TMS as a measure of the corticomotor control. Recently, some studies applied combined structural MRI by voxel-based morphometry (VBM) and TMS related to a hand motor task and eye blinks [26]. In the dental literature, Kobayashi et al. investigated the effect of tooth loss on brain structures using MRI by VBM [27]. Brain structure analysis using
21
MRI by VBM may be useful to further clarify the effect of specific oral conditions for central nervous system function. Further studies are needed to investigate the effect of SB on brain structures using MRI by VBM to better understand the mechanisms of SB in the central nervous system.
Ⅵ. Conclusion
These results suggest that the mechanism of force control with regard to jaw movements contributes masticatory muscle activity and periodontal receptors, and SB may be associated with a significant reduction in the excitability of corticomotor pathways related to the masseter muscle and impaired training-induced cortical neuroplasticity with some impact on force control mechanisms and masseter muscle performance.
22
Ⅶ. References
1. Iida T, Komiyama O, Obara R, Baad-Hansen L, Kawara M, Svensson P. Influence of visual feedback on force-EMG curves from spinally innervated versus trigeminally innervated muscles. Arch Oral Biol 2013;58:331-9.
2. Hellmann D, Giannakopoulos NN, Blaser R, Eberhard L, Rues S, Schindler HJ.
Long-term training effects on masticatory muscles. J Oral Rehabil 2011;38(12):912-20.
3. Kumar A, Svensson KG, Baad-Hansen L, Trulsson M, Isidor F , Svensson P.
Optimization of jaw muscle activity and fine motor control during repeated biting tasks. Arch Oral Biol 2014;59:1342-51.
4. Zhang H, Kumar A, Luo X, Svensson K, Trulsson M, Svensson P. Effect of short-term training on fine motor control in trigeminally innervated versus spinally innervated muscles. Hum Mov Sci 2018;58:132-9.
5. Shemmell J, Tresilian JR, Riek S, Barry BK, Carson RG: Neuromuscular adaptation during skill acquisition on a two degree-of-freedom target-acquisition task: dynamic movement. J Neurophysiol, 94: 3058–3068, 2005.
6. Lobbezoo F, Ahlberg J, Glaros AG, Kato T, Koyano K, Lavigne GJ, et al. Bruxism defined and graded: an international consensus. J Oral Rehabil 2013;40:2-4.
7. Byrd KE, Romito LM, Dzemidzic M, Wong D, Talavage TM. fMRI study of brain activity elicited by oral parafunctional movements. J Oral Rehabil 2009;36:346-61.
8. Wong D, Dzemidzic M, Talavage TM, Romito LM, Byrd KE. Motor control of jaw movements: an fMRI study of parafunctional clench and grind behavior. Brain Res 2011;1383:206-17.
23
9. Iida T, Komiyama O, Obara R, Baad-Hansen L, Kawara M, Svensson P. Repeated clenching causes plasticity in corticomotor control of jaw muscles. Eur J Oral Sci 2014;122:42-8.
10. Zhang H, Kumar A, Kothari M, Luo X, Trulsson M, Svensson KG, et al. Can short-term oral fine motor training affect precision of task performance and induce cortical plasticity of the jaw muscles? Exp Brain Res 2016;234:1935-43.
11. Iida T, Komiyama O, Honki H, Komoda Y, Baad-Hansen L, Kawara M, et al. Effect of a repeated jaw motor task on masseter muscle performance. Arch Oral Biol 2015;60:1625-31.
12. Kumar A, Tanaka Y, Grigoriadis A, Grigoriadis J, Trulsson M, Svensson P.
Training-induced dynamics of accuracy and precision in human motor control. Sci Rep 2017;7:6784.
13. Stuginski-Barbosa J, Porporatti AL, Costa YM, Svensson P, Conti PC. Diagnostic validity of the use of a portable single-channel electromyography device for sleep bruxism. Sleep Breath 2016;20:695-702.
14. Kumar A, Tanaka Y, Grigoriadis A, Grigoriadis J, Trulsson M, Svensson P.
Training-induced dynamics of accuracy and precision in human motor control. Sci Rep 2017;7:6784.
15. Macaluso GM, Pavesi G, Bonanini M, Mancia D, Gennari PU. Motor-evoked potentials in masseter muscle by electricaland magnetic stimulation in intact alert man. Arch Oral Biol 1990;35:623-28.
16. Ortu E, Deriu F, Suppa A, Giaconi E, Tolu E, Rothwell JC. Intracortical modulation of cortical-bulbar responses for the masseter muscle. J Physiol 2008;586:3385-404.
24
17. Svensson P, Romaniello A, Arendt-Nielsen L, Sessle BJ. Plasticity in corticomotor control of the human tongue musculature induced by tongue-task training. Exp Brain Res 2003;152:42-51.
18. Baad-Hansen L, Blicher JU, Lapitskaya N, Nielsen JF, Svensson P. Intra-cortical excitability in healthy human subjects after tongue training. J Oral Rehabil 2009;36:427–34.
19. Komoda Y, Iida T, Kothari M, Komiyama O, Baad-Hansen L, Kawara M, et al.
Repeated tongue lift movement induces neuroplasticity in corticomotor control of tongue and jaw muscles in humans. Brain Res 2015;1627:70-9.
20. Wilson SA, Thickbroom GW, Mastaglia FL. Transcranial magnetic stimulation mapping of the motor cortex in normal subjects. The representation of two intrinsic hand muscles. J Neurol Sci 1993;118:134–44.
21. Ridding MC, Brouwer B, Miles TS, Pitcher JB, Thompson PD. Changes in muscle responses to stimulation of the motor cortex induced by peripheral nerve stimulation in human subjects. Exp Brain Res 2000;131:135-43.
22. Nishimori H, Iida T, Kamiyama H, Komoda Y, Obara R, Uchida T, Kawara M, Komiyama O. Comparing the occlusal contact area of individual teeth during low-level clenching. J Oral Sci 2017;59(3): 337-42.
23. Lavigne G, Kim JS, Valiquette C, Lund JP. Evidence that periodontal pressoreceptors provide positive feedback to jaw closing muscles during mastication. J Neurophysiol 1987;58(2): 342-58.
24. Jadidi F, Castrillon E, Svensson P. Effect of conditioning electrical stimuli on temporalis electromyographic activity during sleep. J Oral Rehabil 2008;35(3):171-83.
25
25. Lobbezoo F, Ahlberg J, Raphael KG, Wetselaar P, Glaros AG, Kato T, et al.
International consensus on the assessment of bruxism: report of a work in progress.
J Oral Rehabil 2018;45:837-44.
26. Granert O, Peller M, Gaser C, Groppa S, Hallett M, Knutzen A, et al. Manual activity shapes structure and function in contralateral human motor hand area. Neuroimage 2011;54:32-41.
27. Kobayashi T, Kubota M, Takahashi T, Nakasato A, Nomura T, Furuya J, et al.
Effects of tooth loss on brain structure: a voxel-based morphometry study. J Prosthodont Res 2018;62:337-41.
26
Ⅷ. Table and Figures
Table 1 Motor cortex map area from the masseter muscle and the FDI muscle cortical motor maps
Measurement point Motor cortex map area (㎠) Pre-TCT session Post-TCT session Masseter in SB 17.4 ± 4.8 17.2 ± 4.1 Masseter in control 20.8 ± 2.7 21.7 ± 3.1
FDI in SB 17.9 ± 5.2 16.8 ± 5.5
FDI in control 18.4 ± 6.1 20.1 ± 4.5 Means ± SD
FDI, first dorsal interosseous; TCT, tooth clenching task; SB, sleep bruxism
27
Table 2 Center of gravity (COG) measures from the masseter muscle and the FDI muscle cortical motor maps
Measurement point COG measure (cm)
Ant-Post Lat-Med
Masseter
Pre-TCT session in SB 4.1 ± 0.2 9.1 ± 0.1
Post-TCT session in SB 4.1 ± 0.2 9.0 ± 0.2
Pre-TCT session in
control 4.1 ± 0.2 9.1 ± 0.2
Post-TCT session in
control 4.1 ± 0.2 9.1 ± 0.2
FDI
Pre-TCT session in SB 1.8 ± 1.2 6.0 ± 0.2
Post-TCT session in SB 1.6 ± 0.3 6.1 ± 0.2
Pre-TCT session in
control 1.6 ± 0.3 6.0 ± 0.3
Post-TCT session in
control 1.6 ± 0.3 6.0 ± 0.3
Means ± SD
COG, center of gravity; FDI, first dorsal interosseous; TCT, tooth clenching task; SB, sleep bruxism; Ant- Post, anterior-posterior; Lat-Med, lateral-medial.
28
Fig. 1 Overview of study design (A) and bite force meter (B).
Abbreviations: MVC, maximum voluntary contraction; ATB, anterior teeth bite task; PTB, posterior tooth bite task.
29
Fig. 2 Comparison of actual bite force values in each target force level during ATB and PTB.
Abbreviations: ATB, anterior teeth bite task; PTB, posterior tooth bite task
* P < 0.05
30
Fig. 3 Comparison of CV values of actual bite force level in each target force level during ATB and PTB.
Abbreviations: CV, coefficient of variation; ATB, anterior teeth bite task; PTB, posterior tooth bite task.
31
32
Fig 4. Comparison of EMG RMS amplitude in each target force level in masseter muscles during ATB (A), temporalis muscles during ATB (B), masseter muscles during PTB (C), and temporalis muscles during PTB (D).
Abbreviations: EMG, electromyography; RMS, root mean square; ATB, anterior teeth bite task; PTB, posterior tooth bite task; LM, left masseter muscle; RM, right masseter muscle;
LT left temporalis muscle; RT, right temporalis muscle.
33
34
Fig. 5Comparison of CV values of EMG RMS amplitude in each target force level in masseter muscle during ATB (A), temporalis muscle during ATB (B), masseter muscle during PTB (C), and temporalis muscle during PTB (D).
Abbreviations: CV, coefficient of variation; EMG, electromyography; RMS, root mean square; ATB, anterior teeth bite task; PTB, posterior tooth bite task; LM, left masseter muscle; RM, right masseter muscle; LT left temporalis muscle; RT, right temporalis muscle.
* P < 0.05.
35
Fig. 6 Stimulus–response curves obtained by TMS of the masseter motor cortex (A) and FDI motor cortex (B) (means ± SD) in individuals with sleep bruxism (SB) and a control group.
* Significantly higher masseter MEPs at post-TCT session compared with pre-TCT session in control group (P < 0.05, Tukey).
# Significantly higher masseter MEPs at pre-TCT session in control group compared with pre-TCT session in SB (P < 0.05, Tukey).
36
37
Fig. 7 Masseter (A) and FDI (B) motor cortex maps by TMS at multiple scalp sites arranged in a 1×1 cm grid.
Arrows indicate directions (A anterior, P posterior, M medial, L lateral). Zero on the Y-axis corresponds to the Cz line (interaural line).
Cz, vertex; FDI, first dorsal interosseos; SB, sleep bruxism; TCT, tooth clenching task; TMS, transcranial magnetic stimulation.
38
Fig. 8 Accuracy between actual force value and target force level at 10%
maximum voluntary contraction (MVC) (A), 20% MVC (B) and 40% MVC (C) in individuals with sleep bruxism (SB) and a control group.
Precision expressed as coefficient of variation (CV) of actual force value at each force level in each series is displayed in (D).
* P < 0.05, Tukey
SB, sleep bruxism group; CO, control group.