Part I Demand and Institutions: The Industry Environment in China. Chapter 1 Demand
権利 Copyrights 日本貿易振興機構(ジェトロ)アジア
経済研究所 / Institute of Developing
Economies, Japan External Trade Organization (IDE‑JETRO) http://www.ide.go.jp
シリーズタイトル(英 )
ASEDP
シリーズ番号 75
journal or
publication title
Pharmaceutical Industry in China‑Intellectual Property Protection, Pricing and Innovation‑
page range [13]‑22
year 2007
URL http://hdl.handle.net/2344/00015889
Part I.
Demand and Institutions: The Industry Environment in China
Chapter 1
Demand
1.1 Size and structure of Demand
In 2005, The entire medical expenditure in China was 759 billion RMB (US$99 billion), which was about one third of Japan’s expenditure, 3.24 trillion JPY (US$270 billion).
The population of Japan is around 0.12 billion, which is about one tenth of the Chinese population. China’s per capita medical expenditure, therefore, is almost one thirtieth of Japan’s.
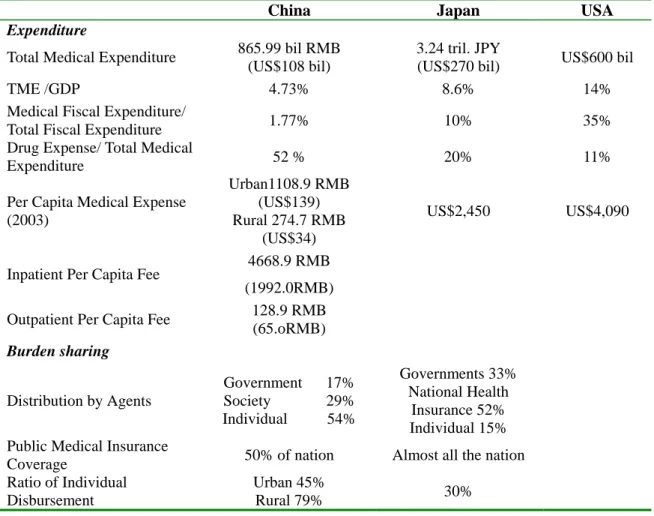
Table 1 presents figures related to the size of medical expenditure. Indexes for health achievement reveal that China has seen relatively good performance as a developing economy: life expectancy is almost ten years less than Japan and the US, but it is at almost the same level as Thailand. Infant mortality substantially decreased from 34.7‰ in 1981 to 28.4‰. The proportion of the population aged 65 or above is smaller than Japan and the US, but it is expected to grow faster. However, China is still distant from Japan or the US in terms of these indexes. Coincidently, China’s medical expenditure is smaller that these countries in terms of ratio to GNP, per capita expense or medical expenses among the whole fiscal expenditure. On the other hand, China’s share of drug expenditure among total medical expenditure (52%) is much higher than Japan (20%) and the US (11%).
The burden on the individual to share in medical expenditure is much larger than in the two developed economies. The Chinese government sectors only bears 17% of the cost, while the Japanese government and compulsory medical insurance cover 85% of medical fees. About half the population is not medically insured.
Table 1: Medical Expenditures of China, Japan and the US
China Japan US
Health Achievement Life Expectancy
Male: 69.63 Female: 76.33
(2000)
Male: 78.53 Female: 85.59
(2005)
Male: 74.8 Female: 80.1
(2003)
Infant Mortality 19.0‰ 3.0‰ 6.9‰
(2000) (2002) (2001)
Proportion of the Population aged 65 above
7.7%
(2005)
19.6%
(2005)
12.3%
(2005) (Source) China: China Health Statistical Yearbook 2005 and Ministry of Labor and Social
Service Insurance. Japan: Ministry of Health, Labor and Welfare website.
Table 2: Medical Expenditures of China, Japan and the US (2005)
China Japan USA Expenditure
Total Medical Expenditure 865.99 bil RMB (US$108 bil)
3.24 tril. JPY
(US$270 bil) US$600 bil
TME /GDP 4.73% 8.6% 14%
Medical Fiscal Expenditure/
Total Fiscal Expenditure 1.77% 10% 35%
Drug Expense/ Total Medical
Expenditure 52 % 20% 11%
Per Capita Medical Expense (2003)
Urban1108.9 RMB (US$139) Rural 274.7 RMB
(US$34)
US$2,450 US$4,090
Inpatient Per Capita Fee 4668.9 RMB (1992.0RMB) Outpatient Per Capita Fee 128.9 RMB
(65.oRMB) Burden sharing
Distribution by Agents
Government 17%
Society 29%
Individual 54%
Governments 33%
National Health Insurance 52%
Individual 15%
Public Medical Insurance
Coverage 50% of nation Almost all the nation Ratio of Individual
Disbursement
Urban 45%
Rural 79% 30%
(Source) The industrial map of China Pharmaceuticals 2006-07, Social Sciences Academic Press.
1.2 OTC Drugs and Prescriptions
The channels for drugs sales are prescriptions at hospital and OTC (Over the Counter) drugs. For OTC sales, the State Drug Administration has continuously announced sine 1999 the “Catalogue of OTC Drugs” to be registered, with distinct control over prescription drugs, which are drugs registered under the “Drug Registration
Management Law.” OTC drugs are required to be sold to patients by pharmacist over the counter. However, as Table 3 shows, the number of pharmacists is far smaller, almost one third of the number of physicians, thus in practice they are sold in the same way as an ordinary commodity at supermarkets.
The proportion of prescription drugs is around 70% of total pharmaceutical sales in China, and OTC takes up around 30% (Interview with Chemical Drug Manufacture’s Association in November 2006), although the latter has been steadily increasing over these years. Thus, for most pharmaceutical firms in China, physicians in hospitals are the buyers who have right to decide whether the hospital orders a particular drug, and they prescribe the drugs as an agent of the patient.
Table 3: Sales Routes for Drugs
Prescription OTC
Sales Route Manufacture → Wholesaler → Hospital
Manufacture → Wholesaler → Drug Store
Who
Prescribes?
Physicians Pharmacists
# of Physicians 1,555,658 (2005)
#of Hospital 65,000 (2005)
# of Pharmacists 349,533 (2005) Who Pays? Medical insurance/ patients Patient
# of Drugs 3, 214*1 4,279 (2005)
Sales Volume 150.4 billion RMB (2005) 78.2 billion RMB (2005)
(Source) Ministry of Health website. Japan, Wikipedia, Medicine (China). Japan Pharmaceutical Manufacturers Association, Information on China’s pharmaceuticals (in Japanese).
(Note) *1: number of drugs on the China Pharmaceutical Catalogue.
1.3 Medical Insurance Plans and Their Drug Catalogues
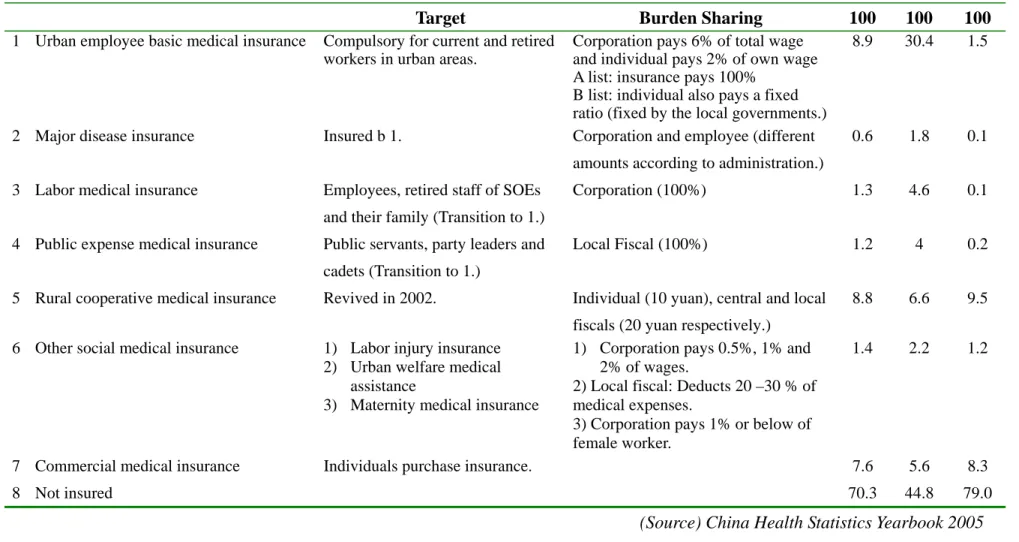
There are two classifications of ultimate drug purchasers: the medical insurers and patients. Currently, there coexists about 7 types of medical insurance plans, but around 50% of population is not insured (Table 4).
In 1997, the Central Committee of the Communist Party and the State Council
announced the “Decision on Health Sector Reform and Development,” and the Urban Employee Basic Medical Insurance (城市基本医疗保险: UEBMI), or the National Basic Medical Insurance, was launched by the State Council in 1998. This is the country’s compulsory medical insurance plan but it has not yet been legislated, even in 2007, and its coverage is still limited as corporations are reluctant to pay the premiums.
However, the UEBMI is currently the largest medical insurance plan in China, although it covers only 30% of the urban population (or less than 10% of the total population).
Big Disease Medical Insurance complements those insured under the UEBMI, covering expensive medical services. For the urban population, there used to be two medical insurance plans: the Public Expense Medical Insurance (公费医疗保险) and Labor Medical Insurance (劳保医疗保险), both established in 1951. The former is disbursed by the local government’s fiscal budget, while the latter is disbursed by the corporations, or State Owned Enterprises. Both cover 100% of medical fees for the insured and a proportion of the fees for their families. After of the UEBMI was set up in 1998, these two insurance plans are intended to gradually transition to the UEBMI.
In rural areas, cooperative medical insurance plans were set up in the 1940s accompanying the People’s Commune (人民公社), but that decayed in the 1980s. The State Council announced the “Decision on Strengthening the Health Care System in Rural Areas,” in 2002, and the “Announcement on the New Rural Cooperative Medical System.” By the end of 2006, 0.508 billion people in the 1451 counties joined the insurance plan. In 2006, the participation ratio was 80%, although it was on a voluntary basis, and the insurance plan reimbursed 15.581 billion RMB. Currently, these 3 types, UEBMI, the Public Expense Medical Insurance and the Rural Cooperative Medical Insurance are the main insurance plans that cover the population in China.
Table 4: Medical Insurance Plans and Their Coverage (2004)
Total Urban Rural
Target Burden Sharing 100 100 100
1 Urban employee basic medical insurance Compulsory for current and retired workers in urban areas.
Corporation pays 6% of total wage and individual pays 2% of own wage A list: insurance pays 100%
B list: individual also pays a fixed ratio (fixed by the local governments.)
8.9 30.4 1.5
2 Major disease insurance Insured b 1. Corporation and employee (different amounts according to administration.)
0.6 1.8 0.1
3 Labor medical insurance Employees, retired staff of SOEs and their family (Transition to 1.)
Corporation (100%) 1.3 4.6 0.1
4 Public expense medical insurance Public servants, party leaders and cadets (Transition to 1.)
Local Fiscal (100%) 1.2 4 0.2
5 Rural cooperative medical insurance Revived in 2002. Individual (10 yuan), central and local fiscals (20 yuan respectively.)
8.8 6.6 9.5
6 Other social medical insurance 1) Labor injury insurance 2) Urban welfare medical
assistance
3) Maternity medical insurance
1) Corporation pays 0.5%, 1% and 2% of wages.
2) Local fiscal: Deducts 20 –30 % of medical expenses.
3) Corporation pays 1% or below of female worker.
1.4 2.2 1.2
7 Commercial medical insurance Individuals purchase insurance. 7.6 5.6 8.3
8 Not insured 70.3 44.8 79.0
(Source) China Health Statistics Yearbook 2005
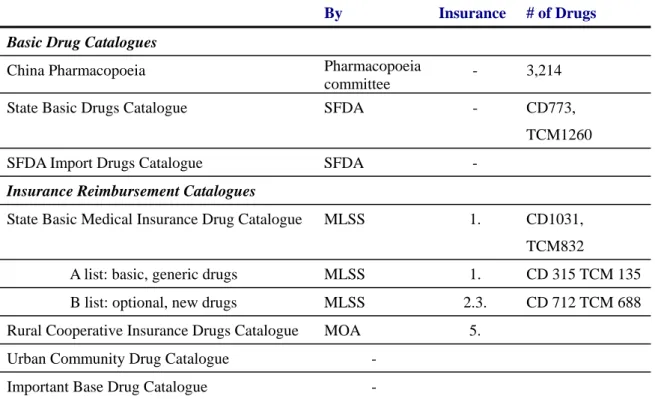
These parallel medical insurance systems provide parallel drug catalogues, which leads to a complicated demand structure for drugs in China. In China, there are three basic drug catalogues: the China Pharmacopoeia, the State Basic Drug Catalogue (issued by the State Food and Drug Administration) and the SFDA Import Drug Catalogue.
UEBMI complies an insurance redemption list consisting of 1,031 chemical drugs and 832 Traditional Chinese Medicines (2004 version). Rural cooperative insurances or the urban community also compile their own drug catalogues. Practically, from the point of pharmaceutical firms, the insurance redemption list of UEBMI is the most important drug catalogue.
Table 5: Drug Catalogues
By Insurance # of Drugs Basic Drug Catalogues
China Pharmacopoeia Pharmacopoeia
committee - 3,214
State Basic Drugs Catalogue SFDA - CD773,
TCM1260
SFDA Import Drugs Catalogue SFDA -
Insurance Reimbursement Catalogues
State Basic Medical Insurance Drug Catalogue MLSS 1. CD1031, TCM832
A list: basic, generic drugs MLSS 1. CD 315 TCM 135 B list: optional, new drugs MLSS 2.3. CD 712 TCM 688 Rural Cooperative Insurance Drugs Catalogue MOA 5.
Urban Community Drug Catalogue - Important Base Drug Catalogue -
(Source) State basic drugs list, State Food Drug Administration. State Basic Medical Insurance Drug Catalogue, Ministry of Labor, Social Securities. Wikipedia, Medicine (China), Japan Pharmaceutical Manufacturers Association, Information on China’s pharmaceuticals (in Japanese).
(Note) CD=chemical drugs, TCM= traditional Chinese medicine, SFDA=State Food and Drug Administration, MLSS=Ministry of Labor and Social Security
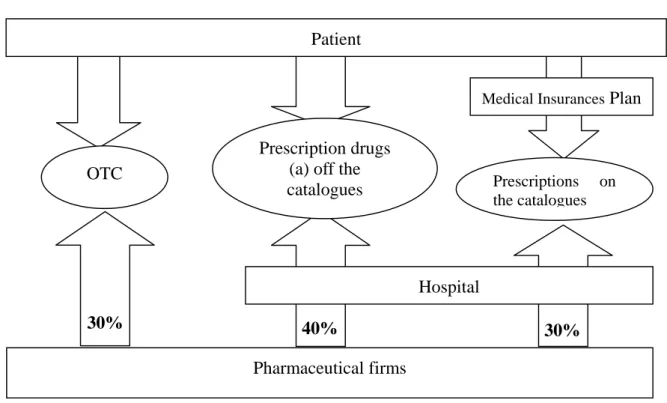
In Figure 1, we draw a rough flow of the drug demand to see who purchases how many of the drugs in China. Though there is no exact data for this, we estimated the ratio of burden sharing by the medical insurance and the patients as follows: OTC drugs, whose
share of the drug market is 30% as we already saw in Section 1.2, is 100% self paid by patient. The share of individual payment in this drug market is 0.3*1=30%. The payment of prescription drugs, which takes up a 70% share of the market, is covered by the insurance reimbursement and payment by the patients themselves. The medical insurance covers 50% of population, that is 50% of prescription drugs. Furthermore the insurance reimbursement ratio is less than 100%, but we have no exact data - we have assumed here 80%. Thus, medical insurance purchases 0.7*0.5*0.8=30% of total drug sales. The remainder of the prescription drug costs are borne by the patients themselves.
Here we can see that roughly 70% of drug sales are reimbursed out of the patient’s own wallet. The coverage by the medical insurance plans is far less than half of the drug sales, around only 30%. As already pointed out universally in China, the limited coverage of medical insurance plans is the main reason why the general public complains that hospital services are far beyond their ability to afford.
Figure 1: Who Purchases How Many Drugs in China?
40% 30%
Patient
Pharmaceutical firms
Hospital
Medical Insurances Plan
Prescriptions on the catalogues Prescription drugs
(a) off the catalogues
30%
OTC
(Source) Author (Note) Figures in three pillars are sales ratios estimated by the author. The formula for
estimation is stated in the text.
1.4 “Feeding Hospital by Drugs (
以 药 养 医)”: The Hospital’s Demand
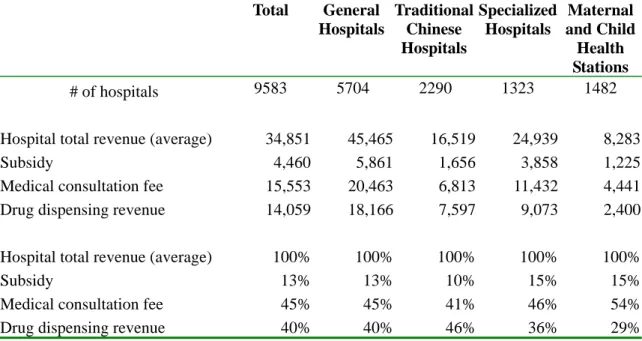
The demand for drug in China is characterized by the following natures. 1) The ultimate purchasers of the drugs are the medical insurers and individuals, where the former covers about 50% of the population at most. 2) The direct purchasers of the drugs for manufacturers are primarily hospitals. Hospitals and physicians are expected to act as patients’ agents. However, hospitals in China have the following problems: 1) though there is strong demand for better medical services, the utilization rate of medical services remains low because hospital charges are beyond the affordability of the general public. 2) The hospitals’ revenue structure largely depends on the revenue earned from dispensing drugs. General hospitals and traditional Chinese hospitals both depend on drugs for more than 40% of their revenue. Historical development shows that the dispensing of drugs has accounted for 40-50% since 1998 to 2005 while, in the same timeframe, the revenue share from medical consultation fees is increasing slightly but steadily (Tables 6 and 7).
Table 6: Revenue Structure by Hospital Type (2004)
Total General
Hospitals
Traditional Chinese Hospitals
Specialized Hospitals
Maternal and Child Health Stations
# of hospitals 9583 5704 2290 1323 1482
Hospital total revenue (average) 34,851 45,465 16,519 24,939 8,283
Subsidy 4,460 5,861 1,656 3,858 1,225
Medical consultation fee 15,553 20,463 6,813 11,432 4,441 Drug dispensing revenue 14,059 18,166 7,597 9,073 2,400
Hospital total revenue (average) 100% 100% 100% 100% 100%
Subsidy 13% 13% 10% 15% 15%
Medical consultation fee 45% 45% 41% 46% 54%
Drug dispensing revenue 40% 40% 46% 36% 29%
(Source) China Health Statistical Yearbook 2005.
Table 7: Historical Change in Revenue Structure (General Hospitals)
1998 1999 2000 2001 2002 2003 2004 2005
# of hospitals 4052 4072 4088 4112 4488 4779 4848
Amount (000 RMB)
Total revenue 25,947 28,583 32,424 35,379 37,151 39,694 51,118 Subsidy 1,554 1,946 2,041 2,516 2,730 2,974 3,182 Medical Consultation Fee 9,909 12,502 14,131 15,623 16,841 18,277 22,960 Drug Dispensing Revenue 11,991 13,373 15,006 16,026 16,162 17,338 20,457
Share (%)
Total revenue (average) 100% 100% 100% 100% 100% 100% 100% 100%
Subsidy 6.0% 6.8% 6.3% 7.1% 7.3% 7.5% 6.2% 5.0%
Medical Consultation Fee 38.2% 43.7% 43.6% 44.2% 45.3% 46.0% 44.9% 47.0%
Drug Dispensing Revenue 46.2% 46.8% 46.3% 45.3% 43.5% 43.7% 40.0% 48.0%
(Source) 1998-2004: China Health Statistical Yearbook 2005. 2005: The industrial map of China Pharmaceuticals 2006-07, Social Sciences Academic Press.
What is behind this high dependence on drugs? It is commonly perceived that as the drug price margin between sales to the patient and procurement from the manufactures goes to the hospital, the hospital and physician have a strong preference to prescribe more expensive drugs. In our interviews with the management of pharmaceutical firms that also run private hospitals, it was confirmed “no hospital can afford to operate without depending on the drug margins” (interview in June 2007). Hosptials’ high dependency on price margins is often attributed to poor support by the fiscals. As we can see in Table 7, that subsidy from the government is only limited to 5-7%. This poor support by the public sector is attributed to fiscal decentralization due to the central government’s huge deficit during the reform period since 1978.
Uchimura and Jutting [2007] analyzed that infant mortality rates are lower when a county has larger revenues compared to when transferring from a provincial government, based on a panel data set with nation-wide county-level data. For those local governments that have only limited revenues, their ability to spend on local public goods such as healthcare depends crucially upon inter-governmental transfers. But it is implied that the transfer is not enough to equalize the health outcome among counties.
Hospitals should respond to maximize their revenue by enlarging the drug price margins.
Meng [2006] conducted a detailed data collection on the impact of the medical reform
on medical service demand. A study on the introduction of price regulations on drugs in 2000 found that the hospitals prescribed new drugs on the price regulation, with prices being two times higher than pre-reform. This result suggests a preference on the part of hospitals toward higher priced drugs, which is the opposite of the response towards normal goods.
In 2007, the Chinese government has taken some steps to reform this problem: (1) Nanjing is testing the separation of hospitals and pharmacies. It is expected that hospitals will not set high prices by separating their income from drug revenue. This has been effective in Japan since around 2000. However, it is reported that in Nanjing management and ownership of pharmacies has been separated, and management has been given over to drug trading companies, whereas ownership still belongs with the hospital. As there no new revenues were arranged for hospitals, they consequently still need to rely on the drug margin, requiring the drug trading companies to pay back a margin for drug sales. The margin ratio is reported to be 36-45 % (Zhao and Zhao [2006]). Thus the separation of the management and ownership of pharmacies does not seem to be effective at reducing drug prices. (2) Beijing Community Hospital Medical Reform: since 2007, the Beijing City Government has started to reimburse all the drug fees for 16 basic diagnoses at community health stations. This reform is targeted not only at reducing the general public’s expenditure, but also at encouraging patients with mild diseases to go to the community health stations rather than the main hospitals that have are already above capacity.
References:
Zhao, Yanlin and Zhao Yaming [2006] “A True Story of the Separation of Management and Ownership of Pharmacies in Nanjing” Capital Week No. 41, 4 November, 2006.
Uchimura, H. and Jutting, Johannes [2007] “Fiscal Decentralization, Chinese Style;
Good for Health Outcomes?”, IDE Discussion Paper No. 111, July 2007.
Meng, Qingyue [2006] Health Care Pricing and Payment Reforms in China: the Implication for Health service Delivery and Cost Constraint, Ph.D Thesis, Karolinska Institute.