Study on physiological and adaptational responses of turfgrasses to salinity stress
シバの塩ストレスに対する生理および適応応答に関する研究
徐 冉
2 0 1 3
CHAPTER 1
Introduction………...1
CHAPTER 2 Growth responses, ionic concentration, organic solute accumulation and osmotic adaptation in Kentucky bluegrass and Tall fescue under salinity stress ………..6
Materials and Methods 6 Results………9
Discussion………..18
Summary...24
CHAPTER 3 Comparative lipid peroxidation and antioxidative enzymes of Kentucky bluegrass and Tall fescue under salinity stress...25
Materials and Methods………...25
Results………27
Discussion………..30
Summary………34
CHAPTER 4 Growth responses and ionic concentrations of four bermudagrass cultivars under salinity stress……….35
Materials and Methods ………35
Results………...37
Discussion………...44
Salt glands and salt gland excretion efficiency of Bermudagrass cultivars to salinity
stress………49
Materials and Methods……….49
Results………..50
Discussion………54
Summary………...56
GENERAL DISCUSSION………..57
GENERAL SUMMARY……….61
ACKNOWLEDGEMENT………..66
REFERENCES………67
LIST OF PUBLICATIONS……….75
- 1 -
CHAPTER 1
INTRODUCTION
Salinity is one of the most serious problems limiting plant growth and productivity.
Approximately 6% of the earth’s land area (800 million hectares) is affected by either salinity or the associated condition of sodicity (Food and Agriculture Organization 2006). Salinity problem is increasing in turfgrass culture because of increased use of secondary, saline water sources, such as recycled water (Marcum 2008). Rapidly increasing populations and urbanization, especially in arid and semi-arid regions, are creating the freshwater shortage. The reuse of treated wastewater for irrigation of turfgrasses and landscapes is viewed as one way to use urban water resources more efficiently. In addition, seawater intrusion in coastal regions has increased problems associated with establishing and maintaining turfgrasses (Qian and Suplick 2001). The tsunami induced by the 2011 Off the Pacific Coast Tohoku Earthquake inundated a total agricultural land of approximately 23,600 ha from Iwate Prefecture to Chiba Prefecture, Japan (MAFF 2011). For these reasons, the needs for turfgrasses that are tolerant to stresses associated with salt-affected sites and even irrigation with recycled wastewater has increased in recent decades.
Turfgrass encompasses an extreme range in salinity tolerance, from salt-sensitive to extremely salt-tolerant (halophytic). Based on the maximum salinity (EC) at which shoot growth is reduced by approximately 50% (Marcum 2008), a salinity tolerance ranking of turfgrass species is provided below (Table 1.1). The unit in reporting salinity tolerance was modified to electrical conductivity (EC) of saturated soil paste (1 dS m-1 ≈ 11 mM NaCl ≈ 640 ppm NaCl).
- 2 - Table 1. Salinity tolerance ranking of turfgrass species based on relative salinity tolerance according to Marcum, 2008.
Salinity Tolerance Ranking†
Salinity Tolerance (ECe in dS m-1)
Common Name Ave.
†† Range Type
†††
Saltgrass T 35 12-46 Warm
Seashore Dropseed T 31 10-45 Warm
Seashore Paspalum T 25 16-45 Warm
Alkaligrass T 25 20-46 Cool
St. Augustinegrass T 22 19-40 Warm
Bermudagrass T 18 8-40 Warm
Zoysiagrass T 14 6-40 Warm
Creeping bentgrass MT 10 8-26 Cool
Tall fescue MT 8 4-10 Cool
Buffalograss MT 7 7-10 Warm
Perennial Ryegrass MT 7 4-11 Cool
Creeping red fescue MT 6 0-12 Cool
Gramagrass MS 5 ND Warm
Kentucky bluegrass S 3-4 3-15 Cool
Carpetgrass S 3 ND Warm
Centipedegrass S 2-3 ND Warm
Bahigrass S 1.25 3-6 Warm
Annual bluegrass S ND 0-2 Cool
Rough bluegrass S ND 0-3 Cool
Redtop S ND 0-2 Cool
Velvet bentgrass S ND 0-2 Cool
† S (sensitive) < 3 dS m-1; M S (moderately sensitive) 3–6 dS m-1; M T (moderately tolerant) 6–10 dS m-1; T (tolerant) > 10 dS m-1; ND (no data)
†† Average salinity tolerance is an estimate of the maximum salinity at which the salinity at which shoot growth is reduced by approximately 50%.
†††
Cool-season (C3) and Warm-season (C4) grasses. Cool-season grasses show optimum growth between 16 °C and 24 °C, and warm-season grasses show optimum growth between 27 °C and 35 °C.
- 3 - Kentucky bluegrass (Poa pratensis L.), Tall fescue (Festuca arundinacea Schreb.) and four bermudagrass (Cynodon spp.) cultivars were used in this study. Kentucky bluegrass (KBG) is widely used for lawn, golf turf (except greens), athletic fields, and other general-purpose turfs in subarctic and temperate regions (Turgeon 2008). KBG has been generally ranked as one of salt-sensitive grass species with an average threshold EC of 3 dS m−1 (Carrow and Duncan 1998).
A number of salinity studies have been done on KBG, reflecting its wide use among cool-season turfgrass. The 5000 ppm NaCl solution reduced germination of KBG seed by 50% and 10,000 ppm (15 dS m−1) reduced germination nearly to zero (Liem et al. 1985). The majority of studies show there was not a very wide range of salinity tolerance among KBG cultivars compared with other turfgrasses (Marcum 2008). Robins et al. (2009) evaluated the salt tolerance of 67 Kentucky bluegrass and found that five accessions had tolerance as good as or better than the Tall fescue and Perennial ryegrass.
Tall fescue (TF) can adapt to a wide range of soil conditions. TF is becoming an increasingly important lawn species and is widely used as a utility turfgrass in both warm and cool subtropical climates (Turgeon 2008). TF is a moderately salt-tolerant species with an EC tolerance of 6-10 dS m−1 (Harivandi 1988). More salinity studies have been done on TF due to the widespread use for laws and roadsides in cooler climates. TF cv. Kentucky 31 was the most salt tolerant of ten species considered for use on salt-affected soil (Roberts and Zybura 1967).
Alshammary et al. (2004) found that TF cv. Arid was more salt tolerant than KBG and 50%
shoot growth reduction of TF was at 10.0 and 14.2 dS m−1 in the container experiments and hydroponic experiments, respectively. Kobayashi et al. (2004) reported that TF cv. Southern Cross was the most salt tolerant of six cool-season species and 50% dry matter reduction
- 4 - occurred at 141.0 mmol L−1 NaCl in the hydroponic experiments,.
Bermudagrass species (Cynodon spp.), the most popular turfgrasses in warm regions worldwide for lawns, sports and along roadsides, are well-adapted to a wide range of so il conditions, being tolerant to drought and a broad salinity range (Carrow 1996; Marcum and Pessarakli 2006). Bermudagrass is ranked as having excellent salinity tolerance, tolerating ECe 8-40 dS m−1 (Marcum 2008). There have been a number of studies comparing salinity tolerance of several Bermudagrass cultivars (Dudeck and Peacock 1993; Dudeck et al. 1983; Francois 1988; Peacock et al. 2004). Differences in salinity tolerance among Bermudagrass cultivars have been noted. Salinity tolerance (according to the salinity level that causes 50% shoot growth reduction) ranged between 26 and 40 dS m–1 among 35 Cynodon spp. cultivars (Marcum and Pessarakli 2006).
Salinity can inhibit plant growth by low external water potentials, ion toxicity and ion imbalance (Munns 1993). Ionic and hyperosmotic stresses lead to secondary stress such as oxidative damage (Zhu 2001). Salt-tolerant plants accumulate inorganic ions and various organic osmolytes to balance external osmotic stresses through the process of osmoregulation, or osmotic adjustment. To avoid toxicity to the cytosol, Na+ and Cl– are compartmentalized mainly in the vacuoles of shoot and root cells (Flowers et al. 1977; Lerner et al. 1994). Under these conditions, the osmotic potential of the cytoplasm is maintained by the accumulation of compatible solutes such as proline, glycinebetaine, sugars, and cyclitols, which can be accumulated in sufficient concentrations to balance the osmotic potential of Na+ and Cl– accumulated in the vacuole (Flowers and Colmer 2008). To mitigate the oxidative damage induced by reactive oxygen species, plants employ a variety of enzymatic and non-enzymatic antioxidant defenses (Apel and
- 5 - Hirt 2004). Numerous studies have compared relative salinity tolerance among turfgrass cultivars, however, only a few of them have attempted to elucidate tolerance mechanisms in turfgrasses. To date, relatively little progress has been made in breeding for improved salinity tolerance in turfgrass. Development of salt-tolerant cultivars is not simple because the trait is controlled by many physiological mechanisms and gene (Grover et al. 1999; Lee et al. 2005). A thorough knowledge of the physiology of salt tolerance of turfgrasses may aid in defining salt tolerance mechanisms and identifying criteria for turfgrass breeders in developing more salt-tolerant cultivars which can grow on sites with saline soil conditions, and normally not suitable for crop production. The objectives of this study were to compare the relative salinity tolerance and physiological responses of three turfgrass species to salinity and to elucidate the physiological adaptations of turfgrasses to salinity stress.
- 6 -
CHAPTER 2
Growth responses, ionic concentration, organic solute accumulation and osmotic adaptation in Kentucky bluegrass and Tall fescue under salinity stress
The detrimental effects of salinity on turfgrass growth include ion toxicity, osmotic stress, and nutritional disturbances. Salt tolerant plants have the ability to minimize these detrimental effects by producing a series of anatomical, morphological, and physiological adaptation (Alshammary et al. 2004). To avoid ion toxicity, Na+, Cl– and other inorganic ions are compartmentalized mainly into vacuoles of shoots and roots cells. Compatible solutes, such as organic solutes and K+ are accumulated in cytoplasm for osmotic adjustment. The study in this chapter was conducted to compare growth responses, inorganic ion concentrations, compatible solutes accumulation and the contributions of specific inorganic ions and compatible solutes to osmotic potential in shoots and roots of KBG and TF in response to different levels of NaCl stress.
MATERIALS AND METHODS
Seeds of KBG (cv. Blue Star) and TF (cv. Little Hero) were sown in the growth chamber conditions which were maintained at 24 ± 2C and 60% relative humidity, respectively.
Three-week-old seedlings were transplanted to 4 L plastic pots filled with nutrient solution (Table 2) in a glasshouse. The solution was aerated constantly and replaced twice a week throughout the experiment.
- 7 - Plants were cultured under non-saline conditions for 15 d to ensure full establishment before starting salinity treatments. The nutrient solution was salinized with NaCl to 50, 100, 150 and 200 mmol L−1. Nutrient solution not containing NaCl (0 mmol L−1 NaCl) was prepared for the control treatment. Afterwards, plants in each treatment were grown for 40 days.
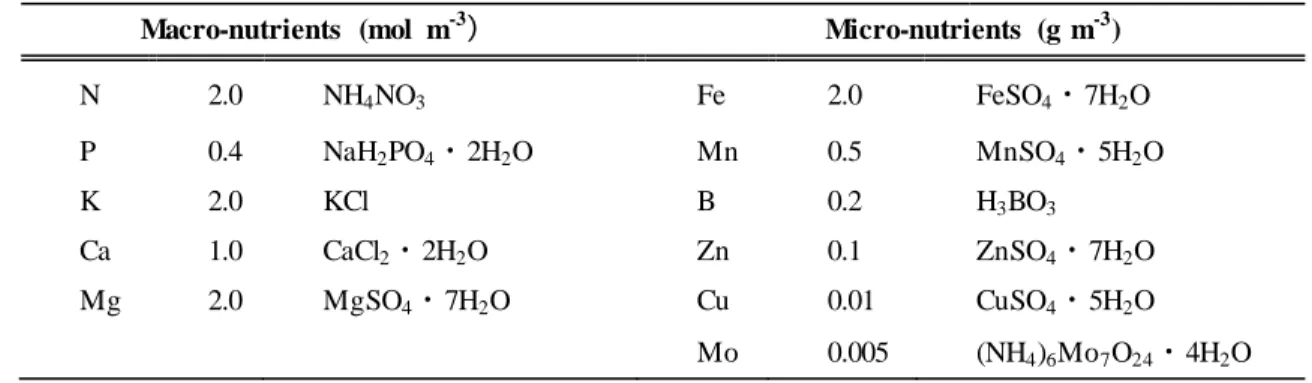
Table 2. Composition of nutrient solution.
Macro-nutrients (mol m-3) Micro-nutrients (g m-3)
N 2.0 NH4NO3 Fe 2.0 FeSO4・7H2O
P 0.4 NaH2PO4・2H2O Mn 0.5 MnSO4・5H2O
K 2.0 KCl B 0.2 H3BO3
Ca 1.0 CaCl2・2H2O Zn 0.1 ZnSO4・7H2O
Mg 2.0 MgSO4・7H2O Cu 0.01 CuSO4・5H2O
Mo 0.005 (NH4)6Mo7O24・4H2O
During the salinity treatment period, the plant growth parameters of shoot height, root length, dry weight (DW) of shoots and roots, turf quality and leaf firing were determined. Shoots and roots were washed with deionized water and dried at 70C for 48 h to determine DW. Turf quality and leaf firing were visually estimated weekly as described by Alshammary et al. (2004).
Turf quality was estimated based on a scale of 1-9, with 9 being green, dense and uniform, 1 being thin and completely brown, and 6 being the minimum acceptable level. Leaf firing was estimated as the total percentage of chlorotic leaf area, with 0% indicating no leaf firing and 100% indicating totally brown leaves.
Shoot and root samples were collected from three plants, thoroughly rinsed, cut into small pieces (5 mm length), placed in Eppendorf tubes perforated with four small holes, and immediately frozen in liquid nitrogen. The osmola lity of the collected sample sap was analyzed with a vapor pressure osmometer (Osmometer 5520, Wescor, Logan, UT, US). The osmotic
- 8 - potential (Ψs) was calculated by using the van’t Hoff equation (Ψs = –cRT). The Ψs of each of Na+, K+, Cl–, proline, and TSS was calculated as Ψs = −nRT/V, where n is the number of solute molecules and V is the volume (L). Osmotic coefficients of the solutes in tissue water were assumed to equal 1 (Song et al. 2006).
After harvest, shoots and roots were washed with deionized water and dried at 70°C for 48 h for determining inorganic ion concentrations and total soluble sugar (TSS). Dried samples were finely ground and digested in 1 mL sulfuric acid and hydrogen peroxide at 200°C on a dry block bath. The concentrations of Na+, K+, Ca2+, and Mg2+ were determined by atomic absorption spectrophotometry (Polarization Zeeman Z-6100; Hitachi, Ibaraki, Japan). Ground plant samples were heated in boiling deionized water in a beaker on a hot plate (250 °C) for 1 min, then immediately filtered the extract through a Toyo No. 6 filter paper. Chloride and NO3–
were determined using an ion chromatography (CDD-10A SP, HIC-10A Super; Shimadzu, Kyoto, Japan).
The proline concentration was determined by the method of Bates et al. (1972). Samples were ground in a mortar and homogenized in 120 mmol L−1 sulfosalicylic acid, then mixed with acid ninhydrin and glacial acetic acid and then boiled at 100°C for 1 h. The absorbance of the organic phase was determined at 520 nm.
TSS was extracted in 80% (v/v) ethanol in a boiling water bath until the extract became colorless and frozen (−20°C) until analysis (Angelov et al. (1993). TSS was estimated by the method of McCready et al. (1950) using anthrone in concentrated H2SO4. Spectrophotometric readings were taken at 630 nm. A standard curve was plotted with 0–200 ppm of glucose.
The experiment was set up as a completely randomized design with both species and five
- 9 - salinity levels. The effects of species, salinity levels, and their interactions on variables were analyzed by two-way analysis of variance (ANOVA) with SPSS version 10.0J software (SPSS Japan, Inc.). When significant differences were detected at P ˂ 0.05, mean values were compared by Duncan’s multiple range tests.
RESULTS
Effects of salinity on plant growth
The height and DW of KBG and TF shoots decreased significantly with an increase in the concentration of NaCl (Table 3). Although the length and DW of KBG roots decreased significantly as salinity increased, the changes in TF were not significant. Compared to the control, the root length of TF increased at 100 mmol L−1 NaCl. However, the root DW of TF grown in the 100, 150 and 200 mmol L−1 NaCl treatments was reduced by 14.5, 21.7 and 26.1%, respectively. Similarly, compared to the control, the root DW of KBG at these salinity levels was reduced by 39.5, 61.8 and 80.3%, respectively.
Although turf quality declined as salinity increased in both species (Table 3), the turf quality of TF was higher during the experimental period. Turf quality of KBG decreased to 3.88 at 100 mmol L−1 NaCl, but TF maintained a minimal acceptable quality (6.69) at 100 mmol L−1. Leaf firing in both species increased with an increase in salinity, reaching 56.7% in KBG and 29.5%
in TF at 100 mmol L−1 NaCl. Leaf firing in KBG was markedly higher than that in TF at the same salinity levels. The results of growth parameters ( Table 3) indicated that growth inhibition by NaCl was more severe in KBG than in TF.
- 10 - Table 3. Effect of salinity on growth parameters in Kentucky bluegrass (KBG) and Tall fescue (TF).
NaCl
(mmol L−1) Shoot height
(cm)
Root length (cm)
Shoot DW (g plant−1)
Root DW (g plant−1)
Turf quality Leaf firing (%) KBG
0 32.20 ± 1.05a 31.59 ± 0.65a 2.49 ± 0.13a 0.76 ± 0.04a 8.62 ± 0.08a 13.52 ± 0.11e 50 27.42 ± 0.49b 24.90 ± 0.64b 1.65 ± 0.09b 0.65 ± 0.03b 6.25 ± 0.16b 32.87 ± 1.19d 100 22.40 ± 0.41c 22.61 ± 0.61c 1.25 ± 0.09c 0.46 ± 0.02c 3.88 ± 0.08c 56.71 ± 1.65c 150 20.70 ± 0.46c 19.57 ± 0.33d 0.96 ± 0.04d 0.29 ± 0.004d 2.70 ± 0.12d 74.32 ± 1.95b 200 18.03 ± 0.66d 14.86 ± 0.52e 0.57 ± 0.03e 0.15 ± 0.014e 2.27 ± 0.11e 84.24 ± 1.74a TF
0 40.84 ± 0.69a 34.37 ± 0.78a 2.83 ± 0.10a 0.69 ± 0.01a 8.80 ± 0.10a 9.33 ± 0.15e 50 36.26 ± 0.29b 33.90 ± 1.51a 2.20 ± 0.36b 0.67 ± 0.04a 8.13 ± 0.08b 15.51 ± 0.69d 100 30.39 ± 0.83c 39.48 ± 2.63b 1.32 ± 0.07c 0.59 ± 0.01b 6.69 ± 0.26c 29.54 ± 1.38c 150 25.75 ± 1.09d 29.99 ± 0.93a 1.36 ± 0.10c 0.54 ± 0.01b 5.68 ± 0.15d 56.13 ± 1.16b 200 22.88 ± 0.81e 29.47 ± 1.14a 1.14 ± 0.05c 0.51 ± 0.04b 4.32 ± 0.10e 70.28 ± 0.55a Values in each column are the mean of five replicates ± S.E. Different letters indicate significant differences between means at p < 0.05 by analysis of variance.
Ion concentrations in shoots and roots
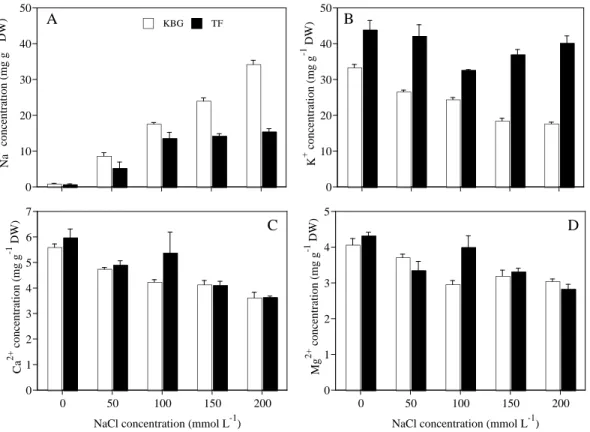
Na+ in the shoots of KBG and TF increased as salinity increased (Fig. 1A); that in KBG increased significantly relative to the control. That in TF did not increase above 100 mmol L−1 NaCl. Na+ was 30% to 122% higher in KBG than in TF at 50 to 200 mmol L−1 NaCl. K+ in the shoots of KBG decreased as NaCl increased (Fig. 1B) However, That of TF decreased from 0 to 100 mmol L−1 NaCl and increased slightly at 150 and 200 mmol L−1 NaCl. K+ was higher in TF than in KBG at the same salinity. Ca2+ and Mg2+ in the shoots of KBG and TF decreased as NaCl increased (Figs. 1C, D); Concentrations of these cations did not differ significantly between grasses except at 100 mmol L−1 NaCl.
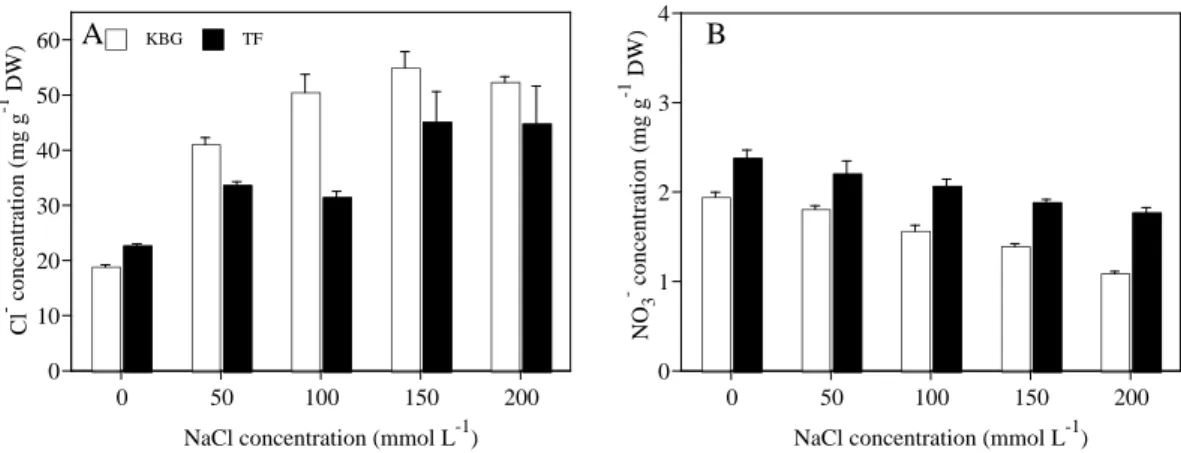
Cl– in the shoots of KBG increased as salinity increased (Fig. 2A). That of TF did not increase above 50 mmol L−1 NaCl (Fig. 2A). Cl– was higher in KBG than in TF, except at 50 mmol L−1 NaCl. NO3–
in the shoots of KBG decreased as salinity increased, but did not decrease
- 11 - significantly above 100 mmol L−1 NaCl (Fig. 2B). That of TF decreased gradually as salinity increased (Fig. 2B). NO3– of shoots was 58% to 111% higher in TF than in KBG at 50 to 200 mmol L−1 NaCl.
0 50 100 150 200
0 1 2 3 4 5
Mg2+ concentration (mg g-1 DW)
NaCl concentration (mmol L-1)
0 50 100 150 200
0 1 2 3 4 5 6 7
Ca2+ concentration (mg g-1 DW)
NaCl concentration (mmol L-1)
0 10 20 30 40 50
K+ concentration (mg g-1 DW) 0
10 20 30 40 50
Na+ concentration (mg g-1 DW) KBG TFA B
C D
Figure 1 Cat ion concentrations in the shoots of KBG and TF at diffe rent NaCl concentrations. (A) Na+, (B) K+, (C) Ca2+, and (D) Mg2+. Bars indicate standard error (n = 3).
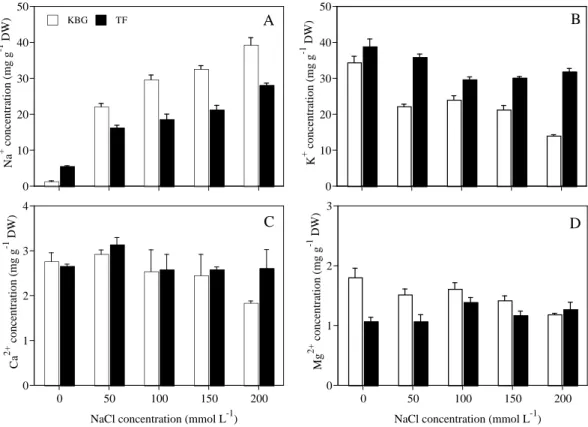
Na+ in the roots of KBG and TF increased significantly as salinity increased, but that in KBG was significantly higher than in TF (Fig. 3A). Na+ was 36% to 59% higher in KBG than in TF at 50 to 200 mmol L−1 NaCl. K+ in the roots of KBG and TF decreased as salinity increased (Fig.
3B). K+ was higher in TF than in KBG at all salinities. Ca2+ in the roots of KBG and TF did not change significantly under NaCl stress, except in KBG at 200 mmol L−1 (Fig. 3C). Mg2+ in the roots of KBG under salt stress was less than that in the control (Fig. 3D); however, that in TF increased slightly at NaCl concentrations above 50 mmol L−1 (Fig. 3D).
- 12 -
0 50 100 150 200
0 1 2 3 4
NO3- concentration (mg g-1 DW)
NaCl concentration (mmol L-1)
0 50 100 150 200
0 10 20 30 40 50 60
Cl- concentration (mg g-1 DW)
NaCl concentration (mmol L-1)
KBG TF
A B
Figure 2 Anion concentrations in the shoots of KBG and TF at diffe rent Na Cl concentrations. (A) Cl– and (B) NO3–
. Bars indicate standard error (n = 3).
0 50 100 150 200
0 1 2 3
Mg2+ concentration (mg g-1 DW)
NaCl concentration (mmol L-1)
0 50 100 150 200
0 1 2 3 4
Ca2+ concentration (mg g-1 DW)
NaCl concentration (mmol L-1)
0 10 20 30 40 50
K+ concentration (mg g-1 DW) 0
10 20 30 40 50
Na+ concentration (mg g-1 DW) KBG TF A B
C D
Figure 3 Cation concentrations in the roots of KBG and TF at d iffe rent Na Cl concentrations. (A) Na+, (B) K+, (C) Ca2+, and (D) Mg2+. Bars indicate standard error (n = 3).
Cl– in the roots of KBG and TF increased significantly as salinity increased (Fig. 4A). Cl– in KBG increased by 117% to 191% and that in TF increased by 39% to 99% at 50 to 200 mmol L−1 NaCl. Under salt stress Cl– was higher in KBG than in TF. NO3–
in the roots of KBG and TF
- 13 - decreased significantly as salinity increased (Fig. 4B). The NO3– of root was 22% to 63% higher in TF than in KBG at 50 to 200 mmol L−1 NaCl.
0 50 100 150 200
0 1 2 3 4
NO3- concentration (mg g-1 DW)
NaCl concentration (mmol L-1)
0 50 100 150 200
0 10 20 30 40 50 60
Cl- concentration (mg g-1 DW)
NaCl concentration (mmol L-1)
KBG TF
A B
Figure 4 Anion concentrations in the roots of KBG and TF at different Na Cl concentrations. (A) Cl– and (B) NO3–. Bars indicate standard error (n = 3).
Na+/K+ ratio of shoots and roots and Na+ and Cl– ratios between roots and shoots
The Na+/K+ ratios in the shoots and roots of KBG increased significantly as salinity increased (Fig. 5). The shoot Na+/K+ ratio of TF did not change significantly above 100 mmol L−1 NaCl, but the root Na+/K+ ratio increased slightly (Fig. 5). Similar to Na+, the Na+/K+ ratios in the shoots and roots of KBG were significantly higher than those of TF at the same salinity.
0 50 100 150 200
0 1 2 3 4
Na+ /K+ ratio
NaCl concentration (mmol L-1)
0 50 100 150 200
0 1 2 3 4
Na+ /K+ ratio
NaCl concentration (mmol L-1)
KBG TF
Shoot Root
Figure 5 Na+/K+ ratio in the shoots and roots of KBG and TF at different NaCl concentrations. Bars indicate standard error (n = 3).
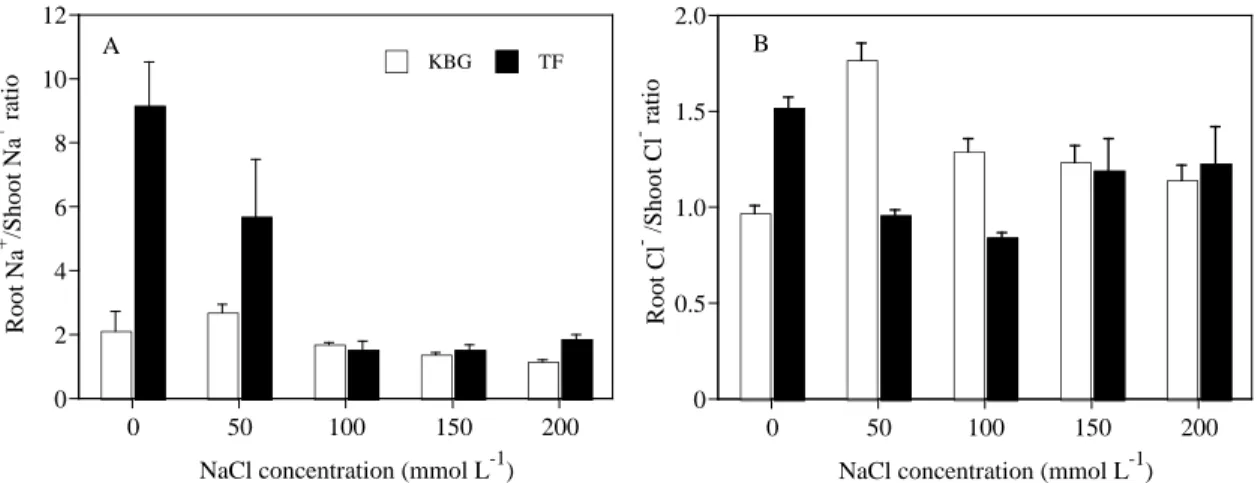
- 14 - Root Na+/shoot Na+ ratio of both species decreased under salinity stress (Fig. 6A). It decreased gradually from 50 to 200 mmol L−1 NaCl in KBG. It increased significantly from control to 100 mmol L−1 NaCl, and then did not change significantly in TF. The root Na+/shoot Na+ ratio of TF was higher than that of KBG except at 100 mmol L−1 NaCl. Root Cl–/shoot Cl– ratios of KBG increased under salinity treatment, and exhibited the maximum ratio at 200 mmol L−1 NaCl. In comparison with control, Root Cl–/shoot Cl– ratios of TF decreased under salinity treatment (Fig. 6B). Root Cl–/shoot Cl– ratios of KBG were significant higher than those of TF at 50 and 100 mmol L−1 NaCl.
0 50 100 150 200
0 2 4 6 8 10 12
Root Na+ /Shoot Na+ ratio
NaCl concentration (mmol L-1)
KBG TF
0 50 100 150 200
0 0.5 1.0 1.5 2.0
Root Cl- /Shoot Cl- ratio
NaCl concentration (mmol L-1) A B
Figure 6 Root Na+/shoot Na+ (A) and root Cl–/shoot Cl– (B) ratios of KBG and TF at d ifferent NaCl concentrations.
Bars indicate standard error (n = 3).
0 50 100 150 200
0 10 20 30 40
Proline concentration (u mol g-1 FW)
NaCl concentration (mmol L-1)
0 50 100 150 200
0 10 20 30 40
Proline concentration (umol g-1 FW)
NaCl concentration (mmol L-1)
KBG TF
Shoot Root
Figure 7 Proline concentrations in the shoots and roots of KBG and TF at different NaCl concentrations.
Bars indicate standard error (n = 3).
- 15 - Proline and TSS concentrations of shoots and roots
The proline concentrations in shoots and roots of both species increased significantly as salinity increased (Fig. 7). That in the shoots was significantly higher in KBG than in TF at the same salinity, but that in the roots was significantly higher in TF than in KBG.
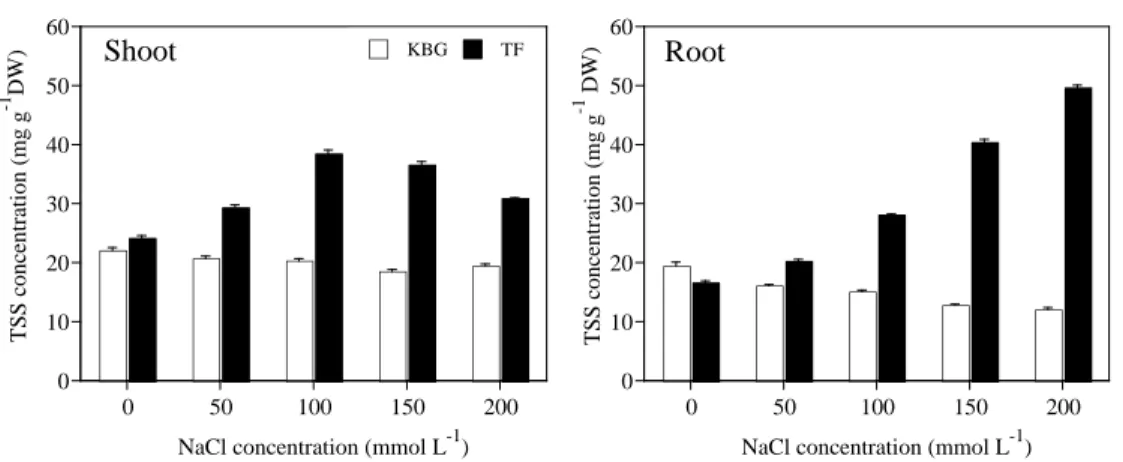
TSS in the shoots and roots of KBG decreased gradually as salinity increased (Fig. 8).
However, TSS in the shoots of TF increased as salinity increased to 100 mmol L−1 NaCl, but then decreased at higher salinities. TSS in the roots of TF increased significantly as salinity increased. TSS of shoots was 42% to 97% higher in TF than in KBG, and that of roots was 26%
to 311% higher in TF than in KBG, at 50 to 200 mmol L−1 NaCl (Fig. 8).
0 50 100 150 200
0 10 20 30 40 50 60
TSS concentration (mg g-1 DW)
NaCl concentration (mmol L-1)
0 50 100 150 200
0 10 20 30 40 50 60
TSS concentration (mg g-1 DW)
NaCl concentration (mmol L-1)
KBG TF
Shoot Root
Figure 8 TSS concentrations in the shoots and roots of KBG and TF at different NaCl concentrations.
Bars indicate standard error (n = 3).
Estimated contributions of inorganic ions and compatible solutes to osmotic potential
There was no difference in Ψs between the both species in control (Table 4 and Table 5). The 50, 100, 150 and 200 mmol L-1 NaCl treatments decreased the Ψs of the nutrient solution from
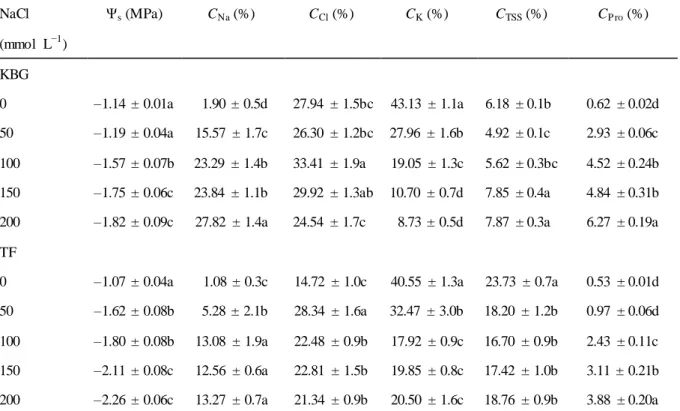
−0.06 to −0.24, −0.43, −0.69 and −0.84 MPa, respectively. This resulted in a decline in root and shoot Ψs in both KBG and TF. Ψs became more negative in shoots of KBG and TF as salinity increased, and decreased more significantly in TF than in KBG (Table 4). The estimated contribution of shoot Na+ to Ψs (CNa) in KBG increased significantly as salinity increased; That
- 16 - of TF remained unchanged from 100 to 200 mmol L−1 NaCl (Table 4). CNa of KBG was significantly higher than that of TF. The estimated contributions of shoot Cl– to Ψs (CCl) in KBG changed significantly from 100 to 200 mmol L−1 NaCl; That in TF under salt stress was significantly higher than in the controls and was not significant change 100 to 200 mmol L−1 NaCl (Table 4). The estimated contribution of shoot K+ to Ψs (CK) decreased significantly in KBG than TF as the concentration of NaCl increased (Table 4). The estimated contribution of shoot TSS (CT SS) to Ψs in KBG increased at 150 and 200 mmol L−1 NaCl, but did not change significantly in TF (Table 4). However, CT SS was significantly higher in TF than in KBG at the same salinity. The estimated contribution of shoot proline to Ψs (CPro) increased in both species as salinity increased (Table 4); itwas lower than those of the other solutes.
Table 4. Effects of salinity on Ψs and the estimated contributions of Na+ (CNa), K+ (CK), Cl– (CCl), TSS (CTSS) and proline (CP ro) to Ψs in shoots of Kentucky bluegrass (KBG) and Tall fescue (TF).
NaCl (mmol L−1)
Ψs (MPa) CNa (%) CCl (%) CK (%) CTSS (%) CP ro (%)
KBG
0 –1.14 ± 0.01a 1.90 ± 0.5d 27.94 ± 1.5bc 43.13 ± 1.1a 6.18 ± 0.1b 0.62 ± 0.02d 50 –1.19 ± 0.04a 15.57 ± 1.7c 26.30 ± 1.2bc 27.96 ± 1.6b 4.92 ± 0.1c 2.93 ± 0.06c 100 –1.57 ± 0.07b 23.29 ± 1.4b 33.41 ± 1.9a 19.05 ± 1.3c 5.62 ± 0.3bc 4.52 ± 0.24b 150 –1.75 ± 0.06c 23.84 ± 1.1b 29.92 ± 1.3ab 10.70 ± 0.7d 7.85 ± 0.4a 4.84 ± 0.31b 200 –1.82 ± 0.09c 27.82 ± 1.4a 24.54 ± 1.7c 8.73 ± 0.5d 7.87 ± 0.3a 6.27 ± 0.19a TF
0 –1.07 ± 0.04a 1.08 ± 0.3c 14.72 ± 1.0c 40.55 ± 1.3a 23.73 ± 0.7a 0.53 ± 0.01d 50 –1.62 ± 0.08b 5.28 ± 2.1b 28.34 ± 1.6a 32.47 ± 3.0b 18.20 ± 1.2b 0.97 ± 0.06d 100 –1.80 ± 0.08b 13.08 ± 1.9a 22.48 ± 0.9b 17.92 ± 0.9c 16.70 ± 0.9b 2.43 ± 0.11c 150 –2.11 ± 0.08c 12.56 ± 0.6a 22.81 ± 1.5b 19.85 ± 0.8c 17.42 ± 1.0b 3.11 ± 0.21b 200 –2.26 ± 0.06c 13.27 ± 0.7a 21.34 ± 0.9b 20.50 ± 1.6c 18.76 ± 0.9b 3.88 ± 0.20a Values in each column are means of five replicates ± SE. Different letters indicate significant differences between means at P = 0.05 according to Duncan’s multiple range tests.
- 17 - Similar to Ψs in shoots, Ψs in roots of KBG and TF became more negative as salinity increased, and the difference between KBG and TF was large at 200 mmol L−1 NaCl (Table 5).
The estimated contribution of root Na+ to Ψs (CNa) in KBG and TF increased significantly as salinity increased (Table 5). CNa was higher in KBG than in TF. The estimated contribution of root Cl– to Ψs (CCl) in KBG increased with salinity treatment compared with the control. That in TF also increased at 50, 150 and 200 mmol L−1 NaCl (Table 5). However, there was no significant change in estimated contribution of root Cl– to Ψs (CCl) between both species under Table 5. Effects of salinity on Ψs and the estimated contributions of Na+ (CNa), K+ (CK), Cl– (CCl), TSS (CTSS) , and proline (CP ro) to Ψs in roots of Kentucky bluegrass (KBG) and Tall fescue (TF).
NaCl (mmol L−1)
Ψs (MPa) CNa (%) CCl (%) CK (%) CTSS (%) CP ro (%)
KBG
0 –0.52 ± 0.01a 2.75 ± 0.2c 23.99 ± 0.8c 38.67 ± 2.8a 4.67 ± 0.1d 0.95 ± 0.05c 50 –0.75 ± 0.01b 25.31 ± 0.8b 29.99 ± 0.6a 14.76 ± 0.4b 8.95 ± 0.3c 1.46 ± 0.03c 100 –0.83 ± 0.01c 23.48 ± 1.2b 25.47 ± 1.7bc 11.35 ± 0.7bc 9.13 ± 0.2c 4.50 ± 0.07b 150 –0.92 ± 0.02d 25.05 ± 1.3b 27.98 ± 1.1ab 9.89 ± 0.7cd 10.11 ± 0.4b 5.11 ± 0.40b 200 –0.88 ± 0.02d 29.03 ± 1.8a 25.56 ± 0.9bc 6.24 ± 0.2d 11.22 ± 0.4a 6.53 ± 0.37a TF
0 –0.46 ± 0.03a 8.21 ± 0.3d 21.89 ± 1.2a 34.18 ± 3.0a 14.90 ± 0.8a 2.11 ± 0.15c 50 –0.73 ± 0.03b 17.25 ± 1.0c 23.20 ± 1.0a 22.73 ± 1.4b 15.21 ± 0.9a 2.51 ± 0.17c 100 –0.78 ± 0.04b 18.82 ± 1.2bc 20.38 ± 0.8a 17.35 ± 0.9c 16.69 ± 1.3a 5.39 ± 0.42ab 150 –0.94 ± 0.02c 21.22 ± 1.4ab 27.62 ± 3.9a 17.38 ± 0.3c 15.76 ± 0.4a 5.68 ± 0.12a 200 –1.40 ± 0.02d 21.99 ± 0.7ab 24.75 ± 3.7a 14.70 ± 0.6c 12.13 ± 0.4b 4.71 ± 0.17b Values in each column are means of five replicates ± SE. Different letters indicate significant differences between means at P = 0.05 according to Duncan’s multiple range tests.
NaCl treatments. The estimated contribution of K+ to Ψs (CK) in roots was similar to that in shoots: CK decreased in KBG and TF as salinity increased, and more significant reduction was observed in KBG (Table 5). The estimated contribution of root TSS to Ψs (CT SS) in KBG increased as salinity increased (Table 5); that in TF did not change significantly, except at 200
- 18 - mmol L−1 NaCl (Table 5). The estimated contribution of root TSS to Ψs (CT SS) of TF was significantly higher than that of KBG at the same salinity. The estimated contribution of root proline to Ψs (CPro) increased in KBG and TF as salinity increased (Table 5).
DISCUSSION
Plant species differ greatly in their growth response to salinity. It is important to study the physiological characterization of plants to saline conditions to define relative salinity tolerance.
Parameters, such as shoot growth, root mass, root length, and turf quality are well suited for examining salinity tolerance in turfgrass species (Alshammary et al., 2004). In this study, the growth parameters of root length, root DW, lea f firing and turf quality revealed that TF was more salt tolerant than KBG, corroborating the findings of Alshammary et al. (2004) and Marcum (2008). Shoot growth in both species decreased significantly with increasing salinity (Table 3).
Marcum (2008) reported that the shoot growth of salt-sensitive to moderately-tolerant turfgrass species declined linearly with increased salinity stress. However, TF exhibited high root length and root DW, which results in increased root/shoot ratios under salt stress. The increase in root/shoot ratio of TF can maintain an optimal water balance between the root water absorption and shoot transpirational area. An inability to adjust the root/shoot ratio in KBG may explain the relatively poor salinity tolerance in this species.
The suppression of turfgrass growth due to salinity stress was manifested as a decrease in turf quality and an increase in leaf firing. Both turf quality and leaf firing were significantly affected with increasing salinity. Compared to their respective controls, the decrease in turf quality and
- 19 - increase in leaf firing under salt stress was larger for KBG than for TF, indicating that TF was more tolerant to salinity than KBG. Our results show that KBG and TF retained a minimal acceptable quality in the 50 and 100 mmol L−1 NaCl, respectively.
Na+ and Cl– are the dominant toxic ions in saline soil. Higher Na+, often in conjunction with Cl– results in specific ion toxicity and growth inhibition (Ashraf and Harris 2004; Zhu et al.
2008). High Na+ can replace Ca2+ and decline cell membrane integrity of root for water and nutrient uptake. Accumulation of Na+ in leaf leads to dehydration, reduced turgor and death of cells; Accumulation of Cl– in leaf can lead to leaf burn and desiccation in sensitive plants (Carrow et al. 2001). In the present study, KBG accumulated higher Na+ and Cl– than TF in both shoots and roots. This result indicates the injurious effect of ion toxicity for KBG was greater than that for TF.
High salinity can affect essential cation uptake and nutrient balance. At the level o f individual cells, one of the most damaging consequences of salt stress is an influx of Na+ and a decrease in K+ in plant tissues (Li et al. 2010). K+ is often considered as second in importance behind N as a nutrient in turfgrass. K+ strongly influences turfgrass tolerance to drought, low temperature, high temperature, wear and salinity stresses (Carrow et al. 2001). In comparison to the control, the concentrations of K+ in the shoots and roots of both species decreased with salt stress. Those in TF were significantly higher than in KBG at the same salinity (Figs. 1B, 3B). K+ was the most important cation related to the shoot and root growth of many plants subjected to salt stress (Marschner 1995; Grattan and Grieve 1999; Lee et al. 2007). The higher K+ concentration in TF might be one of the reasons for the better growth under salt stress.
The Ca2+ and Mg2+ concentrations in the shoots of both species and Mg2+ in the roots o f
- 20 - KBG decreased as salinity increased (Figs. 1C, 1D, 3C), and the decreased extent of Ca2+ and Mg2+ concentrations in the roots were higher in KBG than that in TF. The decreases were probably due to interactive substitution with Na+ (El-Hendawy et al. 2005). Saline induced Ca2+
deficiency may reduce certain salinity tolerance such as ion exclusion and selective transport.
Ca2+ improves the tolerance of higher plants to salt stress, and its availability plays a major role in counteracting salt stress (Breckle 2002, Carrow et al. 2001). However, we found no significant difference in Ca2+ concentration in shoots between KBG and TF under salinity stress.
Mg2+ deficiency is relatively common in turfgrass grown in soils naturally when high Na+ is present. A high external Na+ concentration will easily displace Mg2+ and decrease Mg2+ uptake (Carrow et al. 2001). However, Mg2+ in TF roots did not decrease under salt stress (Fig. 3D). It should be further investigated whether Mg2+ accumulation is a special adaptation of TF under salt stress.
Under saline condition, Cl– competes with NO3–
and depresses its uptake, which may cause the ion imbalance (Hu et al. 2005). N is usually the most growth-limiting nutrient for plants.
Thus, the great decrease in the NO3–
concentration of KBG may reduce its growth significantly.
NO3–
in the shoots and roots of TF was higher than that in KBG, indicating that e ffects of salinity on nitrate uptake vary considerably with species. TF maintains more healthy growth and stress tolerance by active NO3–
accumulation under salt stress.
High salinity can affect essential ion uptake and nutrient balance. Compared to TF, KBG accumulated higher Na+ and Cl– concentrations in shoots and roots, which reduced K+, Ca2+, Mg2+, and NO3–
concentrations greatly. The Na+ and Cl– toxicity and nutrient imbalance was more significant in KBG than in TF under salt stress. The difference in concentrations of K+ and
- 21 - NO3– between KBG and TF appeared to be related to salinity tolerance. These results would be important information for managing this species in salt-affected environments. When turfgrasses grown on salt-affected soils or irrigated with recycled wastewater, the increase in K and N fertilizer properly may improve plant growth.
The significant differences in K+ concentration in both species were observed with apparent relationship to salinity tolerance (Figs. 1B, 3B). Comparisons between KBG and TF exhibited some difference in Na+/K+ ratios in the shoots and roots with increasing salinity. The Na+/K+ ratios in the shoots and roots of KBG increased significantly as salinity increased. However, those of TF were significantly lower than those of KBG under salt stress (Fig. 5). The Na+/K+ ratio of TF was higher in the roots than in the shoots, and did not reach 1 in each organ. The capacity of plants to maintain a low cytosolic Na+/K+ ratio is likely to be one of the key determinants of salt tolerance (Maathuis and Amtmann 1999; Yeo 1998). This result indicates that TF had a better selectivity for K+ over Na+ than KBG via roots and transporting K+ from roots to shoots under salt stress.
Salinity tolerance is associated with the capacity to limit uptake and transport of saline ions from the root zone to aerial parts (Greenway and Munns 1980). In both species, Na+ concentrations were lower in shoots than in roots (Figs. 1A, 3A). Thus, the roots play an important role in limiting the transport of Na+ to the shoots of both species. However, TF had a lower Na+ concentration in the roots and a higher root Na+/shoot Na+ ratio compared with KBG (Fig. 3A, 6). This result indicates a strong ability of TF to limit Na+ uptake by roots and to prevent Na+ transport from roots to shoots.
Osmotic adjustment is one of the main strategies by which plants ensure water uptake during
- 22 - salinity or drought stress conditions (Greenway and Munns 1980). In TF, shoot and root osmotic potential changed significantly as salinity increased (Tables 4, 5). TF was able to maintain stable gradient of Ψs between shoots, roots and saline nutrient solution, suggesting that osmotic adjustment is an important mechanism in relation to TF’s better salinity tolerance. Na+, Cl–, and K+ were the principal inorganic ions for osmotic adjustment in both species under salt stress (Tables 4, 5). However, their contributions to the total measured osmotic potential differed with salinity treatment and grass species. Under salt stress, Na+ and Cl– made a larger contribution to osmotic potential in KBG than in TF. The ava ilability of Na+ and Cl– as cheap osmoregulator is generally beneficial. However, excessive accumulation of Na+ and Cl– results in ion toxicity and growth inhibition. The estimated contribution of K+ to Ψs (CK) in KBG decreased significantly as salinity increased. However, TF had a higher and stable CK from 100 to 200 mmol L−1 NaCl. K+ has been reported to be involved in activation of several enzymes, membrane transport, maintenance of cystolic osmotic potential, and maintenance of osmotic potential in vacuoles (Marschner 1995). These results suggest that TF has a strong mechanism for active uptake of K+ as an osmoregulator for osmotic adjustment.
Osmotic potential of the cytoplasm is maintained by the accumulation of organic solutes to osmotically balance Na+ and Cl− in the vacuole. In this study, TSS plays an important role in balancing osmotic potential under salt stress. CT SS in KBG decreased as salinity increased, but that in TF was significantly higher at the same salinity (Tables 4, 5). These results suggest that TF, but not KBG, can efficiently mitigate NaCl stress by accumulating TSS for osmotic adjustment. Sugar accumulation is strongly correlated with salt tolerance (Streeter et al. 2001;
Taji et al. 2002). More TSS was accumulated in TF than in KBG at the same salinity (Fig. 8),
- 23 - indicating the importance of TSS in salinity tolerance of TF.
The accumulation of proline in response to abiotic stresses contributes to osmotic adjustment in the cytoplasm (Ashraf and Foolad 2007). The proline concentrations in shoots and roots of both species increased significantly as salinity increased (Fig. 7). However, it contributed less than 7% of the total osmotic potential (Tables 4, 5). Thus, neither species could accumulate enough proline to mitigate NaCl stress by osmotic adjustment. The accumulation of proline by many plant species under salt stress has been correlated with salinity tolerance, and the concentration of proline is generally higher in stress-tolerant than in stress-sensitive plants (Ashraf and Foolad 2007). However, this correlation is controversial: for example, under salt stress, proline levels of the salt sensitive KBG were similar to those of salt tolerant alkalinegrass (Torello and Rice 1986); The accumulation of proline in rice and KBG coincided with a sharp increase in leaf burn (Lutts et al. 1999; Qian et al. 2001), indicating a symptom of salt injury rather than salt tolerance. In this study, the accumulated proline was very low and accumulation pattern was not related to salinity tolerance suggested that proline accumulation was a reaction to salt stress and not a salinity tolerance mechanisms in KBG and TF.
The percentages of individual estimated contributions to osmotic potential under salt stress show that KBG achieved osmotic adjustment more by inorganic ions than through organic osmolytes. The high reliance on inorganic ions for osmotic adjustment is vital for water uptake under saline environment. However, osmotic adjustment of TF was achieved by both inorganic ion and organic osmolytes based on percentage contribution to Ψs, respectively. TF maintained higher concentrations of K+ and TSS in the cytoplasm to achieve cytoplasmic osmotic adjustment, which may explain its better salinity tolerance than KBG.
- 24 - SUMMARY
In this study, we investigated changes of growth, ionic concentrations and compatible solutes in KBG (a salt-sensitive species) and TF (a moderately salt-tolerant species) in response to elevated NaCl concentration. TF exhibited better root growth and turf quality than KBG under salinity stress. Na+ and Cl– concentrations in shoots and roots increased with increasing salinity in both turfgrasses. KBG accumulated more Na+ and Cl– under NaCl stress than did TF. NaCl stress induced more significantly mineral nutrient imbalances in K BG than in TF. The concentrations of K+, Ca2+, Mg2+ and NO3–
in TF were much less affected than those in KBG.
TSS concentration of TF was significantly higher than that of K BG under elevated NaCl concentration. These results indicate that the different physiological responses of KBG and TF to salt stress were highly related to ionic distribution and the accumulation of compatible osmolytes.
TF had a high salt tolerance due to maintenance of higher root growth, restricted uptake of Na+ and Cl– in conjunction with maintenance of higher K+ in shoots and roots and the accumulation of enough total soluble sugars to make osmotic adjustment.
- 25 -
CHAPTER 3
Comparative lipid peroxidation and antioxidative enzymes of Kentucky bluegrass and Tall fescue under salinity stress
High salt concentrations in soil cause ionic stress, hyperosmotic stress and secondary stresses such as oxidative stress by increasing reactive oxygen species (ROS) including superoxide radicals (O∙2−
), hydrogen peroxides (H2O2) and hydroxyl radicals (OH∙) (Botella et al. 2005). To mitigate the oxidative damage induced by ROS, plants employ a variety of enzymatic and non-enzymatic antioxidant defenses. Enzymatic antioxidant systems typically consist of several antioxidant enzymes that participate in the detoxification of ROS. In this chapter, the change in lipid peroxidation in terms of malondialdehyde (MDA) concentration, and the activities of superoxide dismutase (SOD), catalase (CAT), ascorbate pe roxide (APX) and glutathione reductase (GR) in the shoots and roots of Kentucky bluegrass (KBG) and Tall fescue (TF) under salinity stress were investigated.
MATERIALS AND METHODS
The plant materials and salt stress treatments were the same as those described in the Chapter 2. After harvested, fresh shoot and root samples were collected from both species for enzyme analysis. Samples were frozen in liquid nitrogen immediately after harvesting and stored at
−70C until enzyme assays were performed. For protein and enzymes extractions, samples (0.15 g of shoot and 0.2 g of root) were ground to a powder using a mortar and pestle pre-cooled with