JAIST Repository
https://dspace.jaist.ac.jp/
Title 不完全なフィードバックを持つサイバーフィジカルシ
ステムのためのデータ復元スキーム
Author(s) Nower, Naushin Citation
Issue Date 2015‑03
Type Thesis or Dissertation Text version ETD
URL http://hdl.handle.net/10119/12747 Rights
Description Supervisor:リム 勇仁, 情報科学研究科, 博士
Data Recovery Schemes for Cyber-Physical Systems with Incomplete Feedback
by
Naushin Nower
submitted to
Japan Advanced Institute of Science and Technology in partial fulfillment of the requirements
for the degree of Doctor of Philosophy
Supervisor: Associate Professor Yuto Lim
School of Information Science
Japan Advanced Institute of Science and Technology
March, 2015
Abstract
Now-a-days real-time systems have been intensively explored by the research com- munity around the world due to many future technologies require real-time processing.
Enormous efforts have been made on the upcoming technologies such as Internet of Things (IoT), Machine-to-machine (M2M), Cyber-Physical systems (CPS), Big data etc. These new technologies rely on wireless sensor and actuator networks (WSAN) as a communica- tion media to perform real-time control and communication. However, by using WSAN, the point-to-multipoint mode of communication cannot guarantee reliable and real-time communication. Thus unreliable communication severely degrades the overall system per- formance and as well as it can affect the control and computation of the real-time system.
To ensure real-time and guaranteed communication for point-to-multipoint configuration, data recovery scheme is needed. One of the examples of real-time point-to-multipoint sys- tems is CPS, which enable orchestrating networked computational resources with physical systems. Moreover, CPS have many benefits over conventional network control system in terms of network integration and scalability point of view and also attract attention in a variety of different areas such as smart grid, health care, intelligent transportation, etc.
CPS enable the virtual world to interact with the physical world in order to monitor and control the intended parameter in real-time basis through the feedback control loop.
Thus, the proper timing and accuracy of feedback data is very important for the inter- action between the cyber and the physical world. Therefore a data recovery scheme is designed to ensure uninterrupted control in CPS.
This dissertation concerns research of technological issues for analysis of data, design and evaluation of a data recovery algorithm and error minimization from the recovered data. The overall objective of this dissertation is to develop a data recovery scheme, which provides quality of result in terms of efficiency and real-time.
In the data analysis part, the data patterns of various physical systems are investigated and a general classification is made according to the property such as data series with small variation, or large variation and/or repetition exist on the data series. To recover
various patterns it is important to know the nature of their underlying property. To do this, a data pattern analyzer is proposed which is able to classify various data patterns, as a data pre-processing step. iHouse data and Intel Berkeley Research lab data are examined using the analyzer.
Some data series remain stable with small change time and some time it is highly cor- related with space. Thus to recover this, a data recovery scheme, called Efficient spatial data recovery (ESDR) scheme is proposed. In this scheme, a recovery algorithm is pre- sented with Pearson correlation coefficient (PCC) to efficiently solve the long consecutive missing data. The proposed scheme is evaluated on iHouse data. On the other hand some data patterns have a randomness and variation in its nature, which make a great chal- lenge to maintain the real-time control whenever the data is lost. To handle these kind of data, an Efficient Temporal and Spatial Data Recovery (ETSDR) scheme is proposed.
The proposed scheme consists of two phases. In the first phase, which is pre-processing step, the temporal model is identified for large variation data and determined the spatial effects of neighbors. Auto Regressive Integrated Moving Average (ARIMA) model is a very powerful model to identify the auto-correlated nature or trend of a data series. In the next phase, which is real-time/online, temporal model and spatial effect is utilized to recover missing data.
Moreover to improve the recovered data, Kalman filter is used to reduce the error from the model estimated data. The temporal model, generated from ARIMA has internal errors and the model parameters may not remain constant. Thus, to improve the accuracy of the estimated data, a Kalman filter is incorporated to reduce the error. Before that, the window for Kalman filter is fixed to determine the proper process noise co-variance in real-time. Numerical results reveal that the proposed ETSDR/EM are very promising regardless of the increment percentage of missing data in terms quality of result (QoR).
This proposed research can help the development of CPS applications by ensuring uninterrupted control.
Keywords: Data recovery, correlation, cyber-physical systems, real-time, quality of result.
Acknowledgments
I would like to first express my greatest gratitude to my principal advisor, Associate Professor Dr. Yuto Lim, who encouraged and advised the idea from the beginning to the end of my dissertation. I am delighted and grateful to be able to work under his excellent supervision.
I gratefully acknowledge the generous support and cooperation of Professor Dr. Yasuo Tan, who is my sub supervisor. He gave a lot of valuable comments and intellectual effort to my research. He helped me to realize how to do the realistic and scientific research.
I am deeply grateful to my minor research supervisor Associate Professor Dr. Masashi Unoki, who has provided me the knowledge on prediction during my minor research work. Since I am very newbie in the signal processing field, he gave a helpful guidelines, discussions and suggestions on my research.
I also thank Professor Dr. Mineo Kaneko, Japan Advanced Institute of Science and Technology, and Dr. Bing Zhang, NICT, for serving on my dissertation committee.
I am thankful to all members of Tan and Lim Lab for their support and cooperation.
Special thanks to my lab member Wai Wai Shein and Kho Lee Chin for their helpful discussions and mental support.
Finally, I would like to thank my lovely family members for their never-ending love, support and prayer.
Contents
Abstract i
Acknowledgments iii
List of Figures vii
List of Tables x
1 Introduction 1
1.1 Overview of Cyber-physical Systems (CPS) . . . 2
1.2 Application Domains of CPS . . . 4
1.3 Current Research on CPS . . . 4
1.4 Incomplete Feedback of CPS . . . 6
1.5 Research Problem and Motivations . . . 7
1.6 Dissertation Purpose and Objectives . . . 10
1.7 Dissertation Contribution . . . 11
1.8 Dissertation Outline . . . 11
2 Background, Classification and Framework 13 2.1 Introduction . . . 13
2.2 Background Research . . . 14
2.3 Types of Missing Data . . . 16
2.4 Data Patterns . . . 17
2.5 Wireless Sensor and Actuator Network (WSAN) . . . 18
2.5.1 Correlation in WSAN . . . 19
2.6 Framework of CPS based Data Recovery Scheme . . . 20
2.6.1 Data Pattern Analyzer . . . 21
2.7 Summary . . . 24
3 Data Recovery Scheme with Spatial Correlations 25 3.1 Introduction . . . 25
3.2 Related Works . . . 26
3.3 Efficient Spatial Data Recovery Scheme . . . 27
3.4 Performance Metrics . . . 29
3.5 Numerical Simulation . . . 32
3.5.1 Simulation Scenario . . . 32
3.5.2 Simulation Result and Discussion . . . 33
3.6 Summary . . . 35
4 Data Recovery Scheme with Temporal and Spatial Correlations 36 4.1 Introduction . . . 36
4.2 Temporal Model Construction . . . 37
4.3 Proposed ETSDR Scheme . . . 41
4.4 Numerical Simulations . . . 43
4.4.1 Simulation Results and Discussion . . . 47
4.5 Concluding Remarks . . . 49
5 Error Minimization of Data Recovery Scheme 52 5.1 Introduction . . . 52
5.2 Quality of Result . . . 53
5.3 Proposed Data Recovery with Kalman Filter . . . 55
5.3.1 Modeling of Temporal Model in Kalman Filter . . . 56
5.4 Numerical Simulations . . . 59
5.5 Simulation Results and Discussion . . . 61
5.6 Concluding Remarks . . . 63
6 Conclusion and Future Research 64 6.1 Conclusion . . . 64
6.2 Future Work . . . 65
A Noisy Data Restoration Scheme 67
A.1 Proposed Scheme . . . 72
A.1.1 Modeling of Instantaneous Amplitude and Phase in Kalman Filter . 72 A.1.2 Assumptions and Noise Modeling in Kalman Filter . . . 75
A.2 Algorithm Implementation . . . 78
A.2.1 An Auditory-motivated Filterbank . . . 78
A.2.2 Calculation of Instantaneous Amplitude and Phase . . . 78
A.2.3 Linear Prediction . . . 79
A.3 Evaluation and Discussion . . . 83
A.3.1 Effectiveness of Phase . . . 86
A.3.2 Evaluation on Pink and Babble Noise . . . 87
A.4 Conclusion . . . 88
B List of Abbreviations 91
C List of Symbols 93
References 95
List of Publications 104
List of Figures
1.1 Architecture of CPS. . . 3
1.2 (a) Conventional CPS and (b) CPS with proposed data recovery scheme . 7 2.1 Sensor data conversion . . . 17
2.2 Framework of CPS based data recovery scheme . . . 21
2.3 Overview of the proposed data recovery scheme . . . 22
2.4 Block diagram of data pattern analyzer . . . 23
3.1 CPS with proposed ESDR data recovery scheme . . . 26
3.2 Proposed flowchart with ESDR scheme for CPS. . . 28
3.3 Pseudo code for ESDR algorithm . . . 30
3.4 (a) iHouse facilities (b) Layout of 2nd floor . . . 32
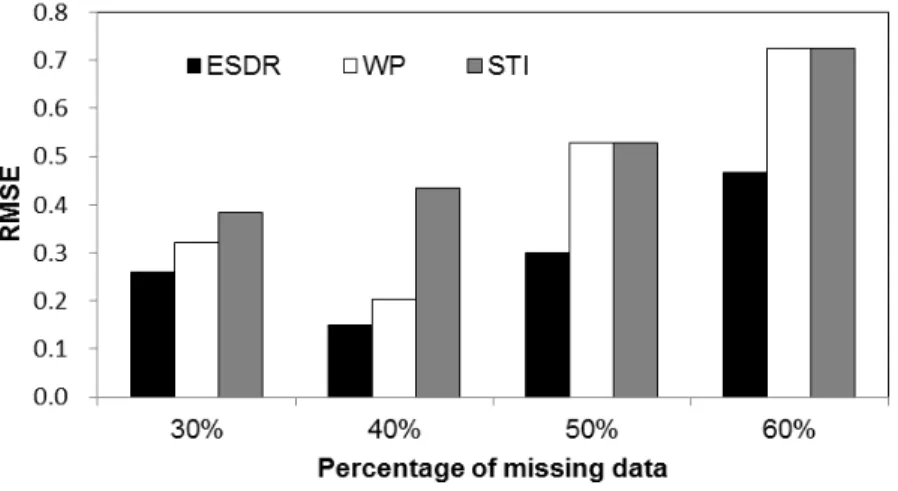
3.5 The comparison of RMSE of all the data recovery algorithms as the per- centage of missing data changes from 30% to 60%. . . 33
3.6 The comparison of MAE of all the data recovery algorithms as the percent- age of missing data changes from 30% to 60%. . . 34
3.7 The comparison of IAE of all the data recovery algorithms as the percentage of missing data changes from 30% to 60%. . . 35
4.1 Proposed ETSDR data recovery scheme of CPS . . . 37
4.2 Flowchart of temporal model construction . . . 40
4.3 Flowchart of ETSDR scheme . . . 42
4.4 An example of 5-sensors scenario . . . 43
4.5 Pseudo-code for efficient temporal and spatial data recovery algorithm . . . 44
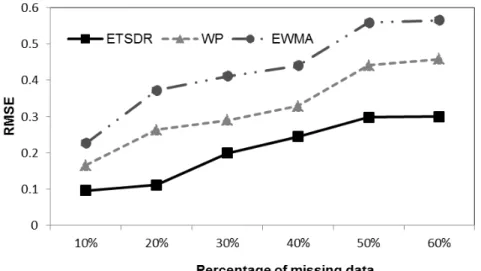
4.6 Error of the measured data from each sensor and the corresponding model computed data to determine the spatial regressive threshold . . . 46 4.7 The comparison of RMSE of all the data recovery algorithms as the per-
centage of missing data changes from 10% to 60% . . . 48 4.8 The comparison of MAE of all the data recovery algorithms as the percent-
age of missing data changes from 10% to 60% . . . 49 4.9 The comparison of IAE of all the data recovery algorithms as the percentage
of missing data changes from 10% to 60% . . . 50 4.10 The comparison of ECG data’s RMSE of all the data recovery algorithms
as the percentage of missing data changes from 10% to 60% . . . 50 4.11 The comparison of ECG data’s MAE of all the data recovery algorithms
as the percentage of missing data changes from 10% to 60% . . . 51 4.12 The comparison of ECG data’s IAE of all the data recovery algorithms as
the percentage of missing data changes from 10% to 60% . . . 51 5.1 Proposed data recovery scheme for control view of CPS . . . 53 5.2 Efficiency vs. execution time in (a) hard and (b)soft real-time systems . . . 54 5.3 (a) Flowchart of ETSDR/EM algorithm (b)Steps of KF for error reduction. 56 5.4 Determination of window size for stableQ . . . 58 5.5 Pseudo code for ETSDR/EM . . . 60 5.6 Comparison of (a) RMSE (b) MAE and (c) IAE of all the data recovery
algorithms as the percentage of missing data changes from 10% to 60% and (d) average percentage of QoR of algorithms for 10% to 60% missing data 62 6.1 Overall of dissertation. . . 65 A.1 Block diagram of proposed scheme (non-blind method) for speech enhance-
ment. . . 71 A.2 Analysis results of observation noise in Eq. (A.9): (a) normalized PSD of
VA,k and (b) distribution of VA,k in 28th channel. . . 76 A.3 Analysis results of observation noise in Eq. (A.10): (a) normalized PSD of
Vφ,k and (b) distribution of Vφ,k in 28th channel. . . 76
A.4 Analysis results of driving noise in Eq. (A.7): (a) normalized PSD ofWA,k
and (b) distribution of WA,k in 28th channel. . . 77 A.5 Analysis results of driving noise in Eq. (A.8): (a) normalized PSD ofWφ,k
and (b) distribution of Wφ,k in 28th channel. . . 78 A.6 Example of (a) instantaneous amplitude SA,k[m] and (b) instantaneous
unwrapped phase Sφ,k[m] extraction in a sub-band (channel k=28) using Gammatone filterbank. . . 79 A.7 Block diagram of proposed scheme (blind method) for speech enhancement. 80 A.8 Example of spectrum analysis of LP coefficient similarities on three different
speakers and contents: (a) instantaneous amplitude and (b) phase. . . 82 A.9 Improvements in restoration accuracy of the non-blind Kalman filter method:
(a) improved Corr. and (b) improved SERs. SNR = 20 dB to −10 dB. . . 84 A.10 Improvements in restoration accuracy of the blind Kalman filter method:
(a) improved Corrs and (b) improved SERs. SNR = 20 dB to −10 dB. . . 85 A.11 Example of comparison among (a) Clean, Restored and Noisy instanta-
neous amplitude and (b) Clean, Restored and Noisy instantaneous un- wrapped phase in a sub-band(channel k = 28) by proposed blind Kalman filtering. SNR=−10 dB noise (white). . . 86 A.12 Improvements in restoration accuracy of the Wiener filter method: (a)
improved Corrs and (b) improved SERs. SNR= 20 dB to −10 dB. . . 87 A.13 Improvements in restoration accuracy of amplitude only using the blind
Kalman filter method: (a) improved Corr. and (b) improved SERs. SNR=
20 dB to −10 dB. . . 88 A.14 Improvements in restoration accuracy of the blind Kalman filter method
in pink noise condition: (a) improved Corr. and (b) improved SER. SNR=
−2.07 dB. . . 89 A.15 Improvements in restoration accuracy of the blind Kalman filter method
in babble noise condition: (a) improved Corr. and (b) improved SER.
SNR=−5.60 dB. . . 89
List of Tables
3.1 Correlation Degree of Pearson Correlation Coefficient . . . 29
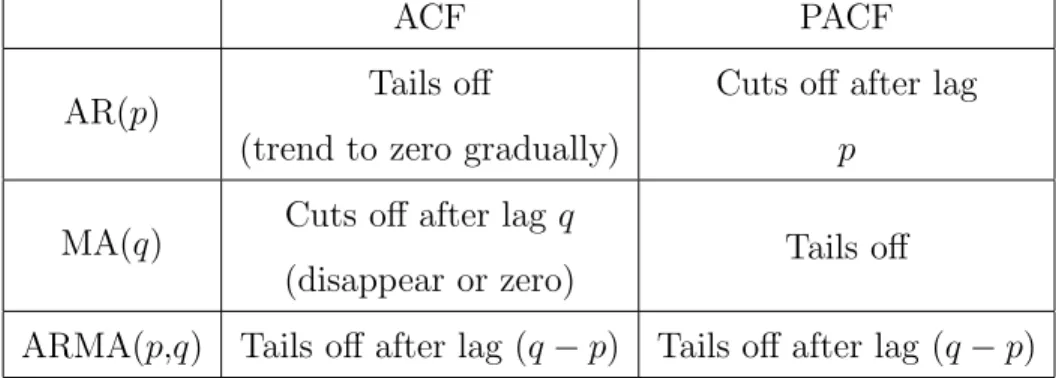
4.1 Properties of ACF and PACF . . . 41
4.2 Parameter settings of first simulation . . . 45
4.3 Parameter settings of second simulation . . . 47
5.1 Execution time in unit of seconds . . . 62
A.1 Comparison of result of PESQ and SNR loss (averaged values). . . 90
A.2 Comparison of restored speech with amplitude only restoration and phase only restoration (averaged values). . . 90
Chapter 1 Introduction
In many future technologies, Internet of things (IoT), Big data, Cyber-Physical Systems (CPS), Machine-to-Machine (M2M) require real-time processing. The purpose of these systems is to connect as much as devices and to ensure anywhere anytime communication in real-time. These new technologies rely on WSAN as a communication media to perform real-time. Communication media transports packet in different forms of communications, like unicast, multi-cast, broadcast and any-cast. Among them, multi-cast and broadcast are unreliable. To ensure data are transmitting in real-time, line configuration is used.
Line configuration can be point-to-point or point-to-multi point. To deal with real-time, point-to-point is not a problem, but point-to-multi-point can not guarantee reliable data transmission. Thus, to ensure real-time and reliable communication for point-to-multi- point, data recovery scheme is needed for any real-time system. One of the example of emerging real-time point-to-multi point system could be CPS.
Recently, CPS have emerged as a prominent direction because of the communications of physical and virtual worlds. CPS perform sophisticated interaction between cyber and the physical entities through closed feedback control loops. This interaction, that is feedback control loop plays an important role in any networked control system specially for CPS which have a huge number of potential applications. Thus, feedback data loss can severely degrade the overall system performance and as well as it can affect the control and computation of the CPS. CPS have received a great deal of attention recently in a wide varieties of emerging and time-critical applications with different data patterns [1].
In wide varieties of applications, feedback control loop from WSAN must be present on
time to ensure real-time control. To maintain uninterrupted control, it is always needed to ensure the continuous presence of feedback data, which is frequently lost, corrupted or delayed due to nature of WSAN. This dissertation deals with design and implementation of an data recovery scheme to ensure uninterrupted feedback control for CPS.
1.1 Overview of Cyber-physical Systems (CPS)
CPS enable the virtual world to interact with the physical world in order to monitor and control the intended parameter in real-time basis. In CPS, technologies such as commu- nication, control, computation, cognition and sensing converge to create new technologies for a smarter society [2]. The area of CPS represents the intersection of several system trends, such as real-time embedded systems, distributed systems, control systems and networked wireless systems.
To facilitate communications between the cyber and the physical world, WSAN is an essential component of CPS. This is because, the traditional wireless sensor network (WSN) is limited in its ability to monitor the physical world [2]. However, CPS achieve this requirement by the combination of sensing, interaction and changing the physical world in real-time by using feedback control loop. In a typical CPS application, sensor nodes collect information from the physical world as a source of CPS input. Upon receiving the input information, a controller makes a corresponding decision by computing and actuators perform a corresponding action in the physical world through the closed-loop feedback. Thus, the proper timing and accuracy of feedback data is very important for the interaction between the cyber and the physical world. Figure 1.1 shows the shows the basic architecture of CPS, where cyber and physical world make interaction through feedback control loop.
The special characteristics of CPS in [3] are: CPS model must represent for physical world, sensors and actuators, hardware platform, software, network and control system.
Obviously, CPS are different form desktop computing, traditional embedded/real-time systems, and WSN. However, they have some different characteristics as defined in [3], [4]
and [5]:
• Cyber capability in every physical component and resource constraint:
Sensing
Actuation Physical (continuous) Cyber
(discrete)
CPS (hybrid)
Figure 1.1: Architecture of CPS.
CPS emphasis on computational elements, and link between the computational and physical elements. But in the embedded system, emphasis is provided on the information processing unit only and the system resources are usually limited.
• Closely integrated: CPS deeply integrate communications and computation with physical processes.
• Networked at multiple and extreme scales: In CPS, networks such as, wired/wireless network, Wi-Fi, Bluetooth and GSM, and etc are included at a multiple and extreme scale to improve the scalability.
• Complex multiple temporal and spatial scale: In CPS, the different com- ponents likely have unequal granularity of time and spatiality. CPS are strictly constrained by spatiality and real-time capacity.
• Dynamically recognizing/re-configuring: CPS, as very complicated and large- scale systems, must have adaptive capabilities.
• Closed-loop control and high degrees of automation: CPS provide conve- nient human-machine interaction, and advanced feedback control technologies are widely applied to these systems.
• Operation must be dependable and certified in some cases: Reliability and security are necessary for CPS because of its extreme scales and complexities.
1.2 Application Domains of CPS
In recent years, CPS become a very active research field for engineers and researchers because of its potential to realize the vision of smarter world.
The applicability of CPS is found in numerous time-critical applications including smart house to smart grid. Emerging applications of CPS include, medical devices and systems, aerospace systems, transportation vehicles and intelligent highways, defense sys- tems, robotic systems, process control, factory automation, building and environmental control, smart spaces, intelligent home and so on [2]. These systems are equipped with a large network of sensors distributed across different components, which leads to a huge amount of measured data available to the system controller. For example, CPS can be used in the medical health care applications, where various types of sensors are used to monitor patient’s condition and then controller communicates with doctor using the feed- back closed control loop system. Thus, the doctor can remotely monitor the patient’s physical condition, give suggestions or prescriptions and also do remotely guided robotic microsurgery. Moreover, CPS are planning to use in more complex situation, in particular robot-assisted MRI guided interventions on aortic valve implantation, cardiac surgery, etc [7]. In these time-critical applications, the accuracy and real-time presence of feedback data is very essential for the controller to make a real-time and highly reliable decision.
1.3 Current Research on CPS
CPS are integration of computation, networking, and physical dynamics, in which em- bedded devices such as sensors and actuators are networked to sense, monitor and control the physical world. It is expected that in both the academic and industrial communities, CPS will have great technical, economic and societal impacts in the near future. The CPS of tomorrow will far exceed those of today in terms of both performance and effi- ciency. The realm of CPS is opening up unprecedented opportunities for research and development in numerous disciplines, e.g. computing, communications, and control. In recent years, CPS have been attracting attention from a rapidly-increasing number of re- searchers and engineers. According to the US National Science Foundation (NSF), CPS is identified as a key area of research [8]. Starting from the 2006, the NSF and other United
States federal agencies organized several workshops, conferences and provided grants on CPS. However, to fully exploit the potential of CPS, many research challenges must be overcome. There are considerable challenges, particularly because the physical compo- nents of such systems requires safety, efficiency, real-time and reliability requirements qualitatively different from those in general-purpose computing. Moreover, physical com- ponents are qualitatively different from object-oriented software components also. As a result, CPS need advanced approaches for building abstractions and architectures to enable control, communication and computing integration. The architectures and abstrac- tion should allow the integration and interoperability of different heterogeneous systems.
Besides these, current research on CPS also concretes on distributed computations and networked control area. To meet the high reliability and security requirements for CPS, new frameworks, algorithms, methods, and tools, software, variable time delays, failures, reconfiguration, and distributed decision support systems are potential area of research to interact with the physical environment. Research on software components, operat- ing systems and middleware are also going on for CPS. Software for CPS must be highly dependable, re-configurable, and, where required, certifiable, from components to fully in- tegrated systems. Some of the current research on specific CPS applications are described below.
CPS play a major role in the design and implementation of intelligent transportation system (ITS). The ITS are designed to address a range of problems including congestion, fuel consumption, and thus improving cost and safety of our roadways [9]. According to [10], there exits numerous research challenges for ITS due to (a) physical/environmental factors, such as mobility and speed of vehicles, density of vehicles, characteristics of the wireless radio channel, and power and bit rate of radio transceivers, and (b) cyber issues, such as MAC layer access point associations and address resolutions (ARP), network layer addressing, routing and hand-offs, and transport layer re-transmissions lead to un- predictability in the timely and reliable dissemination of information to drivers and so on.
The research on CPS in health care is another promising area of research. In CPS, the combination of active user input such as, feedback system, digital records of patient data, and passive user input such as bio-sensors and/or smart devices in health care environ-
ments can support the data acquisition for efficient decision making [11]. This combination of data acquisition and decision making system is yet to be rigorously explored in health care applications and, therefore, such combination is a matter of high research interest.
In health-care applications, bio-medical sensors are responsible for collecting important physiological data and these data are fed to the processing and communication system for further use. Opportunities of utilizing CPS in health care include the introduction of coordinated interoperation of autonomous and adaptive devices, as well as new concepts for managing and operating medical physical systems using computation and control, miniaturized implantable smart devices, body area networks, programmable materials, and new fabrication approaches [12], [13].
Smart grid and renewable energy research and development has been in the forefront of research interest and is therefore a high priority for policy makers. In a smart grid, a variety of communication networks are interconnected to the electric grid for the purpose of sensing, protection, monitoring, and control. Most recently, these networks include connections between suppliers, consumers, stakeholders in economic markets, and inde- pendent system operators [14]. In order to implement the smart grid promise we have to utilize CPS that can able to monitor, communicate and control information and actions on the real world. CPS is viewed as an integral part of the smart grid, however, several challenges is needed to be effectively addressed.
Besides these research challenges, CPS control imposes considerable quality of service (QoS) requirements on WSAN. Depending on the type of application, QoS in WSAN can be characterized by timeliness, reliability, robustness, availability, and security, among others. The unique requirements of CPS make it quite difficult to provide QoS support in control systems over WSAN. Some major challenges to control in CPS over WSAN are re- source constraints, platform heterogeneity, unpredictable wireless channel characteristics, dynamic network topology and heterogeneous data etc.
1.4 Incomplete Feedback of CPS
CPS monitor and control the physical processes by using the feedback loops where physical processes affect computations and vice versa [1]. Based on this feedback, the computation and actuation is performed on the physical world. Thus, feedback makes the interaction
Figure 1.2: (a) Conventional CPS and (b) CPS with proposed data recovery scheme between the physical and the cyber world. The concept of CPS is not valid without this interaction through feedback. Feedback loop deals with the regulation of the characteris- tics of a CPS. The main idea of feedback control is to exploit measurements of the system, to determine the control commands that yield the desired system behavior. A controller, together with some sensors and actuators, is usually used to sense the operation of the physical system, compare it against the desired behavior, compute control commands, and perform actions onto the system to effect the desired change. This feedback architecture of a cyber-physical control system is regarded as a closed loop, implying that the cyber space and the physical system are able to affect each other. The proper timing and accu- racy of feedback data is very important for interaction between the cyber and the physical world. However, the controlling decision is hampered, when the measurement from the sensor missed or lost which forms incomplete feedback. This incomplete feedback affects the control and performance of CPS.
1.5 Research Problem and Motivations
Extensive research efforts have been made to develop a variety of time-critical applica- tions in CPS, including smart house to smart grid such as intelligent transport system, environmental monitoring, energy management, heath-care, security control, etc. In all of these applications, CPS exploit the physical information collected by WSAN, thus it also inherit the wireless contention problem of WSAN. This is a challenging issue for
control in real-time. Wireless channels have many adverse properties like path loss, fad- ing, adjacent channel interference, node/link failure, etc. Besides these, wireless signal can be easily affected by noise, physical obstacles, node movement, environmental change and so on [15]-[16]. Because of this unpredictable and dynamic nature, sensing data loss is a common phenomenon, which makes hamper in controlling decision. In particular, for time-critical applications, feedback data must have to arrive on time, to make de- cision. In many cases, re-transmission cannot provide appropriate solution because of the unpredictable network behavior, which can cause high delay. To maintain uninter- rupted control, we always need to ensure the continuous presence of feedback data. The Fig. 1.2(a) shows the conventional CPS and Fig. 1.2(b) depicts proposed data recovery scheme for point-multi point CPS.
On the other hand, in a wide spectrum of CPS applications, different data properties are observed in different applications. In these applications, systems use a large network of sensors distributed across different areas, which leads to a huge amount of measured data available to the system controller. These measurements are collected continuously along the time, they can be regarded as a time series data. These time series data also have different patterns in terms of their shape, trend, variation and periodicity. Some series maintain stable stage, some show stochastic behavior and others exhibit repetition in their evolution. By considering different CPS applications, data patterns are classified:
data with small variation, data with large variation
. Therefore, to handle any uncertainty it is better to know the behavior or trend of the data.
Data recovery is a part of most research and there exist several methods to handle this. Even-though, there exist several methods, the recovery of data loss for CPS still poses an open problem because of its unique requirement. The whole recovery process for CPS must be held in real-time and invisible to the outside world.
No universal method seems to be superior for every data set. Even if one methodology works well with one type of data set, the results often cannot be repeated on other data sets. This is due to the underlying distributions in the data sets, temporal and spatial correlations between them, the amount of missing values and the sample size. Data recovery methodologies can create biases with imputed values if the correct underlying
behavior of the data set is not known and applied. Thus understanding the relationships needed to create a superior imputation method is not a luxury when missing values are present. However, it is also stated that, missing rates of less than 1% are generally considered trivial to deal with and 15% is manageable [17]. As missing values increase to 5−15%, methods that are more sophisticated are required to handle the downfalls of single imputation methods. Due to these problems outlined, it is clear that more work is needed to advance all fields of scientific research [18].
In addition, in the existing literature, there is no direction of data recovery based on data pattern for CPS. Thus, the recovery process without considering the nature can not provide a solution for all. To recover data accurately, it is important to understand the nature of the data and their spatial relationship with others. For time series data, a general tool is needed that can analyze and determine the pattern from the data. Thus, it is important to build an effective data pattern analyzer to analyze the data, for better understanding the underlying properties of collected time series data that control the system operation. Based on the data properties, it is easier to design an effective data recovery algorithm to provide uninterrupted control. Thus, successful determination of data pattern ensure efficient data recovery to maintain continuous control. To achieve our motivation, it is proposed a data pre-processing stage, where the data analyzer is used to classify the data pattern and based on that property, a model is built for real-time recovery process.
For those reasons, the research problems of this dissertation are defined as followed:
• design and implementation of data pattern analyzer to classify the data patterns of CPS applications
• develop algorithms to recover the missing data to ensure the uninterrupted control
• applying Kalman prediction to minimize the error in recovery Then, this dissertation is motivated with three main parts:
i. design and implementation of data pattern analyzer ii. Development of pattern based data recovery algorithm iii. Error minimization using Kalman filter
In the first part, investigation is made on potential CPS applications. Based on inves- tigation of different physical systems, a classification is made based on specific property.
Then, a data pattern analyzer is designed to classified the data stream for CPS. The de- signed analyzer is used to classify by using fast Fourier transform (FFT), auto-correlation coefficient function (ACF) and cumulative sum model.
In the second part, data recovery algorithms are proposed for different data patterns.
Before designing consideration is made on the spatial and temporal correlation among the data pattern. The some pattern almost remains stable with time. Using this stability property with the spatial correlation data is recovered. Some data series is normally highly auto-correlated and have a large temporal variation . ARIMA [19] model is a very powerful model to identify the auto-correlated nature or trend of data series with large variation . The time series data that has inexplicable changes in direction, is analyzed and build a temporal model by modeling it in ARIMA model in pre-processing step. In real-time recovery algorithm, the model and spatial correlation is used to recover data.
Then, evaluation of the data recovery algorithm is shown in terms of root means square error (RMSE), mean absolute error (MAE) and integral of absolute error (IAE).
Third part is regarded with error minimization of the system using Kalman filter.
Kalman filter is applied on the recovered data to improve the accuracy. To get the better result using Kalman filter, a training is made on pre-processing step to get the proper error co-variance. Then the proposed system is evaluated in terms of quality of result (QoR).
1.6 Dissertation Purpose and Objectives
The presence of feedback control loop is very important to make the real-time control- ling decision for CPS applications. However, the unpredictable nature of WSN cannot guarantee the presence of feedback data every time. For these reasons designing the data recovery scheme is critical by ensuring the accurate and real-time presence of feedback data. In addition, it is needed to ensure certain level of accuracy of recovered data. In this aspect, Kalman filter becomes one of the solutions to reduce the error of the recovered data.
The purpose of this research is to develop an data recovery scheme for the application
of CPS technology with different data patterns with high accuracy while maintaining real-time.
In particular, the research objectives are summarized as follows.
1. To classify different data patterns for CPS applications and develop a data pattern analyzer for CPS data patterns.
2. To design a data recovery scheme for different patterns of CPS by considering the spatial and temporal correlation between them.
3. To reduce the error, apply Kalman filter to the recovered data.
1.7 Dissertation Contribution
The contribution of this dissertation fall in three parts concerning respectively data analy- sis and model generation, data recovery algorithms and error minimization using Kalman filter. This dissertation can help the development of CPS application by ensuring reliable and real-time feedback data. In this dissertation, the following specific contributions are made to advancing the state of the art in this area.
1. designing a data pattern analyzer for CPS-based applications by studying the prop- erties of different time series pattern.
2. Presenting algorithms for data recovery of different patterns to ensure accuracy and real-time. Simulation results show that the proposed algorithms give better performance in accuracy and time than the conventional approach.
3. Presenting a error reduction method from the recovered data using a Kalman filter.
Then, the system is evaluated in terms of QoR that is efficiency and time.
1.8 Dissertation Outline
This dissertation is progressed by the following steps:
Step 1. Introduction of the dissertation background, research problem and motivation, dis- sertation objectives and contributions are in Chapter 1.
Step 2. Chapter 2 deals with related knowledge of this dissertation such as background study, types of missing data, WSAN, correlation and the proposed framework of CPS based data recovery scheme.
Step 3. Design and implementation and the evaluation of the data recovery algorithm for data pattern with small variation are presented in Chapter 3.
Step 4. Chapter 4 describes design and implementation and the evaluation of the data recovery algorithm for pattern with large temporal variation.
Step 5. Data recovery with error minimization is presented in Chapter 5.
Step 6. Summary of the dissertation and discussion of future research directions are depicted in Chapter 6.
Chapter 2
Background, Classification and Framework
2.1 Introduction
In recent years, CPS has been attracting attention from a rapidly-increasing number of researchers and engineers. To fully exploit the potential of CPS, however, many challenges must be overcome. Wireless sensor and actuator networks play an essential role in cyber- physical control systems, since they are the bridge between the cyber and physical worlds.
In comparison with the filed of general WSN in which significant progress has been made over the years, WSAN is a relatively new research area yet to be explored. In particular, there is only limited work in the WSAN area targeting cyber-physical control applications.
To ensure to the continuous control for CPS, there is an urgent need to maintain accurate and real-time feedback control data from WSAN.
In the control community, significant effort has been made for data loss compensation.
Despite their differences, most of existing data loss compensation methods are compu- tationally intensive in terms of memory and time and requires iterative steps. For these reasons, they are impractical for real-time CPS control. In addition, they are usually not desirable solutions for resource-constrained WSAN because of overly-large computational overheads [20].
2.2 Background Research
Missing data recovery is a part of most research and there exist several methods to handle this. Although there exists several methods, but the recovery of data loss for CPS still poses an open problem because of its unique requirement. The whole recovery process for CPS must be held in real-time and invisible to the outside world.
In statistics, it has been made an extensive study on missing data. Little and Rubin discuss an overview to statistical missing data imputation techniques, such as least squares estimates, Bartletts ANCOVA and likelihood-based approaches in [21]. Maximum like- lihood (ML), multiple imputation (MI) and expectation maximization (EM) are widely used method for missing data imputation. ML [22] calculates the likelihood function for given set of data, which is a hypothetical probability that uses past event with known out- come. Then, by using iterative steps, ML makes the likelihood function maximum. EM [23] also uses iterative step to maximize the likelihood function but here, model depends on unobserved or latent variables. Based on mean and covariance matrix of multivariate normal distribution, expectation (E) step initializes the expected values for latent vari- ables. Maximization (M) step plugs the expected values into the log-likelihood function and maximizes the log-likelihood function by repeating the E and M steps. However ini- tialization step directly impact the performance of EM based imputation. On the other hand, in MI [24], missing data are filled by m different times to generate m complete data sets. Generated m data sets are analyzed by standard procedure and then combined for inference. But these well known techniques for missing data imputation are not suitable for WSNs, due to their high space and/or time complexities.
Machine learning based imputation methods require sophisticated procedures that use a predictive model to estimate values. These approaches model the missing data estimation by relying information available in the data set. If the observed data contain useful information then, imputation procedure maintains high precision [25]. Multi-layer perceptron (MLP), self organizing map (SOM), k-nearest neighbors (k-NN) are examples of imputation techniques based on learning. MLP is multi-layer computational unit which is connected by feed-forward way. It estimates the missing data by training an MLP to learn incomplete data by using complete data [26]. On the other hand, in SOM, a set of nodes is organized in 2D grid, where each node has a specific position and weight. The
weight is initialized by iterative training steps, and then it is used to estimate missing data [27]. Both of this methods require all data to trained and estimate the missing value.
But in k-NN [28], to impute missing data, only k nearest neighbor’s data is considered.
These techniques are used in WSN to impute data but for real time CPS, these are not suitable.
Compressed sensing (CS) [29] is widely used scheme for signal processing to acquire and reconstruct a signal, based on underdetermined linear systems. This takes advantage of the signals sparseness or compressibility in some domain, allowing the entire signal to be determined from relatively few measurements. However, the main difference between the missing data recovery problem and the conventional CS is that, in the conventional CS, the missing sampling sequence is fixed/ set by the users, and usually random linear projections are preferred, on the other hand, in the missing data recovery problem, the sampling sequence cannot be controlled by the user because it is completely determined by the missing events, e.g., locations or nature of missing nodes in the network which is completely uncertain [46].
Besides these, many researchers combine genetic algorithm (GA) with artificial neural network (ANN) [31], GA with Bayes algorithm [25] and many more to estimate the missing value. Xia, et al. [32] first propose a solution for CPS over WSANs to cope with packet loss. They illustrate three prediction algorithms and show a comparison between them. First algorithm based on the assumption that the state of the physical system does not change during the last sampling period. So, previous sample is used to replace the missing value. The second algorithm computes a moving average of the previous m samples to restore the lost data. Thus it treats every previous measurement equally. In third algorithm weighted average of all previous samples is taken to replace the missing one. Simulation result shows that third algorithm works well compared with others.
Choi, et al. [33] exploit an exponentially weighted moving average (EWMA) based value estimation algorithm to reduce the impact of packet. When some packets are ran- domly dropped in wireless network environment, the EWMA algorithm filters an abrupt increase or decrease by exponentially smoothing commands or data based on the past value profile.
In [34], the authors proposed a data analysis technique to extract meaningful infor-
mation from the large volume of noisy data. Their designed analyzer named Tru-Alarm, is used to recognize trustworthy alarms from the noisy and false alarms. Tru-Alarm esti- mates the positions of objects causing alarms, and from that constructs an object-alarm graph and carries out trustworthiness inference based on the graph links. Their stud- ies also reveal that the alarm trustworthiness and sensor reliability could be mutually enhanced. This property is used to ignore the alarms generated by unreliable sensors.
Moreover, in [35], the authors proposed a method called IntruMine to detect and verify intruders from the untrustworthy data by modeling the relationships between sensor and intruders. The authors discovered the trajectories of intruders from the untrustworthy data by constructing watching network in [36].
In [37] authors discussed about retrieving the atypical events from massive sensor data and analyzing them with spatial, temporal, and other multidimensional information.
Whenever a abnormal event happens such as a congestion is detected in traffic system, the sensor will send out as atypical records. They fixed a threshold for normal event and based on that a atypical event is detected and cluster is formed. The basic cluster is designed to summarize an individual event, and the macro-cluster is used to integrate the information from multiple events. The atypical cluster is then used to effective query execution. Each of the existing analyzer is designed for different purposes and objectives.
None of this can be used for data traffic pattern analysis for data recovery.
In the literature, there exists some model based data aggregation scheme. In [38], au- thors proposed an ARIMA based data aggregation method to reduce the energy consump- tion and number of communication. In their scheme, both sensor node and aggregator have the same model for data generation. Sensor node checks whether the data predicted from the model and measure data is same or not. Whenever, the original value and pre- dicted value remain within the threshold, then the sensor node will refrain to transmit the data to the aggregator. Otherwise, sensor will send the new to the aggregator.
2.3 Types of Missing Data
According to Little and Rubin, there are three types of missing data [21]; missing not at random (MNAR), missing at random (MAR), and missing completely at random (MCAR). In MNAR, the data are missing because of its own observation data. That
is, when the probability of an instance having a missing value for an attribute could de- pend on the value of that attribute. As an example a person with overweight does not want to reveal his weight, thus the value of weight is missed, because of of its own attribute value. In MAR, the data are missing because of the data is depending on other variables.
In this case the probability of an instance having a missing value for an attribute may depend on the value of other attribute, but not on the value of the missing data itself. As an example, women less likely reveal their weight. That is probability of missing (weight) does not depend on data weight, depends on gender. In MCAR, the data are missing because of unpredictable circumstances, e.g., the sending packet of a sensor is loss due to the radio link quality is poor. That is, the probability that an observation (Xi) is missing has no relation to the value of Xi or to the value of any other variables. The focus of this research is to handle MCAR.
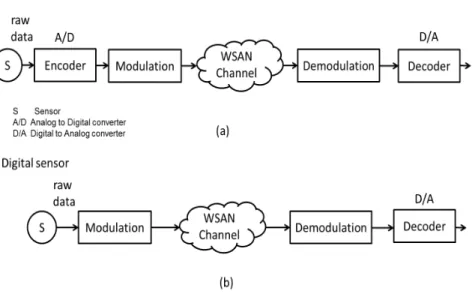
Figure 2.1: Sensor data conversion
2.4 Data Patterns
In CPS, sensors are used for interaction with the physical world. These sensor can be analog and/or digital sensors. In the case of analog sensor, the raw data is encoded and modulation is performed before sending. In the receiver side, the data is decoded by using digital-to-analog converter as shown in Fig. 2.1 (a). These encoded data is
used to recognize patterns. In this thesis, the analog sensor is considered, however, the same procedure can be applicable for digital sensor also by applying the digital to analog conversion as shown in Fig. 2.1 (b).
From the investigation of typical data characteristics in various physical systems, it is identified that the collected data from those systems have a wide range of varieties from one another. To extract the specific properties from the sensors raw data, we investigate temporal (amplitude and frequency) characteristics of sensor data series in different phys- ical systems. This specific property is called patterns. Based on the investigation, the data patterns in physical systems are classified into the following two types
1. Data patterns with small variation: In many physical system the collected data series does not change much for a long time, or the variation of data is very small. For example, the temperature of specific room is controlled at a specific degree during system operation. As a result, collected temperature measurements are remained constant or vary within a small range.
2. Data patterns with large variation: The observed data from many physical systems does not stable and the data changes with time. The data pattern with large vari- ation represents a wide range, among them in this thesis, periodic, non-periodic, stationary and non-stationary are considered. These data patterns are difficult to handle and thus observed data is pre-processed to know their nature. For example some observed time series data contain indeterminacy and randomness in their eval- uation. These data series can be represented by statistical terms or probabilistic forms and may have aperiodicity. These can be further categorized into stationary and non-stationary data regardless to their moments stability. Some measured time series data from different systems show strong periodic patterns due to the regular behavior of physical processes.
2.5 Wireless Sensor and Actuator Network (WSAN)
WSAN is a distributed network system of sensors and actuators. Sensors gather infor- mation about the physical world and actuators perform actions to change the behavior of the physical world. For real deployment, stand-alone WSAN is insufficient. A gateway
device is essential to enable end-to-end connectivity between the sensors and/or actua- tors of WSAN and the Internet devices. The sensor nodes used to detect/estimate event features from the environment, are highly correlated with time and space. The correla- tion among sensor nodes bring significant advantages which can drastically enhance the overall network performance [15] . The characteristics of the correlation in the WSAN is summarized as follows:
2.5.1 Correlation in WSAN
There exist spatial and temporal correlation in WSAN. Spatial correlation means that adjacent observations of the same phenomenon are correlated. However, temporal corre- lation is about proximity in time, while spatial correlation is about proximity in space.
Spatial Correlation: Sensor measurement made at different locations may not be in- dependent. If an environment is highly correlated in space, then the spatial information can be used to estimate missing data and the estimation function can achieve a high accuracy. As an example, measurements made at nearby locations may be similar in value than measurements made at locations farther apart [39]. This phenomenon is called spatial correlation. Spatial correlation measures the correlation of a variable with others through space. Spatial correlation can be positive or negative. Positive spatial correlation occurs when similar values occur near one another. Negative spatial correlation occurs when dissimilar values occur near one another.
Measurement of Spatial Correlation: Most of the spatial correlation regression mea- sures the linear correlation between the nearest neighbors. There are several way to calculate spatial correlation between the sensor nodes. Some are discussed as follows:
1. Moran’s I is used to measure the global spatial correlation among the sensor nodes [40]. It is based on cross-products of the deviations from the mean and is calculated for n observations on a variable x at locations j and k, as follows:
I = n S0
P
j
P
kwjk(xj −x)(x¯ k−x)¯ q
(P
j(xj−x)¯ 2)
(2.1)
where ¯xj is the mean of the x variable, wjk are the elements of the weight matrix, and S0 is the sum of the elements of the weight matrix: S0 =P
j
P
kwjk.
2. Gearys C statistic is another way to calculate the spatial correlation among the sen- sors. It is based on the deviations in responses of each observation with one another [41]. The value of Geary’s C lies between 0 and 2. 1 means no spatial correlation.
Values lower than 1 demonstrate increasing positive spatial correlation, and the values higher than 1 illustrate increasing negative spatial correlation. Geary’s C is inversely related to Moran’s I, but it is not identical. Moran’s I is a measure of global spatial correlation, while Geary’s C is more sensitive to local spatial correlation.
GC = n−1 2S0
P
j
P
kwjk(xj−xk)2 P
j(xj−x)¯ 2 (2.2)
3. Pearson Correlation Coefficient (PCC) is a common measure of the linear correlation between two random variablesxand y. It reflects the degree of association between two variables [42]. Therefore, the coefficient correlation degree of PCC (ρxy) in between two random variablesxandyin specified window size (W) can be computed as follows
ρx,y =
PW
w=1(x(w)−x)(y(w)¯ −y)¯ q
(PW
w=1(x(w)−x)¯ 2)× q
(PW
w=1(y(w)−y)¯ 2)
(2.3) PCC is used in this research because, it a local correlation measurement and using this, the most correlated sensor can be determined.
2.6 Framework of CPS based Data Recovery Scheme
In this section, the proposed framework of data recovery scheme for CPS is presented. The designed data recovery framework contains two phases: i) Pre-processing: data analysis and model construction and ii) Real-time processing: data recovery with error reduction.
The proposed framework is depicted in Fig. 2.2. This chapter deals with data analyzer only and ESDR is presented on Chapter 3 and in Chapter 4, discussion on temporal model and ETSDR are presented. Error minimization with ETSDR is presented on Chapter 5.
The chapter wise overview of the proposed data recovery scheme is depicted on Fig. 2.3.
The aim of the first phase of the proposed framework is to analyze the measured data from the sensor and classify according to the property exits on them. This analysis,
Figure 2.2: Framework of CPS based data recovery scheme
classification and temporal model construction is done in data pre-processing step. In the real-time step, the data recovery algorithm based on the pattern is used to recover the data.
2.6.1 Data Pattern Analyzer
The aim of this step is to classify the data using the analyzer, based on the property present in the data. Initially, there are three property checkers in the data analyzer:
CUSUM [43] is used for checking whether data has very small variation or not, Auto- correlation coefficient function [44] is used to identify the stochastic nature of a series and periodogram [45] is used for periodicity detection of a pattern. The block diagram of the proposed data pattern analyzer is shown in Fig. 2.4. The following assumptions have been considered. First, n observed sensor data is available for analysis. Second, the group of time series data for a applications follow a specific data property.
To identify the pattern with small variation property of a data series CUSUM is calculated. The main feature of stable pattern is that, they have almost constant value or have a very small variation. CUSUM is a widely used sequential analysis technique in process control, to model series with almost constant values and small deviations. It uses
Figure 2.3: Overview of the proposed data recovery scheme
two counters C+ and C− for each time series yt, which accumulate the deviation of yt
above the mean, i.e., yt+µ and below the mean yt−µ, respectively. The values stored in counters C0+ and C0− known as upper CUSUM and lower CUSUM, can be regarded as two time series.
Ct+ =max[0, yt−(µ+tv) +C(t+
−1)] (2.4)
Ct− =max[0, yt−(µ−tv) +C(t−
−1)] (2.5)
where tv represents the tolerance range of yts normal behavior. In this analyzer it is determined as half of yts standard deviation. The deviation error sequence is defined as a rt =max(Ct+, Ct−). If the maximum of deviation errors is smaller than the threshold value δ, i.e., maxrt< δ, the model includes yt and keeps its profile. The threshold value δ set as two times of the standard deviation of yt.
To determine data pattern with large variation, auto-correlation coefficient function (ACF) is used. It is assumed that pattern has aperiodic and stochastic nature. These data series can be further categorized into two types: stationary and non-stationary.
Stationarity, is defined as a quality of a time series data, in which the statistical parameters (mean and variance) of the series do not change with time. The stationary time series
Figure 2.4: Block diagram of data pattern analyzer
data can be determined by examining the auto-correlation coefficient function (ACF) and partial correlation coefficient function (PACF). The ACF is a set of correlation coefficients between the series and lags of itself over time [44]. Auto-correlation finds the correlation of a series against different versions of itself time-shifted by various amounts. Each time-shift amount is called a lag time. The output of an autocorrelation is the correlation amount as a function of lag time. The maximum value will always be at a lag of zero, since a data is always perfectly correlated with an exact copy of itself. The k-order auto-correlation coefficient of a data series y1, y2, .., yn is defined as
rk=
n−k
P
j=1
(yj−y−j)(y(j+k)−y−j)
n
P
j=1
(yj −y−j)2
(2.6)
where, rkis thek-lag sample auto-correlation and ¯yj is the average ofnobservations. The PACF is the partial correlation coefficients between the series and lags of itself over time.
The k-order partial auto-correlation coefficient of a data series is defined as
φ11 =r1 (2.7) φ22= (r2−r12)(1−r12) (2.8) φkj =φ(k−1)j−φkkφ(k−1)(k−j) (2.9) φkk=rk−
k−1
P
j=1
φ(k−1)rk−j
, 1−
k−1
X
j=1
φ(k−1)rj (2.10)
For the stationary time series, the ACF and PACF trend to zero gradually (die out).
On the other hand, for non-stationary data series, the value of ACF and PACF remain for a long time. The analyzer uses this property to determine different the types data.
For data series with small variation the ACF remains almost constant and for periodic pattern, ACF shows periodicity.
A periodogram is used to identify the dominant periods (or frequencies) of a time series data. This is very a helpful tool for identifying the dominant cyclical behavior in a series, particularly when the cycles are not related to the commonly encountered seasonality.
The periodogram of repeated data series contains a dominant spike in their evaluation.
Periodogram is calculated as follows
P eriodogram= abs(f f t(yj))2
n (2.11)
where n is the number of sample in a series y The checker integrator combines the result from the all three property and makes decision based on the percentage of data follows that property.
2.7 Summary
In this chapter, the background study, basic definitions and overall framework of CPS based data recovery scheme are presented. Inside the framework the first step to analyze the data for classification. Initially, three pattern checker is used and in future more can be added to improve it.
Chapter 3
Data Recovery Scheme with Spatial Correlations
3.1 Introduction
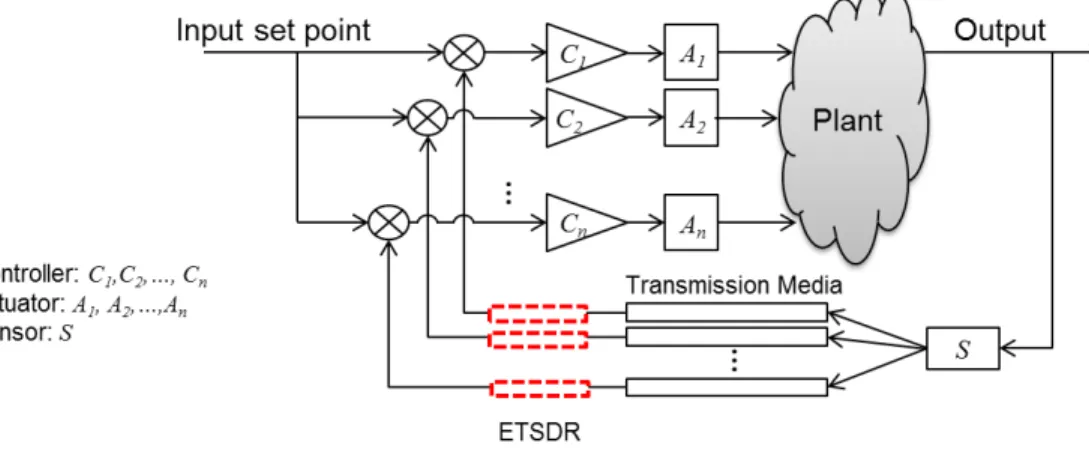
In many physical systems, the sensor data maintain high spatial correlation and their evaluation maintain change with small deviation normally. However, in many applications high accuracy of data is recommended and environment can change suddenly because of fire, earthquake etc. To deal with this kind of scenario, we need a data recovery scheme that can handle insufficient feedback control information. In this chapter, a highly Efficient Spatial Data Recovery (ESDR) scheme is proposed that deals with CPS. To do this, a framework structure for the CPS is designed with the proposed data recovery scheme. The designed framework incorporates the proposed ESDR scheme, which is based on the spatial correlation of neighboring sensors by using the Pearson correlation coefficient (PCC). Since sensor data is highly correlated with space and time, the spatial relationship is utilized to recover the lost data.
One of the contributions is that the proposed ESDR scheme ensures timely data recovery because of minimum computation. Second, the proposed ESDR scheme is used to examine the smart home environment with CPS approach in order to maintain desired room temperature at different locations. Thus, the feedback measured room temperature is very important to keep the desired room temperature steadily at all the times. Another advantage is that, the proposed scheme ensures scalability. Since it uses only one-hop
Figure 3.1: CPS with proposed ESDR data recovery scheme neighbors, thus the scheme can be applicable in both small and large network.
The rest of this chapter is organized as follows. In Section 3.2, the existing research works are presented. The proposed ESDR scheme is presented in section 3.3. In section 3.4 performance metrics are described. Simulation scenario and result are discussed in section 3.5 and section 3.5 summarizes this chapter.
3.2 Related Works
The following section reviews the existing research on spatial correlation based data esti- mation on wireless sensor network.
Guo, et al. [46] design an algorithm considering spatial-temporal correlations of sensor nodes, which is more suitable with WSNs due to nature of WSNs. Their algorithm first checks if a neighbor sensor node is within the missing sensors sensing range. Then the observation from the neighbor is used for filling in the missing values. This generates a spatially correlated replacement. If there are multiple neighbors within the sensors range and they do not have the same readings, the majority reading is chosen. But in real life, there is no guarantee that all the sensors within one-hop neighbor are spatially and temporally correlated.
In the existing literature, there are other two ways to investigate the spatial correlation for missing data recovery, which is inverse distance weighted averaging (IDWA) [47] and Kriging [48]. The IDWA, which is relatively fast and easy to compute, is one of the most widely used methods for computing spatial interpolation [47]. Assuming the spatial correlation in adjacent sensors is uniform, IDWA tries to estimate the values of missing data in the form of some linear combination of neighboring sensors data. The weights for
the linear combination only depend on the distance between the sensors. The weight is higher for the sensor which is situated in large distance compare to the close one. Thus, IDWA will work well if the values of missing sensors are expected to be similar to values of the neighboring sensors. However, this assumption affects the estimation accuracy in many practical situations, where a physical phenomenon varies rather than uniformly increasing or decreasing in magnitude. The averaging process in IDWA has the tendency to smoother the data, which is not suitable for the situation when data change fast in the area of interest.
Kriging is another way to estimate the missing samples using the combination of available measurements. It defines a semi-variogram by calculating the spatial correlation between sensors. From the semi variogram, the weight for the linear combination is determined. As a result, these weights vary spatially and depend on the correlation [48].
It is assumed that the historical variogram is known and can approximately represent the current variogram. Missing samples are estimated based on the historical variogram function. However, the spatial interpolation may not be right if the semi-variogram varies a lot in the temporal dimension .
3.3 Efficient Spatial Data Recovery Scheme
In this section, the proposed data recovery scheme for CPS, called efficient spatial data recovery (ESDR) scheme is presented. In this research, the ESDR scheme is designed to mitigate the problem of MCAR.
To deploy the proposed ESDR scheme, a flowchart with the ESDR scheme for CPS is depicted in Fig. 3.2. The following assumptions have been considered. First, the historical data set for one-hop neighbor is available up to window size to perform the ESDR scheme.
Second, the error offset (e0) of the measured data and estimated data is initially computed and known. Third, the maximum number of consecutive missing data counter (MC) is fixed at initialization stage. The parameter (MC) is also used for terminating the entire system to indicate the estimated data cannot be produced anymore because of the long consecutive missing data. In the flowchart, the ESDR scheme will compute the estimated data when, there is an input measured data from the sensors. If there is no missing data, then the measured data is used as a feedback data. At the same time the difference
Figure 3.2: Proposed flowchart with ESDR scheme for CPS.
between the measured and estimated data is computed and if the difference is greater then error offset, ESDR scheme is refined to reduce the error. When there is a missing data, the consecutive missing data is evaluated and the estimated data is used as a feedback data.
Most of the spatial correlation for data recovery scheme is focusing on the data cor- relation that based on the difference between the nearest neighbors. In proposed ESDR scheme, it is considered the most spatial correlation among the one-hop neighboring sen- sors based on the Pearson correlation coefficient (PCC) [42]. PCC is a common measure of the linear correlation between a variables of two locationsj andk. It reflects the degree of association between two variables. From the value of PCC, the nature of correlation can be determined. Whenever the value of ρ is 1, it indicates the redundant information produces by that corresponding sensors. Therefore, the coefficient correlation degree of PCC (ρjk) in between two random variables j and k in specified window size (W) can be computed as follows
ρj,k =
PW
w=1(j(w)−¯j)(k(w)−¯k) q
(PW
w=1(j(w)−¯j)2)× q
(PW
w=1(k(w)−k)¯ 2)
(3.1) That is this scheme first compute the most correlated sensor using PCC and then
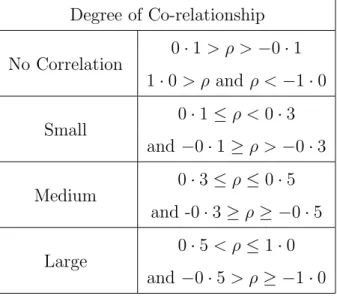
Table 3.1: Correlation Degree of Pearson Correlation Coefficient Degree of Co-relationship
No Correlation 0·1> ρ > −0·1 1·0> ρand ρ <−1·0 Small 0·1≤ρ <0·3
and −0·1≥ρ >−0·3 Medium 0·3≤ρ≤0·5
and -0·3≥ρ≥ −0·5 Large 0·5< ρ≤1·0
and −0·5> ρ≥ −1·0
use that sensor measurement to estimate the missing sensor data. PCC measures local correlation between two sensor rather then global correlation measurement like Morgan’s I. In PCC, if an environment is highly correlated in space, then the spatial information can be used to estimate missing data and the estimation function can achieve a high accuracy.
Table 3.1 shows the association degree of the ρ. The range from −1.0 to 1.0 shows that the ρ has a degree of correlation. The negative value of ρ indicates the negative linear relationship, whereas the positive value of ρ indicates the positive linear relationship.
Fig. 3.3 describes the ESDR algorithm, which is used to produce an estimated data from time to time. In this algorithm, it is assumed that the threshold value of estimation counter (cth) is used to optimize the estimation function of the algorithm. Once the ESDR algorithm cannot use the PCC, it is recommended that the estimated data is produced based on the nearest neighbor data. When the number of estimation counter (cl) for the corresponding of sensor l is above the threshold value, the new corresponding of sensor will be computed again. To maintain high accuracy in estimation, the value of ρ is in between 0.5 to 1.0 is selected.
3.4 Performance Metrics
To evaluate the performance of the said algorithms, the root mean square error (RMSE), the mean absolute error (MAE) and the integral of absolute error (IAE) are computed .