慈恵
ICU勉強会
2014/11/11
松井宏樹
T h e
ne w e ngl a nd jou r na l
o f
m e dicine
n engl j med nejm.org
1
original article
Lower versus Higher Hemoglobin Threshold
for Transfusion in Septic Shock
Lars B. Holst, M.D., Nicolai Haase, M.D., Ph.D., Jørn Wetterslev, M.D., Ph.D.,
Jan Wernerman, M.D., Ph.D., Anne B. Guttormsen, M.D., Ph.D.,
Sari Karlsson, M.D., Ph.D., Pär I. Johansson, M.D., Ph.D.,
Anders Åneman, M.D., Ph.D., Marianne L. Vang, M.D., Robert Winding, M.D.,
Lars Nebrich, M.D., Helle L. Nibro, M.D., Ph.D., Bodil S. Rasmussen, M.D., Ph.D.,
Johnny R.M. Lauridsen, M.D., Jane S. Nielsen, M.D., Anders Oldner, M.D., Ph.D.,
Ville Pettilä, M.D., Ph.D., Maria B. Cronhjort, M.D., Lasse H. Andersen, M.D.,
Ulf G. Pedersen M.D., Nanna Reiter, M.D., Jørgen Wiis, M.D.,
Jonathan O. White, M.D., Lene Russell, M.D., Klaus J. Thornberg, M.D.,
Peter B. Hjortrup, M.D., Rasmus G. Müller, M.D., Morten H. Møller, M.D., Ph.D.,
Morten Steensen, M.D., Inga Tjäder, M.D., Ph.D., Kristina Kilsand, R.N.,
Suzanne Odeberg-Wernerman, M.D., Ph.D., Brit Sjøbø, R.N.,
Helle Bundgaard, M.D., Ph.D., Maria A. Thyø, M.D., David Lodahl, M.D.,
Rikke Mærkedahl, M.D., Carsten Albeck, M.D., Dorte Illum, M.D., Mary Kruse, M.D.,
Per Winkel, M.D., D.M.Sci., and Anders Perner, M.D., Ph.D.,
for the TRISS Trial Group* and the Scandinavian Critical Care Trials Group
From the Department of Intensive Care
(L.B.H., N.H., L.H.A., U.G.P., N.R., J. Wiis,
J.O.W., L.R., K.J.T., P.B.H., R.G.M., M.H.M.,
M.S., A.P.), Copenhagen Trial Unit, Center
for Clinical Intervention Research (J.
Wet-terslev, P.W.), and Section for
Transfu-sion Medicine (P.I.J.), Rigshospitalet and
University of Copenhagen, Copenhagen,
Randers Hospital, Randers (M.L.V., H.B.,
M.A.T.), Herning Hospital, Herning (R.W.,
D.L., R.M.), Hvidovre Hospital, Hvidovre
(L.N., C.A.), Aarhus University Hospital,
Aarhus (H.L.N., D.I.), Aalborg University
Hospital, Aalborg (B.S.R.), Holbæk
Hospi-tal, Holbæk (J.R.M.L.), Kolding HospiHospi-tal,
Kolding (J.S.N.), and Hjørring Hospital,
Hjørring (M.K.) — all in Denmark;
Karo-linska University Hospital, Huddinge,
Stock-holm (J. Wernerman, I.T., K.K., S.O.-W.),
Karolinska University Hospital, Solna (A.O.),
and Södersjukhuset, Stockholm (M.B.C.)
— all in Sweden; Haukeland University
Hospital and University of Bergen, Bergen,
Norway (A.B.G., B.S.); Tampere
Univer-sity Hospital, Tampere (S.K.), and
Hel-sinki University Hospital and University of
Helsinki, Helsinki (V.P.) — all in Finland;
and Liverpool Hospital, Sydney (A.Å.).
Address reprint requests to Dr. Perner at
the Department of Intensive Care,
Rigshos-pitalet, Blegdamsvej 9, DK-2100
Copen-hagen, Denmark, or at anders.perner@
regionh.dk.
* Members of the Transfusion
Require-ments in Septic Shock (TRISS) Trial
Group are listed in the Supplementary
Appendix, available at NEJM.org.
This article was published on October 1,
2014, at NEJM.org.
DOI: 10.1056/NEJMoa1406617
Copyright © 2014 Massachusetts Medical Society.
ABS TR ACT
BACKGROUND
Blood transfusions are frequently given to patients with septic shock. However, the
benefits and harms of different hemoglobin thresholds for transfusion have not
been established.
METHODS
In this multicenter, parallel-group trial, we randomly assigned patients in the
inten-sive care unit (ICU) who had septic shock and a hemoglobin concentration of 9 g
per deciliter or less to receive 1 unit of leukoreduced red cells when the hemoglobin
level was 7 g per deciliter or less (lower threshold) or when the level was 9 g per
deciliter or less (higher threshold) during the ICU stay. The primary outcome
mea-sure was death by 90 days after randomization.
RESULTS
We analyzed data from 998 of 1005 patients (99.3%) who underwent
randomiza-tion. The two intervention groups had similar baseline characteristics. In the ICU,
the lower-threshold group received a median of 1 unit of blood (interquartile range,
0 to 3) and the higher-threshold group received a median of 4 units (interquartile
range, 2 to 7). At 90 days after randomization, 216 of 502 patients (43.0%) assigned
to the lower-threshold group, as compared with 223 of 496 (45.0%) assigned to the
higher-threshold group, had died (relative risk, 0.94; 95% confidence interval, 0.78
to 1.09; P = 0.44). The results were similar in analyses adjusted for risk factors at
baseline and in analyses of the per-protocol populations. The numbers of patients
who had ischemic events, who had severe adverse reactions, and who required life
support were similar in the two intervention groups.
CONCLUSIONS
Among patients with septic shock, mortality at 90 days and rates of ischemic events
and use of life support were similar among those assigned to blood transfusion at a
higher hemoglobin threshold and those assigned to blood transfusion at a lower
threshold; the latter group received fewer transfusions. (Funded by the Danish
Stra-tegic Research Council and others; TRISS ClinicalTrials.gov number, NCT01485315.)
The New England Journal of Medicine
Downloaded from nejm.org at THE JIKEI UNIVERSITY SCHOOL OF MEDICINE on October 1, 2014. For personal use only. No other uses without permission.
Copyright © 2014 Massachusetts Medical Society. All rights reserved.
もくじ
• これまでの流れと背景
•
Introduc1on
•
Methods
•
Results
•
Discussion
•
Editorial
• まとめ
• 批判的吟味
これまでの流れと背景
•
15年前、カナダの研究グループが『TRICC』と
いうトライアルを発表。
Hb<7g/dlで輸血を開始すべきという基盤を
作った。(
7g/dl vs 10g/dlで比較)
30日以内の生存率
カプラン・マイヤー曲線
p=0.10
7g/dl 10g/dl
30日
死亡率 18.7
%
23.3% P=0.10
414
·
Febr uar y 11, 1999
The New England Journal of Medicine
gan-failure scores of 7 were assigned to all patients
who died within 30 days after admission to the
in-tensive care unit, the number of patients with
mul-tiorgan failure was substantially increased in both
groups, and the results were marginally better in the
restrictive-strategy group (20.6 percent vs. 26.0
per-cent, P=0.07). Similarly, when all patients who died
were given a multiple-organ-dysfunction score of
24, the total scores (P=0.03) and the changes in the
scores from base line (P=0.04) were significantly
lower in the restrictive-strategy group (Table 2).
Cardiac events, primarily pulmonary edema and
myocardial infarction, were more frequent in the
lib-eral-strategy group than in the restrictive-strategy
group during the stay in the intensive care unit
(P<0.01) (Table 3). However, there were no
signifi-cant differences in the rates of cardiac events (41
per-cent in the restrictive-strategy group and 44 perper-cent
in the liberal-strategy group, P=0.86), infectious
complications (3 percent and 4 percent, respectively;
P=1.00), or multiorgan failure (37 percent and 32
percent, respectively; P=0.59) in the 48 hours
pre-ceding death among the patients who died (Table 4).
Subgroup Analyses
When the patients were analyzed according to age
(<55 years vs. »55 years) and APACHE II score
(«20 vs. >20), there were no significant differences
in base-line characteristics. In the restrictive-strategy
group, 173 patients were younger than 55 years, 207
patients had an APACHE II score of 20 or less, 151
patients had cardiac disease, 100 had a traumatic
in-jury, and 114 had a severe infection or septic shock.
In the liberal-strategy group, 161 patients were
younger than 55 years, 217 had an APACHE II
score of 20 or less, 175 had cardiac disease, 100 had
a traumatic injury, and 104 had a severe infection or
septic shock. All outcomes in the two
transfusion-strategy groups were similar for the patients who
were older than 55 years and for those with an
APACHE II score of more than 20 (P>0.36).
How-ever, 30-day mortality was significantly lower in the
restrictive-strategy group than in the liberal-strategy
group among the patients with an APACHE II score
of 20 or less (8.7 percent vs. 16.1 percent; 95
per-cent confidence interval for the absolute difference,
1.0 to 13.6 percent; P=0.03) and among the
pa-tients who were less than 55 years of age (5.7
per-cent vs. 13.0 perper-cent; 95 perper-cent confidence interval,
1.1 to 13.5 percent; P=0.02). There were no
signif-icant differences in 30-day mortality between
treat-ment groups in the subgroup of patients with a
pri-mary or secondary diagnosis of cardiac disease (20.5
percent in the restrictive-strategy group and 22.9
percent in the liberal-strategy group; 95 percent
confidence interval for the difference, ¡6.7 to 11.3
percent; P=0.69), in the subgroup of patients with
severe infections and septic shock (22.8 percent and
Figure 2. Kaplan–Meier Estimates of Survival in the 30 Days
af-ter Admission to the Intensive Care Unit in the
Restrictive-Strat-egy and Liberal-StratRestrictive-Strat-egy Groups.
Panel A shows the survival curves for all patients in the study
groups. Panel B shows the survival curves in the subgroup of
patients with an APACHE II score of 20 or less. Panel C shows
the survival curves in the subgroup of patients who were
younger than 55 years.
50
100
0
Patients Younger than 55 Years
30
60
70
80
90
5
10
15
20
25
Days
Liberal-!
transfusion!
strategy
P=0.02
Restrictive-!
transfusion!
strategy
Survival (%)
50
100
0
Patients with APACHE II Score «20
30
60
70
80
90
5
10
15
20
25
Days
Liberal-!
transfusion!
strategy
P=0.02
Restrictive-!
transfusion!
strategy
Survival (%)
50
100
0
All Patients
30
60
70
80
90
5
10
15
20
25
Days
Liberal-!
transfusion!
strategy
P=0.10
Restrictive-!
transfusion!
strategy
Survival (%)
A
C
B
The New England Journal of Medicine
Downloaded from nejm.org on November 3, 2014. For personal use only. No other uses without permission. Copyright © 1999 Massachusetts Medical Society. All rights reserved.
10g/dl
7g/dl
Hébert PC, et al. A mulHcenter, randomized, controlled clinical trial of
transfusion requirements in criHcal care. N Engl J Med
1999
; 340:409-‐17.
これまでの流れと背景
• 敗血症患者でも、
Hbが低下し赤血球輸血が
必要となる場面が多い。
しかし
Hb濃度がいくつになったら輸血を開始
するのが良いか、という「しきい値」は未だに
定められていない。
Introduc1on
•
2012年“Surviving Sepsis Campaign”では、、、
• としているが、根拠は少なく、臨床医はこれに
従わずに輸血を行っていることが多い。
治療を開始し、最初の
6時間はHt>30%を保つこと。
その後は
Hbが7g/dlを下回らないように輸血を行い、
Introduc1on
•
2014年に発表されたProCESSという論文でも、
高い
Hbを目標として輸血することへ疑問を投
Protocol-based Care for Early Septic Shock
n engl j med 370;18 nejm.org may 1, 2014
1691
pendix). Similarly, in a post hoc analysis, there
was no evidence of a treatment effect within
ranges of values for the APACHE II score, serum
lactate level, or time from meeting the criteria
for shock to randomization (Table S7 in the
Sup-plementary Appendix).
Discussion
In our study, adherence to the two experimental
protocols was high, and, as expected,
protocol-based care, as compared with usual care,
result-ed in increasresult-ed use of central venous
catheteriza-tion, intravenous fluids, vasoactive agents, and
blood transfusions. The two protocol-based
re-suscitation approaches led to a small but
tran-sient improvement in blood pressure by the end
of the resuscitation period but a higher
require-ment for intensive care and renal-replacerequire-ment
therapy. There were no significant differences in
mortality, either overall or in a number of
pre-specified and post hoc subgroups.
Our results differ from those of Rivers et al.
4;
however, our study was not a direct replication
of that study, and there are probably several
fac-tors that contribute to the differences. Although
the two trials used similar inclusion criteria, the
enrolled populations differed. The study cohorts
were similar with respect to many demographic
and clinical characteristics, including the
sever-ity of illness (Table S8 in the Supplementary
Appendix), but the cohort in the study by Rivers
et al. was slightly older, had higher rates of
pre-existing heart and liver disease, and had a higher
initial serum lactate level. Although we modified
the minimum fluid bolus required to establish
the presence of refractory hypotension, the mean
volume of the bolus that was administered fell
within the range used in the study by Rivers et
al. (20 to 30 ml per kilogram). The mean initial
Scvo
2reported by Rivers et al. was 49%, which
was lower than that in the ProCESS trial.
How-ever, early central venous catheterization was
considered to be part of usual care in that trial,
allowing Scvo
2readings to be made before
ad-ministration of the initial fluid bolus, the
sponse to which was required to establish
re-fractory hypotension. In contrast, for patients
randomly assigned to the protocol-based EGDT
group in our study, we measured Scvo
2only after
the initial fluid bolus had been administered,
making a direct comparison problematic.
None-theless, the cohort in the study by Rivers et al.
may have had, on average, more severe or
persis-tent shock than the patients in our cohort.
How-ever, we were unable to show a benefit even
when we restricted the analyses to the sickest
third of our patients — those with the highest
serum lactate levels and those with the highest
APACHE II scores.
Both trials used the same EGDT protocol
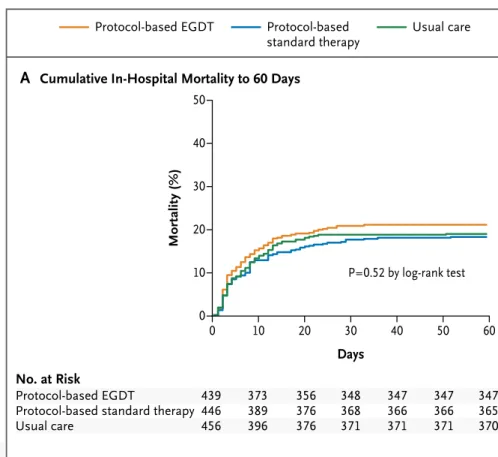
Protocol-based EGDT Protocol-basedstandard therapy Usual care
90 days Mortality (%) 50 40 30 10 20 0 0 10 20 30 40 50 60 Days
B
Cumulative Mortality to 1 YrA
Cumulative In-Hospital Mortality to 60 DaysP=0.52 by log-rank test
No. at Risk
Protocol-based EGDT
Protocol-based standard therapy Usual care 439 446 456 373 389 396 356 376 376 348 368 371 347 366 371 347 366 371 347 365 370 Mortality (%) 50 40 30 10 20 0 0 60 120 180 240 300 365 Days
P=0.70 by log-rank test, 90 days P=0.92 by log-rank test, 1 yr
No. at Risk
Protocol-based EGDT
Protocol-based standard therapy Usual care 439 446 456 289 308 285 217 212 211 194 196 199 175 179 181 156 158 164 145 142 139
Figure 2.
Cumulative Mortality.
Panel A shows cumulative in-hospital mortality, truncated at 60 days, and
Panel B cumulative mortality up to 1 year after randomization.
The New England Journal of Medicine
Downloaded from nejm.org on November 3, 2014. For personal use only. No other uses without permission.
Copyright © 2014 Massachusetts Medical Society. All rights reserved.
Introduc1on
The ProCESS InvesHgators. A randomized trial of protocol-‐based care for early sepHc shock.
N Engl J Med 2014;370:1683-‐ 93.
Protocol-‐based EGDT群 vs. protocol-‐based standard therapy群 vs. usual care群で
60日死亡率を比較
ProCESS$RCT$
11$
Figure,S6.,Processes,of,care,during,the,6h,resuscitation,intervention.,
$
Panel$A$–$time$(minutes)$until$a$central$venous$catheter$is$placed.$Panel$B$–$time$(minutes)$until$a$central$venous$catheter$for$oximetric$
monitoring$is$placed.$Central$venous$catheterization$defined$as$use$of$oximetric$catheter$or$multiple$serial$ScvO
2$measures.$Panel$C$–$$
Intravenous$fluid$volume$by$hour$(mean$+$SD).$Panel$D$–$use$of$resuscitation$interventions.$ScvO
2$–$central$venous$oxygen$saturation;$PRBC$–$
packed$red$blood$cell;$EGDT$–$early$goalHdirected$therapy..$
PPvalues$represent$comparisons$across$the$3$arms.$
&
,
$
,
ProCESS$RCT$
11$
Figure,S6.,Processes,of,care,during,the,6h,resuscitation,intervention.,
$
Panel$A$–$time$(minutes)$until$a$central$venous$catheter$is$placed.$Panel$B$–$time$(minutes)$until$a$central$venous$catheter$for$oximetric$ monitoring$is$placed.$Central$venous$catheterization$defined$as$use$of$oximetric$catheter$or$multiple$serial$ScvO2$measures.$Panel$C$–$$ Intravenous$fluid$volume$by$hour$(mean$+$SD).$Panel$D$–$use$of$resuscitation$interventions.$ScvO2$–$central$venous$oxygen$saturation;$PRBC$–$ packed$red$blood$cell;$EGDT$–$early$goalHdirected$therapy..$ PPvalues$represent$comparisons$across$the$3$arms.$ & ,$
,
輸血
→死亡率に有意な差は認められなかった。
ProCESS
T h e
ne w e ngl a nd jou r na l
o f
m e dicine
n engl j med nejm.org
1
original article
Lower versus Higher Hemoglobin Threshold
for Transfusion in Septic Shock
Lars B. Holst, M.D., Nicolai Haase, M.D., Ph.D., Jørn Wetterslev, M.D., Ph.D.,
Jan Wernerman, M.D., Ph.D., Anne B. Guttormsen, M.D., Ph.D.,
Sari Karlsson, M.D., Ph.D., Pär I. Johansson, M.D., Ph.D.,
Anders Åneman, M.D., Ph.D., Marianne L. Vang, M.D., Robert Winding, M.D.,
Lars Nebrich, M.D., Helle L. Nibro, M.D., Ph.D., Bodil S. Rasmussen, M.D., Ph.D.,
Johnny R.M. Lauridsen, M.D., Jane S. Nielsen, M.D., Anders Oldner, M.D., Ph.D.,
Ville Pettilä, M.D., Ph.D., Maria B. Cronhjort, M.D., Lasse H. Andersen, M.D.,
Ulf G. Pedersen M.D., Nanna Reiter, M.D., Jørgen Wiis, M.D.,
Jonathan O. White, M.D., Lene Russell, M.D., Klaus J. Thornberg, M.D.,
Peter B. Hjortrup, M.D., Rasmus G. Müller, M.D., Morten H. Møller, M.D., Ph.D.,
Morten Steensen, M.D., Inga Tjäder, M.D., Ph.D., Kristina Kilsand, R.N.,
Suzanne Odeberg-Wernerman, M.D., Ph.D., Brit Sjøbø, R.N.,
Helle Bundgaard, M.D., Ph.D., Maria A. Thyø, M.D., David Lodahl, M.D.,
Rikke Mærkedahl, M.D., Carsten Albeck, M.D., Dorte Illum, M.D., Mary Kruse, M.D.,
Per Winkel, M.D., D.M.Sci., and Anders Perner, M.D., Ph.D.,
for the TRISS Trial Group* and the Scandinavian Critical Care Trials Group
From the Department of Intensive Care
(L.B.H., N.H., L.H.A., U.G.P., N.R., J. Wiis,
J.O.W., L.R., K.J.T., P.B.H., R.G.M., M.H.M.,
M.S., A.P.), Copenhagen Trial Unit, Center
for Clinical Intervention Research (J.
Wet-terslev, P.W.), and Section for
Transfu-sion Medicine (P.I.J.), Rigshospitalet and
University of Copenhagen, Copenhagen,
Randers Hospital, Randers (M.L.V., H.B.,
M.A.T.), Herning Hospital, Herning (R.W.,
D.L., R.M.), Hvidovre Hospital, Hvidovre
(L.N., C.A.), Aarhus University Hospital,
Aarhus (H.L.N., D.I.), Aalborg University
Hospital, Aalborg (B.S.R.), Holbæk
Hospi-tal, Holbæk (J.R.M.L.), Kolding HospiHospi-tal,
Kolding (J.S.N.), and Hjørring Hospital,
Hjørring (M.K.) — all in Denmark;
Karo-linska University Hospital, Huddinge,
Stock-holm (J. Wernerman, I.T., K.K., S.O.-W.),
Karolinska University Hospital, Solna (A.O.),
and Södersjukhuset, Stockholm (M.B.C.)
— all in Sweden; Haukeland University
Hospital and University of Bergen, Bergen,
Norway (A.B.G., B.S.); Tampere
Univer-sity Hospital, Tampere (S.K.), and
Hel-sinki University Hospital and University of
Helsinki, Helsinki (V.P.) — all in Finland;
and Liverpool Hospital, Sydney (A.Å.).
Address reprint requests to Dr. Perner at
the Department of Intensive Care,
Rigshos-pitalet, Blegdamsvej 9, DK-2100
Copen-hagen, Denmark, or at anders.perner@
regionh.dk.
* Members of the Transfusion
Require-ments in Septic Shock (TRISS) Trial
Group are listed in the Supplementary
Appendix, available at NEJM.org.
This article was published on October 1,
2014, at NEJM.org.
DOI: 10.1056/NEJMoa1406617
Copyright © 2014 Massachusetts Medical Society.
ABS TR ACT
BACKGROUND
Blood transfusions are frequently given to patients with septic shock. However, the
benefits and harms of different hemoglobin thresholds for transfusion have not
been established.
METHODS
In this multicenter, parallel-group trial, we randomly assigned patients in the
inten-sive care unit (ICU) who had septic shock and a hemoglobin concentration of 9 g
per deciliter or less to receive 1 unit of leukoreduced red cells when the hemoglobin
level was 7 g per deciliter or less (lower threshold) or when the level was 9 g per
deciliter or less (higher threshold) during the ICU stay. The primary outcome
mea-sure was death by 90 days after randomization.
RESULTS
We analyzed data from 998 of 1005 patients (99.3%) who underwent
randomiza-tion. The two intervention groups had similar baseline characteristics. In the ICU,
the lower-threshold group received a median of 1 unit of blood (interquartile range,
0 to 3) and the higher-threshold group received a median of 4 units (interquartile
range, 2 to 7). At 90 days after randomization, 216 of 502 patients (43.0%) assigned
to the lower-threshold group, as compared with 223 of 496 (45.0%) assigned to the
higher-threshold group, had died (relative risk, 0.94; 95% confidence interval, 0.78
to 1.09; P = 0.44). The results were similar in analyses adjusted for risk factors at
baseline and in analyses of the per-protocol populations. The numbers of patients
who had ischemic events, who had severe adverse reactions, and who required life
support were similar in the two intervention groups.
CONCLUSIONS
Among patients with septic shock, mortality at 90 days and rates of ischemic events
and use of life support were similar among those assigned to blood transfusion at a
higher hemoglobin threshold and those assigned to blood transfusion at a lower
threshold; the latter group received fewer transfusions. (Funded by the Danish
Stra-tegic Research Council and others; TRISS ClinicalTrials.gov number, NCT01485315.)
The New England Journal of Medicine
Downloaded from nejm.org at THE JIKEI UNIVERSITY SCHOOL OF MEDICINE on October 1, 2014. For personal use only. No other uses without permission.
Copyright © 2014 Massachusetts Medical Society. All rights reserved.
Introduc1on
今までの研究では、輸血が死亡率を上昇させ
るという報告がある。
一方で、死亡率を改善させるという研究もある。
今回、敗血症性ショックで
ICU入室した患者に対し、
輸血を低閾値で行う群
vs. 高閾値で行う群
で比較を行った。
Methods
• 患者:デンマーク、スウェーデン、ノルウェー、フィンランド
の
32のICUから集められた。
• デザイン:他施設並行群間試験
• 期間:2011年12月〜2013年12月
• ランダム化:コンピュータを使ってランダム化
• 盲検化:部分盲検化
• 対象:18歳以上の敗血症性ショックの診断基準を満たす
ICU入室患者、Hb<9g/dlの者。
Methods
• 介入:
18歳以上の敗血症性ショックの診断基準
を満たす
ICU入室患者に対し、
低閾値群
高閾値群
Hb<7g/dlで輸血を行う
Hb<9g/dlで輸血を行う
•
Hb濃度は輸血が1単位終わったところ
、
または新たな輸血が始まるところで
測定する
。
• 介入は
ICUにいる間ずっと行う(ただし最大90日まで)
。
• 致死的な出血や虚血を起こした場合
、
ECMOを使用しなければいけない場合
には医師の判断で自由に輸血を行える
。
• 「
ICUでの輸血」以外のすべての介入を
、
医師の判断で行える
。
Methods
Primary endpoint
1.90日以内の死亡率
Secondary endpoint
1.昇圧剤の使用、人工呼吸器の使用、腎代替療法の有無。
*それぞれ
5日目
、
14日目
、
28日目に判定
2.重篤な副作用の出現数
3.虚血性イベントの発生数
*
AMI
、
腸管虚血
、
脳虚血
、
肢虚血
4.昇圧剤、人工呼吸器、腎代替療法を行わなかった比率
Methods
•
2つの先行研究*から高閾値群の死亡率45%とした。
TRICCの結果に基づき、低閾値群の90日死亡率の方
が
9%低いと予測し、検出力80%、有意水準5%で計算
した。
⇛
1000人の患者が集められた。
*
①Carlsen S, Perner A, East Danish Sep1c Shock Cohort Inves1gators. Acta Anaesthesiol Scand 2011;55:394-‐400.
②Smith SH, Perner A. Higher vs. lower fluid volume for sep1c shock. Crit Care 2012;16:R76.
Methods
•
Primary outcome:ITTで解析。ロジスティック
回帰分析で
2群の平均を比較。
•
2群の比較にカイ二乗検定、比率・順序に関し
てウィルコクソン符号順位検定を行った。
(
Primary outcomeに関してはPer-‐protocolでも検討して
その結果を
ITTと比較した。)
Results
Hemoglobin Threshold for Transfusion in Septic Shock
n engl j med nejm.org
3
solution when the blood concentration of
hemo-globin had decreased to the assigned transfusion
threshold (≤7 g per deciliter [lower threshold] or
≤9 g per deciliter [higher threshold]). These
lev-els of hemoglobin have frequently been used as
thresholds for transfusion in patients with septic
shock.
15Hemoglobin concentrations were
reas-sessed within 3 hours after termination of the
transfusion or before the initiation of another
transfusion. The intervention period was the
en-tire ICU stay, to a maximum of 90 days after
ran-domization.
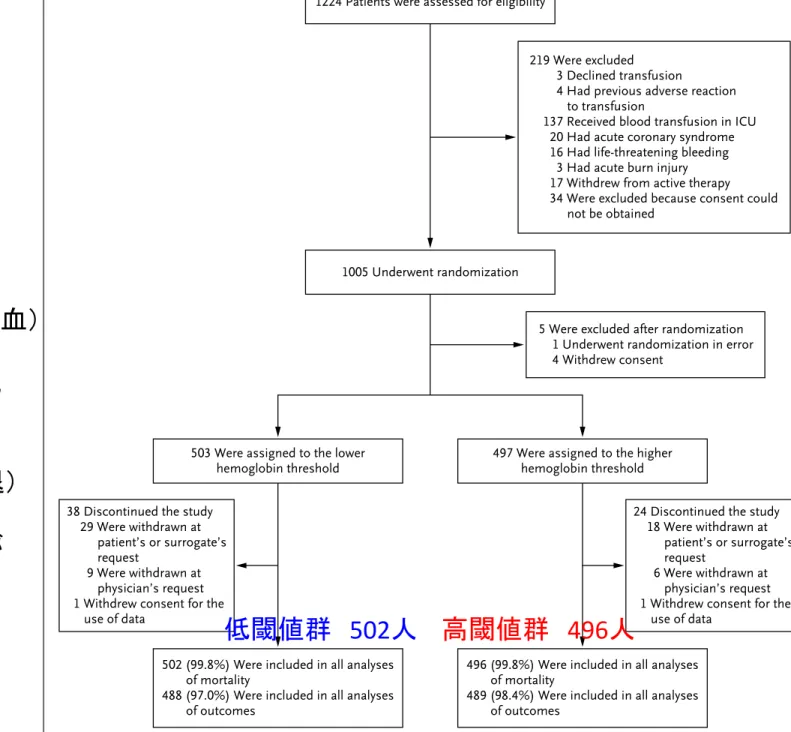
1005 Underwent randomization
5 Were excluded after randomization 1 Underwent randomization in error 4 Withdrew consent
1224 Patients were assessed for eligibility
219 Were excluded 3 Declined transfusion
4 Had previous adverse reaction to transfusion
137 Received blood transfusion in ICU 20 Had acute coronary syndrome 16 Had life-threatening bleeding
3 Had acute burn injury 17 Withdrew from active therapy 34 Were excluded because consent could
not be obtained
503 Were assigned to the lower
hemoglobin threshold 497 Were assigned to the higherhemoglobin threshold 38 Discontinued the study
29 Were withdrawn at patient’s or surrogate’s request
9 Were withdrawn at physician’s request 1 Withdrew consent for the
use of data
24 Discontinued the study 18 Were withdrawn at
patient’s or surrogate’s request
6 Were withdrawn at physician’s request 1 Withdrew consent for the
use of data 502 (99.8%) Were included in all analyses
of mortality
488 (97.0%) Were included in all analyses of outcomes
496 (99.8%) Were included in all analyses of mortality
489 (98.4%) Were included in all analyses of outcomes
Figure 1.
Assessment, Randomization, and Follow-up.
Patients were excluded if they had undergone randomization in this study previously, if there were medical reasons,
if they had received a blood transfusion during the current intensive care unit (ICU) admission, if there was a
docu-mented wish not to receive a transfusion, or if informed consent could not be obtained. A total of 15 patients met
two exclusion criteria. One patient was excluded immediately after randomization when it was determined that an
inclusion criterion had not been met, and 4 were excluded because consent was withdrawn during the trial. Thereafter,
5 additional patients underwent randomization in order for the study to obtain the full sample. All the patients who
with-drew from the trial at their own request or at a surrogate’s request allowed the use of their data, but 14 patients or
surrogates in the lower-threshold group (hemoglobin level, ≤7 g per deciliter) and 7 in the higher-threshold group
(hemoglobin level, ≤9 g per deciliter) did not want further data registered except for mortality data, which were obtained
from national registries. The process data (hemoglobin assessments and numbers of transfusions and temporary
protocol suspensions and protocol violations) and some of the secondary-outcome data for these patients are missing.
The New England Journal of Medicine
Downloaded from nejm.org at THE JIKEI UNIVERSITY SCHOOL OF MEDICINE on October 1, 2014. For personal use only. No other uses without permission.
Copyright © 2014 Massachusetts Medical Society. All rights reserved.
患者振り分け
低閾値群
502
人
高閾値群
496人
1224人が適合
↓
219人が除外
(輸血拒否、
ランダム化の前に輸血)
↓
1005人がランダム化
↓
5人が除外
(エラー、同意を辞退)
↓
同様に
38人、24人が
研究から外れた
最終的に
502人 vs. 496人
Results
Character Baseline
T h e ne w engl a nd jou r na l o f m edicine
n engl j med nejm.org
6
tic shock who were in the ICU, we observed no
significant differences in mortality at 90 days, in
the numbers of patients with ischemic events or
with severe adverse reactions, in the use of life
support, or in the numbers of days alive and out
of the hospital between the group of patients
who underwent transfusion at a lower
hemoglo-bin threshold and the group of those who
under-went transfusion at a higher hemoglobin
thresh-old. Similar results were observed in subgroups
of patients with chronic cardiovascular disease,
with older age, or with greater disease severity.
The patients in the lower-threshold group
re-ceived 50% fewer units of blood than those in the
higher-threshold group, and 36% of the patients
in the lower-threshold group did not undergo
transfusion in the ICU, as compared with 1% of
the patients in the higher-threshold group.
Our results are consistent with those
ob-tained in the TRICC trial, which assessed a
lower versus higher hemoglobin threshold for
blood transfusion in a broad population of adult
patients in the ICU.
9In that trial, there were no
significant differences in mortality at 30 days in
the full trial population (the primary outcome)
or among patients 55 years of age or older or
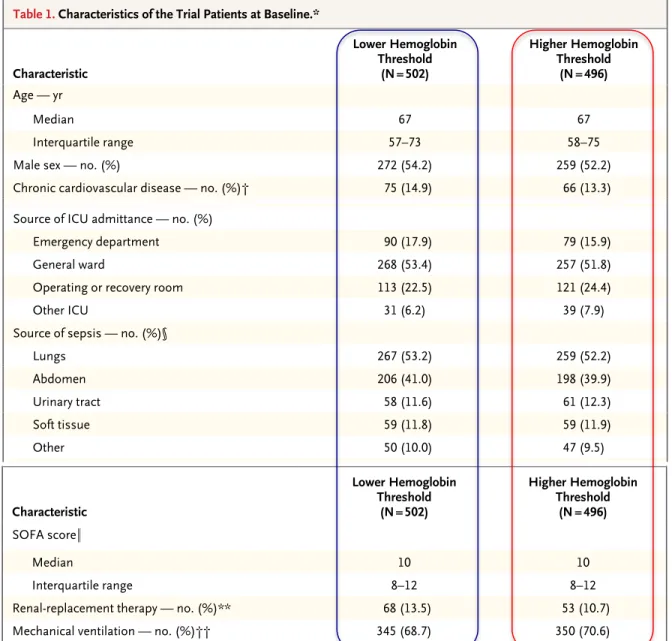
Table 1. Characteristics of the Trial Patients at Baseline.*
Characteristic Lower Hemoglobin Threshold (N = 502) Higher Hemoglobin Threshold (N = 496) Age — yr Median 67 67 Interquartile range 57–73 58–75
Male sex — no. (%) 272 (54.2) 259 (52.2)
Chronic cardiovascular disease — no. (%)† 75 (14.9) 66 (13.3)
Chronic lung disease — no. (%)‡ 111 (22.1) 102 (20.6)
Hematologic cancer — no. (%) 39 (7.8) 36 (7.3)
Admission to a university hospital — no. (%) 323 (64.3) 324 (65.3) Surgery during index hospitalization — no. (%)
Emergency 191 (38.0) 217 (43.8)
Elective 59 (11.8) 53 (10.7)
Source of ICU admittance — no. (%)
Emergency department 90 (17.9) 79 (15.9)
General ward 268 (53.4) 257 (51.8)
Operating or recovery room 113 (22.5) 121 (24.4)
Other ICU 31 (6.2) 39 (7.9)
Source of sepsis — no. (%)§
Lungs 267 (53.2) 259 (52.2)
Abdomen 206 (41.0) 198 (39.9)
Urinary tract 58 (11.6) 61 (12.3)
Soft tissue 59 (11.8) 59 (11.9)
Other 50 (10.0) 47 (9.5)
Positive culture from blood or sterile site 188 (37.5) 160 (32.3) Interval from ICU admission to randomization — hr
Median 23 20
Interquartile range 7–50 7–43
SAPS II¶
Median 51 52
Interquartile range 42–62 44–64
The New England Journal of Medicine
Downloaded from nejm.org at THE JIKEI UNIVERSITY SCHOOL OF MEDICINE on October 1, 2014. For personal use only. No other uses without permission. Copyright © 2014 Massachusetts Medical Society. All rights reserved.
Hemoglobin Threshold for Transfusion in Septic Shock
n engl j med nejm.org
7
Table 1. (Continued.) Characteristic Lower Hemoglobin Threshold (N = 502) Higher Hemoglobin Threshold (N = 496) SOFA score∥ Median 10 10 Interquartile range 8–12 8–12
Renal-replacement therapy — no. (%)** 68 (13.5) 53 (10.7)
Mechanical ventilation — no. (%)†† 345 (68.7) 350 (70.6)
* None of the differences between the two groups were significant (P≥0.05). Additional details regarding baseline char-acteristics are provided in Table S1 in the Supplementary Appendix. The lower hemoglobin threshold was defined as a hemoglobin level of 7 g per deciliter or less, and the higher hemoglobin threshold as a hemoglobin level of 9 g per deciliter or less. ICU denotes intensive care unit.
† Patients were considered to have chronic cardiovascular disease if they had any history of myocardial infarction, sta-ble or unstasta-ble angina pectoris, chronic heart failure (defined as New York Heart Association class III or IV), cerebral infarction or transitory cerebral ischemia, previous treatment with nitrates, percutaneous coronary intervention, coro-nary-artery bypass grafting, or noncoronary vascular interventions.
‡ Patients were considered to have chronic lung disease if they had any history of chronic obstructive pulmonary dis-ease, asthma or other chronic lung disdis-ease, or any treatment with a drug indicated for chronic lung disease. § Some patients had more than one source of infection. Other sources of sepsis included a vascular catheter,
meningi-tis, or endocarditis or were unclear.
¶ The Simplified Acute Physiology Score (SAPS) II25 was assessed in the 24 hours before randomization. The SAPS II is
calculated from 17 variables and ranges from 0 to 163, with higher scores indicating higher severity of disease. One or two of the 17 variables were missing for 77 patients in the higher-threshold group and for 99 in the lower-threshold group, so their values were not included here.
∥ The Sepsis-Related Organ Failure Assessment (SOFA)26 score was assessed in the 24 hours before randomization.
The SOFA grades organ failure, with subscores ranging from 0 to 4 for each of six organ systems (cerebral, circula-tion, pulmonary, hepatic, renal, and coagulation). The aggregated score ranges from 0 to 24, with higher scores indi-cating more severe organ failure. One variable was missing for 51 patients in the higher-threshold group and for 64 in the lower-threshold group, so their values were not included here.
** Renal-replacement therapy was defined as therapy for acute or chronic kidney failure at randomization. †† Mechanical ventilation was defined as invasive or noninvasive ventilation in the 24 hours before randomization.
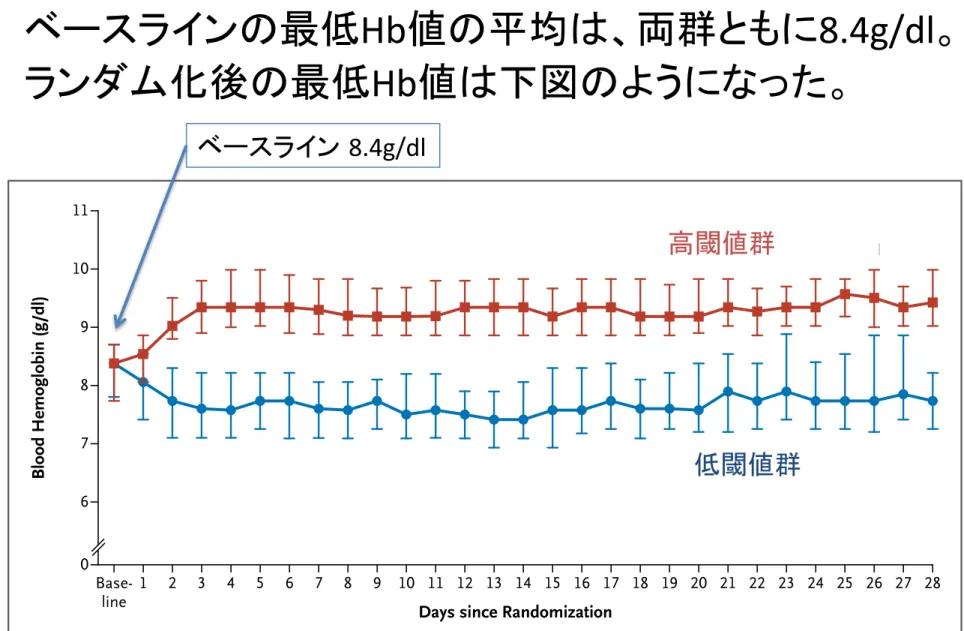
Blood Hemoglobin (g/dl) 11 9 10 8 7 6 0 Base-line 1 2 3 4 5 6 7 8 9 10 11 12 13 14 15 16 17 18 19 20 21 22 23 24 25 26 27 28
Days since Randomization
Lower hemoglobin threshold Higher hemoglobin threshold
Figure 2. Blood Hemoglobin Levels in Patients in the ICU at Baseline and after Randomization.
The graphs show the median daily lowest levels of blood hemoglobin in the lower-threshold group and the higher-threshold group. Baseline values were the lowest blood hemoglobin level measured in the 24 hours before random-ization. Day 1 was defined as the time of randomization to the end of that day and lasted a median of 15 hours in the lower-threshold group and 14 hours in the higher-threshold group. The I bars indicate the 25th and 75th percentiles.
The New England Journal of Medicine
Downloaded from nejm.org at THE JIKEI UNIVERSITY SCHOOL OF MEDICINE on October 1, 2014. For personal use only. No other uses without permission. Copyright © 2014 Massachusetts Medical Society. All rights reserved.
T h e ne w engl a nd jou r na l o f m edicine
n engl j med nejm.org
6
tic shock who were in the ICU, we observed no
significant differences in mortality at 90 days, in
the numbers of patients with ischemic events or
with severe adverse reactions, in the use of life
support, or in the numbers of days alive and out
of the hospital between the group of patients
who underwent transfusion at a lower
hemoglo-bin threshold and the group of those who
under-went transfusion at a higher hemoglobin
thresh-old. Similar results were observed in subgroups
of patients with chronic cardiovascular disease,
with older age, or with greater disease severity.
The patients in the lower-threshold group
re-ceived 50% fewer units of blood than those in the
higher-threshold group, and 36% of the patients
in the lower-threshold group did not undergo
transfusion in the ICU, as compared with 1% of
the patients in the higher-threshold group.
Our results are consistent with those
ob-tained in the TRICC trial, which assessed a
lower versus higher hemoglobin threshold for
blood transfusion in a broad population of adult
patients in the ICU.
9In that trial, there were no
significant differences in mortality at 30 days in
the full trial population (the primary outcome)
or among patients 55 years of age or older or
Table 1. Characteristics of the Trial Patients at Baseline.*
Characteristic Lower Hemoglobin Threshold (N = 502) Higher Hemoglobin Threshold (N = 496) Age — yr Median 67 67 Interquartile range 57–73 58–75
Male sex — no. (%) 272 (54.2) 259 (52.2)
Chronic cardiovascular disease — no. (%)† 75 (14.9) 66 (13.3)
Chronic lung disease — no. (%)‡ 111 (22.1) 102 (20.6)
Hematologic cancer — no. (%) 39 (7.8) 36 (7.3)
Admission to a university hospital — no. (%) 323 (64.3) 324 (65.3) Surgery during index hospitalization — no. (%)
Emergency 191 (38.0) 217 (43.8)
Elective 59 (11.8) 53 (10.7)
Source of ICU admittance — no. (%)
Emergency department 90 (17.9) 79 (15.9)
General ward 268 (53.4) 257 (51.8)
Operating or recovery room 113 (22.5) 121 (24.4)
Other ICU 31 (6.2) 39 (7.9)
Source of sepsis — no. (%)§
Lungs 267 (53.2) 259 (52.2)
Abdomen 206 (41.0) 198 (39.9)
Urinary tract 58 (11.6) 61 (12.3)
Soft tissue 59 (11.8) 59 (11.9)
Other 50 (10.0) 47 (9.5)
Positive culture from blood or sterile site 188 (37.5) 160 (32.3) Interval from ICU admission to randomization — hr
Median 23 20
Interquartile range 7–50 7–43
SAPS II¶
Median 51 52
Interquartile range 42–62 44–64
The New England Journal of Medicine
Downloaded from nejm.org at THE JIKEI UNIVERSITY SCHOOL OF MEDICINE on October 1, 2014. For personal use only. No other uses without permission. Copyright © 2014 Massachusetts Medical Society. All rights reserved.
Results
Hemoglobin Threshold for Transfusion in Septic Shock
n engl j med nejm.org
7
Table 1.
(Continued.)
Characteristic
Lower Hemoglobin
Threshold
(N = 502)
Higher Hemoglobin
Threshold
(N
= 496)
SOFA score∥
Median
10
10
Interquartile range
8–12
8–12
Renal-replacement therapy — no. (%)**
68 (13.5)
53 (10.7)
Mechanical ventilation — no. (%)††
345 (68.7)
350 (70.6)
* None of the differences between the two groups were significant (P≥0.05). Additional details regarding baseline
char-acteristics are provided in Table S1 in the Supplementary Appendix. The lower hemoglobin threshold was defined as
a hemoglobin level of 7 g per deciliter or less, and the higher hemoglobin threshold as a hemoglobin level of 9 g per
deciliter or less. ICU denotes intensive care unit.
† Patients were considered to have chronic cardiovascular disease if they had any history of myocardial infarction,
sta-ble or unstasta-ble angina pectoris, chronic heart failure (defined as New York Heart Association class III or IV), cerebral
infarction or transitory cerebral ischemia, previous treatment with nitrates, percutaneous coronary intervention,
coro-nary-artery bypass grafting, or noncoronary vascular interventions.
‡ Patients were considered to have chronic lung disease if they had any history of chronic obstructive pulmonary
dis-ease, asthma or other chronic lung disdis-ease, or any treatment with a drug indicated for chronic lung disease.
§ Some patients had more than one source of infection. Other sources of sepsis included a vascular catheter,
meningi-tis, or endocarditis or were unclear.
¶ The Simplified Acute Physiology Score (SAPS) II
25was assessed in the 24 hours before randomization. The SAPS II is
calculated from 17 variables and ranges from 0 to 163, with higher scores indicating higher severity of disease. One
or two of the 17 variables were missing for 77 patients in the higher-threshold group and for 99 in the lower-threshold
group, so their values were not included here.
∥ The Sepsis-Related Organ Failure Assessment (SOFA)
26score was assessed in the 24 hours before randomization.
The SOFA grades organ failure, with subscores ranging from 0 to 4 for each of six organ systems (cerebral,
circula-tion, pulmonary, hepatic, renal, and coagulation). The aggregated score ranges from 0 to 24, with higher scores
indi-cating more severe organ failure. One variable was missing for 51 patients in the higher-threshold group and for 64 in
the lower-threshold group, so their values were not included here.
** Renal-replacement therapy was defined as therapy for acute or chronic kidney failure at randomization.
†† Mechanical ventilation was defined as invasive or noninvasive ventilation in the 24 hours before randomization.
Blood
Hemoglobin
(g/dl)
11
9
10
8
7
6
0
Base-line
1
2
3
4
5
6
7
8
9
10
11
12
13
14
15
16
17
18
19
20
21
22
23
24
25
26
27
28
Days since Randomization
Lower hemoglobin threshold
Higher hemoglobin threshold
Figure 2.
Blood Hemoglobin Levels in Patients in the ICU at Baseline and after Randomization.
The graphs show the median daily lowest levels of blood hemoglobin in the lower-threshold group and the
higher-threshold group. Baseline values were the lowest blood hemoglobin level measured in the 24 hours before
random-ization. Day 1 was defined as the time of randomization to the end of that day and lasted a median of 15 hours in
the lower-threshold group and 14 hours in the higher-threshold group. The
I bars indicate the 25th and 75th percentiles.
The New England Journal of Medicine
Downloaded from nejm.org at THE JIKEI UNIVERSITY SCHOOL OF MEDICINE on October 1, 2014. For personal use only. No other uses without permission.
Copyright © 2014 Massachusetts Medical Society. All rights reserved.
• ベースラインの最低Hb値の平均は、両群ともに8.4g/dl。
• ランダム化後の最低
Hb値は下図のようになった。
ベースライン
8.4g/dl
低閾値群
Results
低閾値群
高閾値群
p
総赤血球輸血回数
1545回
3088回
<0.001
平均赤血球輸血単位数
1単位
4単位
<0.001
輸血を受けなかった患者数
176人(36.1%) 6人(1.2%) <0.001
出血の合併
147人(30%) 148人(30%)
FFP
113人(23%) 127人(26%)
PC
79人(16%) 96人(20%)
Albumin
306人(63%) 303人(62%)
HES製剤
16人(3%)
15人(3%)
輸血回数、出血の合併、輸血の種類など
Results
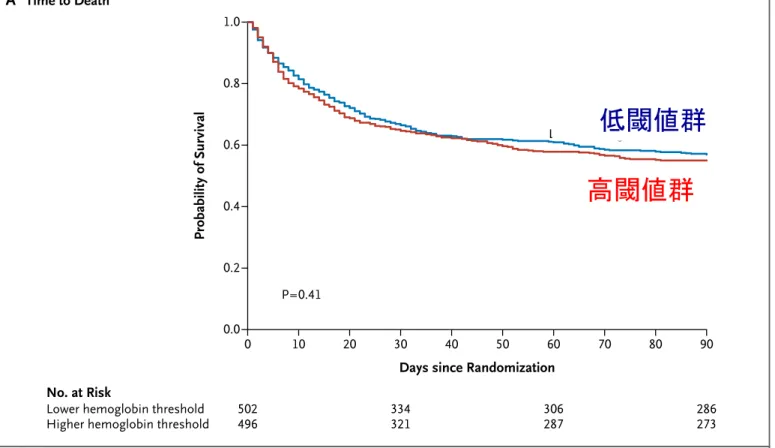
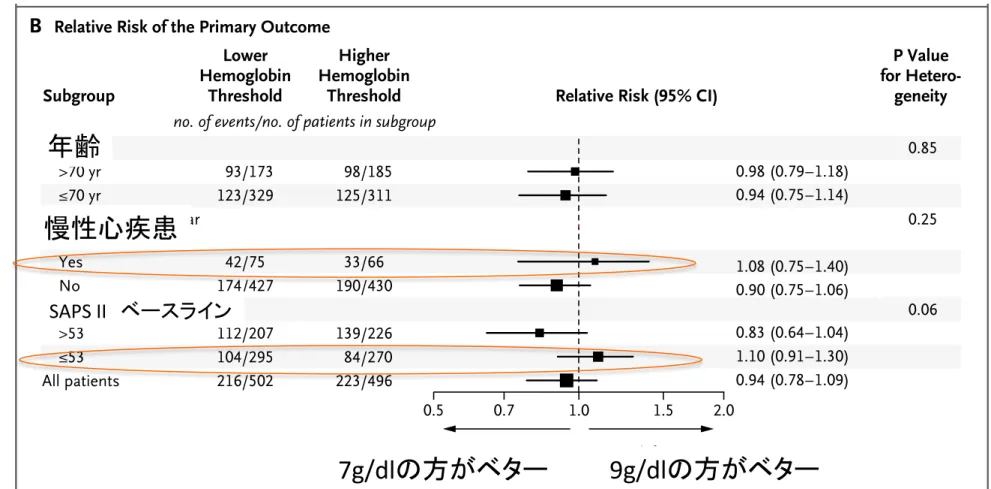
•
Primary outcome:90日後の死亡率
低閾値群 高閾値群 相対危険度
(
95%CI)
p値
90日後
死亡率
43.0%
(
216人)
45.0%
(
223人)
0.94
(
0.78-‐1.09)
0.44
Results
Hemoglobin Threshold for Transfusion in Septic Shock
n engl j med nejm.org
9
B
Relative Risk of the Primary OutcomeA
Time to Death Probability of Survival 1.0 0.8 0.6 0.4 0.2 0.0 0 10 20 30 40 50 60 70 80 90Days since Randomization
P=0.41
No. at Risk
Lower hemoglobin threshold Higher hemoglobin threshold
502 496 334 321 306 287 286 273 Lower hemoglobin threshold Higher hemoglobin threshold
0.7 1.0 1.5 2.0 Higher Hemoglobin Threshold Better Lower Hemoglobin Threshold Better Age >70 yr ≤70 yr Chronic cardiovascular disease Yes No SAPS II at baseline >53 ≤53 All patients Lower Hemoglobin Threshold Higher Hemoglobin
Threshold Relative Risk (95% CI) Subgroup 0.98 (0.79–1.18) 0.94 (0.78–1.09) 1.10 (0.91–1.30) 0.83 (0.64–1.04) 0.90 (0.75–1.06) 1.08 (0.75–1.40) 0.5 0.94 (0.75–1.14) P Value for Hetero-geneity 93/173 123/329 42/75 174/427 112/207 104/295 216/502 98/185 125/311 33/66 190/430 139/226 84/270 223/496 0.85 0.25 0.06 no. of events/no. of patients in subgroup