STUDIES ON THE UTILITY OF RATOON TRAITS OF
RICE AS THE INDICATOR OF AGRONOMIC
CHARACTERS IN BREEDING
MasahikoICHII
CONTENTS
PREFACE
...
3CHAPTER I. . RATOON TRAITS AND THEIR RELATIONSHIPS TO
...
SOME AGRONOMIC CHARACTERS OF MOTHER PLANT 5 Introduction...
5...
Materials and Methods 5 Results...
6
Discussion ... 9
Summary
...
...
...
9CHAPTER I1
.
EFFECTS OF INTERNAL AND EXTERNAL ENVIRONMENTS OF RATOON GROWTH ... 11...
...
SECTION 1.
EFFECTS OF LIGHT AND TEMPERATURE....
11Introduction
...
11...
Materials and Methods...
....
11Results
...
12Discussion ... -14
...
Summary...
-
14SECTION 2
.
EFFECTS OF MACRONUTRIENTS...
.15.Introduction ... 15
Materials and Methods
...
..,...
-15Results
...
16Discussion ... 19
Summary
...
-20SECTION 3 .. EFFECTS OF WATER MANAGEMENT
...
20Introduction ...
....
...
20Materials and Methods
...
21Results
...
22Discussion ... 24
SECTION 4
.
EFFECT OF RESERVE SUBSTANCES...
IN STEM BASE 25...
Introduction 25...
Materials and Methods 25
...
...
Results , 26...
...
Discussion , 29...
Summary 30CHAPTER I11
.
RELATIONSHIP BETWEEN RATOON TRAITS AND...
LODGING RESISTANCE OF MOTHER PLANT 31
...
Introduction 31
...
Materials and Methods 31
...
Results 32
...
Discussion ..35
CHAPTER IV
.
EFFECT OF CUTTING HEIGHT ON RELATIONSHIP OFRATOON TRAITS TO THE PERCENTAGE OF RIPENED
...
GRAINS IN MOTHER PLANT 38
...
Introduction 38
...
..
Materials and Methods ...38
...
Results 39...
Discussion 41...
Summary 42...
CONCLUSIONS.
.
...
43...
ACKNOLEDGEMENTS ,...
45...
...
LITERATURE CITED 46PREFACE
It is the starting point of breeding to discriminate the individuals or the lines fit for breeding objective from the others by means of appropriate measures. The measures presently used may roughly be classified into three types, i.e., straight-, early- and indirect-diagnosis. Straight diagnosis is to straight take the measure of an objective character. Early diagnosis means to evaluate an objective character from its earlier-stage quality. Indirect diagnosis is the evaluation of an objective character by making use of the genetic correlation between the relevant character and some other related character.
Indirect diagnosis contributes much to shortening the term of breeding through the improvement of selection efficiency, and it is mainly applied to the estimation of physiological and ecological traits. In rice plant, for instance, cold resistance is diagnosed by the swelling of tapetal cell under low tem- perature (SAKAI 1947), root activity is evaluated by the a-Naphthylamine oxidation by root (YAMADA and OTA 1958), pre-harvest sprouting is estimated on the basis of the correlation between seed dormancy and tolerance to high-temperature treatment (MARUYAMA 1980), lodging resistance is judged by means of lodging index (MATSUO 1952; SEKO 1962) and lodging coefficient (ONO 1951), and drought resistance is determined by the toxic action of potassium chlorate in seedlings (YAMASAKI 1931). In the cases of wheat and barley, the examples can be found in estimations of baking quality by the gluten content of flour (IKEDA 1937), cold resistance by the tussock (KUSUNOKI and OSANAI 1959), Aluminum tolerance by hematoxylin staining of seedling roots (POLLE et a1 1978; TAKAGI et al. 1981), photo- synthetic capacity by stomata1 frequency (YOSHIDA 1976, 1978).
Rice breeders have placed major emphasis on selection for yield, heading date, time of maturity, plant type including culm length and panicle length, lodging resistance, percentage of ripened grains, disease resistance and grain quality. Of these characters, lodging resistance is most closely related to high yielding This character can be estimated by indirect diagnosis, i.e., by the measurement of lodging index or lodging coefficient as described above. However, these indicators have rarely been applied in actual breeding program, because they require a great deal of labor. Percentage of ripened grains is also an important determinant of grain yield. On this character, however, no reports suggestive to breeding have been available yet, because of the necessity for enormous amount of scoring as well as the low heritability. Hence, at least for these two characters, it is expected that simple and exact methods for estimation, which may fall under the category of indirect diagnosis, are exploited as early as possible.
In rice plant, ratoon, that is, the shoot which grew out of resting bud on the stubble, is often observed after harvest. Though rice breeders have so far taken no notice of ratoon, it has been used as the second crop in a double-cropping system in many countries. Such ratoon cropping often brings some advan- tages; reduced cost of production resulting from no seeding and no transplanting, reduced crop cycle period, less requirement of irrigation water and fertilizer than main crop because of the shorter growth period.
As to the features of ratoon in rice, some investigations (IRRI Ann. Rep. 1975; BAHAR and DE DATTA 1977) have pointed out that grain yield in ratoon crop significantly differ with different cultivars. SATO (1968) suggested that ratoon growth could be used as an index for the physiological situation of rice plant. These findings suggest that the traits of ratoon may successfully be applicable to the esti-
mation of various kinds of agronomic characters of rice plant Up to date, however, there have not appeared any reports suggesting that the traits of ratoon are useful for the estimation of the agronomic characters
From the viewpoint mentioned above, the author intended to make an indirect diagnosis of several agronomic characters of rice plant by means of three traits of ratoon, number of tillers, height of plant and weight of plant, and carried out a series of experiments extending from 1977 to 1981. First, the three traits of ratoon were investigated for the features, the varietal variation, and the relationships to the agronomic characters of mother plant, and the possibility of estimating the mother-plant char- acters by means of ratoon traits was discussed (CHAPTER I) Secondly, the effect of environment on the growth of ratoon was analysed with several internal and external environments, such as tem- perature, fertilizer level, water management and reserve substances contained in stem base (CHAPTER 11). Thirdly, the relationship of two ratoon traits to the lodging resistance and its related characters of mother plant was examined (CHAPTER 111) Finally, the effect of cutting height on the relationship of two ratoon traits to the percentage of ripened grains in mother plant was estimated and its variation with year was analysed (CHAPTER IV) From these investigations, it became clear that the percentage of ripened grains and the lodging resistance in mother plant could effectively be estimated by the percentage of tillers and height of ratoon, especially by percentage of tillers.
CHAPTER I.
RATOON TRAITS AND THEIR RELATIONSHIPS TO SOME AGRONOMIC CHARACTERS OF MOTHER PLANT
Introduction
Cultivated rice is annual and its life is generally brought to an end by cold and/or drought after harvest Under suitable conditions. however, it is able to put forth some new shoots from harvested stubble. The shoots thus regenerated from the main crop (first crop), ratoon, can be used as ratoon crop (second crop) in a cropping system Ratoon cropping has widely been practised and a number of studies on it have been carried out aiming at obtaining more vigorous second crop in many countries, such as India (GUPTA and MIRA 1948; SARAN and PRASAD 1952; GANGLY and RALWANI 1954; REDDY and PAWER 1959), Japan (ISHIKAWA 1964; YAMAMOTO 1973), the Philippines (RAMIREZ and DUMLAO 1961 ; IRRI Ann. Rep 1975, 1978, 1979a, 1979b; BAHAR and DE DAMA 1977), Thailand (HASHIOKA 1963), China (PAN 1952; YANG 1958), Formosa (Iso 1954), the United States (EVATI 1958,1966; EVATT and BEACHELL 1960; MENGEL and LEONARDS 1976), Colombia (GARCIA DURAN 1962, 1963), Swaziland (SZOKOLAY 1956; EVANS 1957) and Ethiopia (PRASHER 1970a, b) Some of these papers pointed out that the grain yield in ratoon crop significantly differed with different cultivars.
Plant breeders have not so far paid much attention to ratoon, and consequently not tried to exploit it in the breeding of rice, because they had no information about the use of ratoon It is considered that a useful way for application of ratoon to breeding is to make use of ratoon as the measure for evaluating agronomic characters From this viewpoint, three traits of Iatoon were taken up, and their relationships to the agronomic characters of mother plant were investigated To discuss the above relationships, however, it is an indispensable precondition that the objective characteristics of the ratoon are under genetic control, i.e
,
heritable Based on this idea, the featu~es of the three traits of ratoon were examined in parallel with their varietal variations at first.Materials and Methods
Thirty rice cultivars (Oryza sativa L ) listed in Table 1 were used as materials They were selected out of the recommended cultivars throughout Japan except Hokkaido district
The experiment was conducted in Kagawa Prefecture in 1977 Thirty six-day-old seedlings were transplanted with a single plant per hill spaced at 30 x 10 cm on June 4 These cultivars were grown in a randomized block design with four replications, each of which comprised 150 plants Fertilizer with 1.0 kg Nla, 0 8 kg P20sla and 1 0 kg K20/a was applied to the main crop as basal dressing, while no fertilization to the ratoon crop
In each replication, 30 plants at a time were cut at 5 cm above the ground at four different growth stages, i e
,
10, 20, 30 and 40 days after heading, exactly after the heading date of the cultivar. The weight, height and number of tillers of ratoon were recorded at 40 days after cutting The weight and the height were measured from plant to plant for dry matter and for the length from the ground level toTable 1 Rice cultivars used.
Name Name Name
1 Kinmaze 11 Minehikari 21 Mineyutaka
2 Yaeho 12 Harebare 22 Sachikaze
3 Nipponbare 13 Akinishiki 23 Tamayodo
4 Tosan No. 38 14 Kusabue 24 Nor in No 24
5 Akitsuho 15 Tsukubanishiki 25 Hakoda
6 Satominori 16 Norin No. 29 26 Yachikogane
7 Akibare 17 Ginmasari 27 Akibae
8 Yamabiko 18 Koshijiwase 28 Suzukaze
9 Norin No. 44 19 Chiyohikari 29 Sachiwatar i
10 Chusei-shinsenbon 20 Azusa 30 Syurei
the top of plant, respecrively. As to the number of tillers, its percentage to the number of mother-plant tillers was calculated. With the residual non-cut plants (mother plants, 30 plants per replication), seven agronomic characters, culm length, panicle length, number of glumous flowers per panicle, percentage of ripened grains, thousand-kernel-weight, number of tillers per plant and a a i n yield, were recorded.
Results
From mother plant, a wide range of intervarietal variation was observed in each of agronomic characters examined. The earliest and the latest heading dates were July 28 and August 30, respectively. For ratoon, the means of 30 cultivars in weight, height and percentage of tillers at different cutting times were as shown in Fig. 1. In each character, the delay of the cutting time from 10 days to 20 days after heading brought about a conspicuous decrease of the value. But some increase was observed in subsequent cuttings, though the degree differed with characters. In each cutting time, a wide range of intervarietal variation was observed also for ratoon. In the case of cutting on the 10th day after
Cutting time (Days after heading)
heading, for instance, weight, height and percentage of tillers varied from 0.1 to 1.8 g, from 5 to 54 cm and from 5 to 71
%,
respectively.The results of variance analysis for the three traits of ratoon are as given in Table 2. They show that there were significant differences in each of the variances due t o cultivar, cutting time and cultivar x cutting time interaction, suggesting that the traits of ratoon were heritable and that the change of each trait with the delay of cutting time differed with different cultivars. The fact that the traits of ratoon are thus heritable is of great importance in case of the ratoon traits a s the indicators of mother plant characters.
Phenotypic correlation coefficients between the traits of ratoon and some agronomic characters of mother plant are given in Table 3. Significant positive correlations were seen in some cases of cutting
Table 2.. Analysis of variance for ratoon traits..
Trait Source d.. f: M. S.. Ratoon weight Ratoon height Cultivar (C) Cutting time (T) C x T Error 3 60 0.06 Cultivar (C) 29 823.58** Cutting time (T) 3 17021 03** C X T 87 192.99** Error 3 60 66 25 Percentage Cultivar (C) 29 3363 81** of
ratoon tillers Cutting time C x T (T)
Err or 360 117.67
~~
**
: Significant at 1 % levelTable 3. Phenotypic correlation coefficients between traits of ratoon and agronomic characters of mother plant
Agronomic character of mother plant Cutting time
Ratoon trait Days after Number of
(
heading)
Culm Panicle glumous Percentage Number Thousand- Grain length length flower per of ripened of tillers kernel- yieldpanicle grains per plant weight
10 -0.35 007 0 12 0 43" 0 01 0 23 0 38* Weight 20 -0.18 -0.23 0..01 0.40" 0.13 -0.14 0.32 30 ,-0.33 0.18 0.19 0.15 -0.34 0..10 0..03 40 -0.04 0.27 0.15 -0.02 -0.34 0.32 -0.07 10 -0.20 0.15 0..18 0..58** 0.17 0.26 0.36 Height 20 -0,22 -0.32 -0.03 0.47* 0.13 -0.01 0.34 30 -0.22 -0.12 0.11 0 15 0.01 .-0.15 0.15 40 -0.25 0.2'7 0.17 0.09 0.07 0,18 0.08 10 -0.41* -0.22 -008 0.59** 006 0.12 0.35 Percentage 20 -0 24 -0 21 -0.11 0 41* 0.15 -0 10 0.18 of tillers 30 -0 31 -0.25 0 05 0.20 000 -0.15 0.06 40 -021 -0 10 0.17 0 17 -007 0 07 0 17
at 10 and 20 days after heading. Among them, those between the traits of ratoon and the percentage ofiipened grains in mother plant are worth being noticed, because they imply that the percentage of ripened grains can be estimated from a ratoon trait. Phenotypic correlation coefficients tended to decrease with the delay of cutting time, and no correlations were observed in cuttings of the 30th and 40th day after heading for any traits and characters.
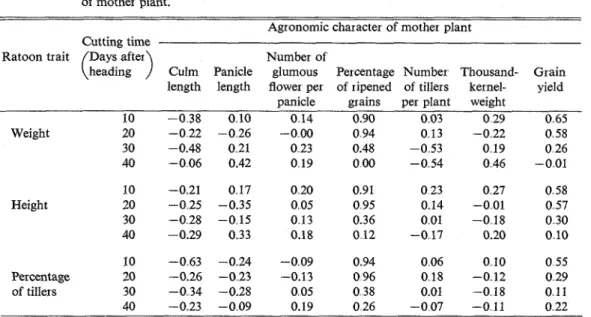
Genotypic correlation coefficients between the traits of ratoon and the agronomic characters of mother plant are shown in Table 4 In cuttings of 10 and 20 days after heading, all the ratoon traits had very high positive correlations with percentage of ripened grains, while had generally low cor- relations with the other characters
Table 4. Genotypic correlation coefficients between traits of ratoon and agronomic characters of mother plant.
Agronomic character of mother plant Cutting time
Ratoon trait
(Days
after) Number of'heading Culm Panicle glumous Percentage Number Thousand- Grain length length flower per of ripened of tillers kernel- yield ,
- panicle grains per plant weight
10 -0.38 0.10 0.14 0.90 0.03 0 29 0..65 Weight 20 -022 -026 -000 0 94 013 -022 0 58 30 -0.48 021 0 23 0.48 -0 53 0 19 0 26 40 -006 0.42 0 19 000 -054 046 -001 10 .-0.21 0.17 0.20 0.91 0 23 0.27 0.58 Height 20 -0.25 -0.35 0.05 0.95 0..14 -0.01 0.57 30 -0.28 -0.15 0.13 0.36 0.01 -0.18 0.30 40 -0.29 0..33 0.18 0.12 -0.17 0.20 0.10 10 -063 -024 -009 0.94 0 06 0 10 0 55 Per centage 20 -0.26 -0 23 -0.13 0 96 018 -012 0 29 of tillers 30 -0 34 -0.28 0 05 0 38 0.01 -0 18 0 11 40 -023 -009 0.19 026 -007 -011 0 22 Table 5, Broad sense heritabilities in traits of ratoon and agronomic characters of
mother plant. Cutting time
Trait of ratoon [Days after) Heritability
/
Character of Heritability\
heading)
(%)1
mother plant ( %)10 79.7
1
Culm length 94 4 Weight Height 10 Percentage of 20 tillers 30 40 Panicle length 92 4 Number of glumousflowers per panicle 92 4 Percentage of I ipened
grains 34 9
umber
of' tillersper plant 61.6
Thousand-kerenel-weight 78.4
Heritability estimates in broad sense of the traits of ratoon and the agronomic characters of mother plant are tabulated in Table 5. The estimates of heritability varied with cutting time for ratoon weight, but were almost constant for ratoon height and percentage of ratoon tillers The estimates of heritability for percentage of ratoon tillers were higher than those for ratoon weight and ratoon height, and were nearly equal to those for culm length, panicle length and number of glumous flowers per panicle of mother plant.
Discussion
Three traits of ratoon, weight, height and percentage of tillers, decreased markedly with the delay of cutting time from the 10th to 20th day after heading, then turned toward increase. These changes are well corresponding to the changes of carbohydrate content in culm shown by SOGA and NOZAKI (1957), who reported that the carbohydrate content in culm of rice plant rapidly decreased during grain-filling period of the 10th to 25th day after heading and slightly increased after that period These facts suggest that ratoon owes its most part of growth to the carbohydrates accumulated in the stem base of mother plant.
Significant differences were observed among cultivars in all of the three traits of ratoon This shows that these ratoon traits are all heritable. PRASHER (1970a), YAMAMOTO (1973), and BAHAR and DE DATTA (1977) reported with the characteristics of rice ratoon that marked differences due to cultivars were observed also in grain yield
Heritability estimate varied with ratoon trait, decreasing in descending order of percentage of tillers, height and weight Throughout the three traits, however, the estimate was high enough to exceed its change due to the time of cutting: The heritability of percentage of ratoon tillers was much as high as those of culm length and panicle length.
The three traits of ratoon showed significant phenotypic- and high genotypic-cor~elations with the percentage of ripened grains in mother plant, when cutting was done after the 10th day from heading. Phenotypic correlation coefficients of the height and the percentage of tillers of ratoon to the percentage of ripened grains in mother plant were higher than that of the weight of ratoon. It may be concluded from the above facts that the percentage of tillers of ratoon obtained by the cutting after 10th day from heading could be used as an effective indicator for the percentage of ripened grains in mother plant This finding will make a significant contribution to actual breeding of rice, because the percentage of ripened grains plays a very important part in constituting yield of rice plant, and rice breeders have not so far been provided with any useful selection measure for percentage of ripened grains due to its very low heritability as seen in Table 5.
Summary
This chapter was aimed at clarifying the features of three ratoon traits, their varietal variations and their relationships to the agronomic characters of mother plant
Thirty cultivars of paddy rice were grown in a randomized block design with four replications, each of which comprised 150 plants The rice plants were cut at 5 cm above the ground at four different
stages, i.e., on the loth, 20th, 30th and 40th day after heading Three traits of ratoon, weight, height and percentage of tillers, were recorded on the 40th day after cutting, and their relationships to the several agronomic characters of mother plant were examined The results obtained were as follows: (1) In all the three ratoon traits, conspicuous decreases were observed when cutting was delayed from the 10th to 20th day after heading However, some recovery occurred in the cuttings of 30th and 40th day after heading.
(2) Analysis of variance suggested that three ratoon traits were all heritable.
(3) In cuttings of the 10th and 20th day after heading, there were observed positive and highly signi- ficant phenotypic correlations between these three ratoon traits and the percentage of ripened grains in mother plant
(4) Heritability in broad sense for the three ratoon traits became higher in ascending order of weight, height and percentage of tillers. Mo~eover, the heritability of percentage of ratoon tillers was as high as those of culm length and panicle length.
(5) Experimental results allowed to conclude that the percentage of ripened grains of rice plant can be estimated by the traits of ratoon, and the estimation can most effectively be done by percentage of tillers among the three traits examined.
CHAPTER 11.
EFFECTS OF INTERNAL AND EXTERNAL ENVIRONMENTS ON RATOON GROWTH
SECTION 1. EFFECTS OF LIGHT AND TEMPERATURE
Introduction
In rice, three traits of ratoon, weight, height and percentage of tillers, are of use for estimating some important agronomic characters of mother plant, as was suggested in the preceding chapter. However, these ratoon traits may be variable according to the internal and external environments of the stubble of which the ratoon grew out, though they are heritable, as already pointed out
In herbage plants, the weight of new tops which grew out of stubble depends on the amount of reserve substances (EHARA et al. 1965a; MAENO and EHARA 1970b) and on the condition of growth such as temperature (MAENO and EHARA 1970a; SATO and MATSUMOTO 1976) Moreover, according to EHARA et al. (1965c), the weight of the new tops increases when top-dressing of nitrogen is applied just before and just after cutting In rice, the grain yield of ratoon crop increased when nitrogen manure was applied to the main crop between its early ripening stage and harvesting time (YAMAMOTO 1967; BAHAR and DE DATTA 1977; IRRI Ann. Rep 1975). BAHAR and DE DATTA (1977) showed that the grain yield of low-cut ratoon crop decreased as the time between the harvest of main crop and the irrigation of ratoon crop was shortened These studies on rice were carried out aiming at the improvement of the double-cr opping of rice through r atooning In rice, however, experiments for analysing the influences of internal and external environments on ratoon have not been made yet
This section presents the effects of temperature and light on the weight, height and percentage of tillers of ratoon and also on the weight of stem base part of mother plant.
Materials and Methods
Rice cultivar Sachiwatar i, which sprouts vigorous r atoon, was used. Thirty four -day-old seedlings were transplanted on June 4 to 1/5000 a Wagner pots with a single plant per pot Compound synthetic fertilizer (N : 15
%,
Pz05 : 12%,
KzO: 15%)
was applied twice: 3 0 and 0.5 g per pot before transplanting and at boot stage, respectively Material plants were cut at 5 cm above the ground on the 10th day after heading, then immediately transferred to four different environments; 30°C and sunlight (30L), 30°C and dark (30D), 20°C and sunlight (20L), and 20°C and dark (20D), where 'sunlight' and 'dark' mean natural condition and real dark throughout the day, respectively. Ratoon weight, ratoon height, percentage of ratoon tillers and besides the weight of stem base were noted on the day of cutting and on the Sth, 10th and 20th day thereafter. The stem base means the base part other than roots of mother plant below the cutting level, in which every leaf sheath of mother plant has been removed. The method for measuring the three traits of ratoon plant was the same as stated in preceding chapter.Results
The heading date of Sachiwatari was August 15 Material plants were cut on August 25 and im- mediately transferred to the four different environments.
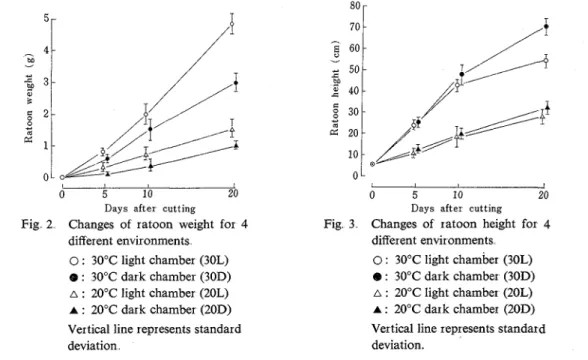
In Fig. 2, changes of ratoon weight against the time after cutting are shown for the four environments. As this figure shows, the weight was higher in lighter and warmer environments The difference of weight was higher between 30°C and 20°C environments than between sunlight and dark environments. At each growth stage of ratoon, 30L produced the highest weight and 30D, 20L and 20D followed it in turn On the 20th day, the difference of weight between 30L and 30D was more remarkable than that between 20L and 20D. In the dark environments, some of the ratoon folliage withered around the 20th day: The withering was more remarkable in 30D than in 20D Therefore, it is supposed for the dark environments that on the 20th day, there would be little increase of the weight, if any. In sunlight environments, the foliage did not wither on the 20th day.
Days after cutting
Fig 2 Changes of ratoon weight for 4 different environments
0 : 30°C light chamber (30L)
@ : 30°C dark chamber (30D) a : 20°C light chamber (20L) A : 20°C dark chamber (20D) Vertical line represents standard deviation
Days after cutting Fig 3 Changes of ratoon height for 4
different environments 0 : 30°C light chamber (30L) 8 : 30°C dark chamber (30D) A : 20°C light chamber (20L) A : 20°C dark chamber (20D) Vertical line represents standard deviation.
Changes of ratoon height are shown in Fig. 3. At every stage of development, the height was higher in 30°C than 20°C, the former being approximately twice as high as the latter There was observed n o difference between sunlight and dark environments excepting a case of 30°C -20th day, where 30D plants were significantly higher than 30L plants. Toward the end of the 20-day observation period, heading was observed in almost all 30L plants and in some of 30D plants, while no panicle emergence was observed in 20L plants nor 20D plants. The age of ratoon plaht on the 20th day was, if expressed by number of leaves, approximately three in 30°C environment and two in 20°C
Figure 4 shows the changes of the percentage of ratoon tillers. The maximum values were 131
%,
105%,
88%
and 78%
in 30L, 30D, 20L and 20D, respectively The time required for reaching these values were 5, 10, 20 and 20 days, respectively. Thus, the lower the temperature was, the lower bothP
I
0 5 10 20
Days after cutting
Fig 4 Changes of percentage of ratoon tillers for 4 different envrionments
0 : 30°C light chamber (30L)
e
: 30°C dark chamber (30D) A : 20°C light chamber (20L) A : 20°C dark chamber (20D) Vertical line represents standard deviation0 ' -
I
0 5 10 20
Days after cutting
Fig 5 Changes of stem-base weight for 4 different environments
0 : 30°C light chamber (30L) 0 : 30°C dark chamber (30D) A : 20°C light chamber (20L) A : 20°C dark chamber (20D) Vertical line represents standard deviation
percentage of ratoon tillers and its rate of increase were
Changes of stem base weight are shown in Fig. 5 Through the 20-day observation, a nearly linear decrease was observed in each environment: The weight was always lower in 30°C than in 20°C. The weight in sunlight was approximately equal to that in dark except for a case of 30°C-20th day, where an evident difference was observed between the two environments
From the decrease of stem base weight (Fig 5) and the increase of ratoon weight (Fig 2), it is inferred that some substances contained in the stem base play an important role in the growth and respiration of ratoon plant Figure 6 shows the changes in sum of stem base weight and ratoon weight. In three
I I I
0 5 10 20
Days after cutting
-
23
9 - 0 * w s 8 - 2 ?? E 2 c "I0 ,S o a 6 - E h 5 -environments 30D, 20L and 20D, the sums were almost constant at around 7 g throughtout the 20 days of observation. In 30L, on the other hand, the sum was nearly equal to those of the other environments until the 10th day, but then it soon increased to reach about 9 g on the 20th day This suggests that after 10th day, the foliage of ratoon in 30L contributed the photosynthetic products to its own growth In dark environment, since the substances contained in stem base should partly be consumed for re- spiration, the total weight may decrease after cutting This decrease, however, was not so large during
1
:
Fig 6 Changes of stem base weight plus ratoon weight for 4 different environments.7-e-sg=&2 0 : 30°C light chamber (30L)
-
:
tB : 30°C dark chamber (30D)A : 20°C light chamber (20L)
the 20-day observation period.. Therefore, it seems that quantity of the substances consumed for respiration is quite little.
Discussion
On the 10th day after cutting, ratoon weight was larger in sunlight environment than in dark one, while stem base weight did not differ between the two environments. This may indicate that the growth of rice ratoon is promoted by photosynthetic products produced in the foliage even at early period after cutting, and that the products do not transfer to the stubble at this period. EHARA et al. (1965b), however, reported in their experiment with bahiagrass that during the first few days after defoliation, light had little effect on regrowth, but more on the stubble This discrepancy is most likely to be due to the difference in material used.
Stem base weight decreased almost linearly throughout the 20 days after cutting in each environment (Fig S), and on the 20th day, became highel in 30L than in 30D. This difference between 30L and 30D may have been caused by the import of photosynthetic products from foliage to stubble. If so, it is expected that the weight started to increase after the 20th day
Both weight and height of ratoon continued to increase in each environment throughout the period of 20 days following cutting (Figs 2 and 3). Percentage of ratoon tillers, on the other hand, increased in each environment at latest by around the 10th day after cutting, but soon reached a constant value (Fig. 4) These facts indicate that percentage of ratoon tillers can be used for earlier evaluation of mother- plant characters than ratoon weight and ratoon height.
Summary
The effect of light and temperature on ratoon growth was investigated with a rice cultivar Sachiwatari. Thirty four-day-old seedlings were transplanted on June 4 to 1/5000 a Wagner pots Material plants were cut at 5 cm above the ground on the 10th day after heading, then immediately transferred to four different environments; 30°C and sunlight (30L), 30°C and dark (30D), 20°C and sunlight (20L), and 20°C and dark (20D) Weight, height and percentage of tillers of ratoon plant and stem base weight were noted on the day of cutting and on the Sth, 10th and 20th day thereafter The results obtained are as follows:
(1) On each of the 5th, 10th and 20th day after cutting, ratoon weight and percentage of ratoon tillers showed higher values in 30°C than in 20°C, and in sunlight than in dark Ratoon height showed higher value in 30°C than in 20°C, but no difference between sunlight and dark except a case of 30°C on 20th day
(2) In every environment, the time required for reaching the constant value was much shorter in percentage of ratoon tillers than in the other two This suggested that percentage of ratoon tillers could more effectively used as the indicator for estimating the characters of mother plant than the other two. (3) Sum of stem-base weight and ratoon weight was almost constant throughout the observation period in all the environments other than 30L In 30L environment, the sum was equal to those in other environments until the 10th day after cutting, but then it soon increased This suggested that after the
10th day, the foliage of ratoon in 30L contributed its photosynthetic products to its own growth The fact that the sum in dark environments were almost constant throughout the 20 day-observation period, suggested that the substances contained in stem base was little consumed for respiration of ratoon plant.
SECTION 2. EFFECT OF MACRONUTRIENTS
Introduction
On the response of ratoon crop to macronutrients, YAMAMOTO (1967), IRRI Ann. Rep (1975) and
BAHAR and DE DATTA (1977) reported that the grain yield of the ratoon crop of rice increased when nitrogen manure was applied to the main crop between the early ripening stage and harvesting time.
Su (1980) also showed with the application of nitrogen fertilizer to ratoon crop of rice that the earlier the application was, the higher the grain yield became In these papers, however, they did not deal with the responses of tiller number and height of ratoon plant. Moreover, no reports on those responses have appeared yet.
The objective of this section is to determine the effects of the amount of nitrogen, phosphorus and potassium fertilizers and the timing of fertilization on the growth of rice ratoon.
Materials and Methods
Rice cultivar Ginmasari was used as material Two hundred seedlings of 35-day-old were trans- planted on June 25 in 1981 to 1/5000 a Wagner pots with a single plant per pot. The transplanted plants were held with the gravel put in a plastic basket of 5 cm deep, and were grown in Kimura's B
solution (the solution listed in Table 6 as "standard") On the heading date of the cultivar, material plants were submitted to the treatment for determining the effect of macronutrient on ratoon growth, using six different nutrient solution shown in Table 6. The treatment was conducted for 20 days
Table 6.. Nutrient solutions used. (mg/l) Constituents
Solution
(Abbreviation) FeC,
Symbol (NH,), KzSO, KNO, Ca CaCl KHz MgSO, H,O, Na, NaNO,
so,
(NO,), 2H2O PO4 xH20 HPO,- - - Macr onutrient 000
-
-
-
-
-
-
659 3 5 --
deficient (NPKO) Standard(NPK1) 111 482 159 185 599-
248 659 3.5 - - Doubled (NPK2) 222 964 31 8 370 59 9-
496 659 3.5-
31 0 Nitrogen 011-
318- -
537 248 659 3 5-
- deficient (NO) Phosphor us 101 482 318 185 599-
- 659 3 5 --
deficient (PO) Potassium 110 482- -
599 --
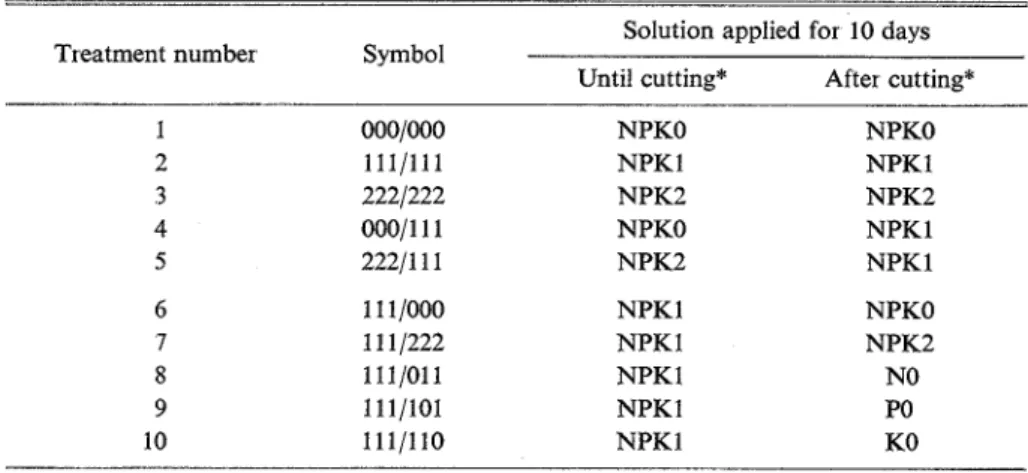
659 3 5 259 156 deficient (KO)Table 7. Design for determining the eff'kct of macronutrients on ratoon Solution applied fbr 10 days Treatment number Symbol
Until cutting* After cutting* NPKO NPKl NPK2 NPKO NPK2 NPKl NPK 1 NPKl NPK 1 NPKl NPKO NPKl NPK2 NPKl NPKl NPKO NPK2 NO PO KO *: Cutting was made at 10 days after heading
according to the design shown in Table 7 , which involved ten kinds of culture As also indicated in Table 7, material plants were cut 10 days after the heading date a t 5 cm above the ground level (grave surface in pot) to make ratoons sprout. After the 20-day treatment finished, all the ratoon plants were cultured by the standard solution for further 30 days
On the 10th day after cutting, percentage of ratoon tillers and ratoon height were noted. On the 40th day after cutting, percentage of ratoon tillers, ratoon height and ratoon weight were recorded. Ratoon height was expressed as the length from the cutting level to the top of plant. The other two traits were measured with the same manner as used in CHAPTER I
Results
The heading date of Ginmasari was August 26 Accordingly, the cutting of plants (mother plants) was made on September 5 (10 days later) and the treatment for determining the eff'ect of macronutrients was conducted for the 20-day period from August 26 to September 15
Figure 7 shows the responses of the three traits of ratoon, percentage of tillers, height and weight, to the total amount of macronutrients applied throughout the treatment On both the 10th and the 40th day after cutting, percentage of tillers significantly increased with the increase of the amount of macronutrients applied On the 40th day, the values in macronutrient-deficient and standard solution cultures became 77 and 88% of the value in doubled solution culture, respectively. The value in macronutrient-deficient solution culture increased from the 10th day toward the 40th day, but those in standard and doubled solution cultures did not change, indicating that sufficient macronutrients promoted tillering.
The increase of height due to the increase of macronutrients was observed on both the 10th and the 40th day Statistical significance was, however, observed only in the increase from macronutrient- deficient to standard solution culture The weight on the 40th day responded to the amount of macro- nutrients applied, increasing significantly The values in macronutrient-deficient and standard solution cultures were 75 and 90% of the value in doubled solution culture, respectively. These ratios
Percentage of ratoon tillers (%) Percentage of ratoon tillers (%)
0 60 70 80 90 100 0 60 70 80 90
N P K N P K P(i I I I I I N P K NPK
'
"
I I I000/000
*
000/1111
1a xRatoon height (cm) Ratoon helght (ern)
0 10 20 30 40 50 0 10 20 30 40 50 I
,
I I I I I I I I I 1 ooo/ooo*
-
000/1111
x 111/111 111/1117
a-
X I b 222/222,
I x 222/111 --a ---X lRatoon weight (g) Ratoon weight (g)
0 3.6 4.0 4.4 4.8 5 2 0 3.6 4.0 4.4 4.8 I -' - I I I r// I I I I ooo/ooo =x 000/111 1 I X 222/222 1 I
Fig. 7. Effect of the amount of macronutrients applied during 20 days following heading on three ratoon traits; cutting was done at 10 days after heading
-
: On the 10th day after cutting, / / : On the 40th day after cutting. The means with the same letter are not significantly diff'erent from one another at 5 % level, according to Dancan's Multiple Range Test.222/111 I 1 x
Fig 8 Effect of the macronutrient application during 10 days before cutting on three ratoon traits
-
: On the 10th day after cutting, 1 - 1 : On the 40th day after cutting The means with the same letter are not significantly different from one another at5 % level, according to Dancan's Multiple Range Test
are approximately equal to those observed in percentage of tillers.
Figure 8 shows the responses of the three traits of ratoon to the macronutrient application during 10 days prior to cutting On both the 10th and 40th day after cutting, percentage of tillers tended to be higher in standard and doubled solution than in macronutrient-deficient solution, but statistically significant differences were not detected. Likewise, no significant differences were observed in height nor weight.. Thus, fertilization of macronutrients during 10 days just before cutting proved not t o have any significant influence on ratoon growth..
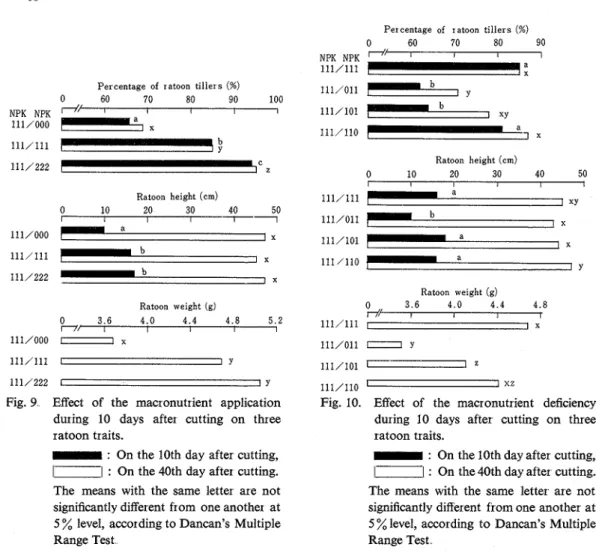
The responses of the three ratoon traits to macronutrient application during 10 days just after cutting are as shown in Fig. 9 . On both the 10th and the 40th day after cutting, percentage of ratoon tillers significantly increased as the amount of macronutrients increased. On the 40th day, the values in macronutrient-deficient and standard solution culture reached 73 and 90% of the value in doubled solution, respectively. These ratios are approximately equal to those in percentage of tillers shown in Fig. 7. Thus, the percentage of tillers in macronutrient-deficient solution was still far less than that in standard solution even on the 40th day after cutting, whereas ratoon plants had all been cultured in the same solution (standard solution) after the 10th day from cutting.. This means that tillering of ratoon is mostly determined by the amount of macronutrients existing during 10 days following cutting. The height on the 10th day after cutting was significantly lower in macronutrient-deficient solution
Percentage of ratoon tillers (%)
0 60 70 80 90
NPK NPK T-N I I I
111/111
;
1
-P e r centage of ratoon tillers (%)
0 60 70 80 90 100 NPK NPK
d
'
I I I I 111/0001
7 a x Ratoon height (cm) 0 10 20 30 40 50 I I I I 1 111/0001
'
a I x 111/1111
I b I X 111/222 b x Ratoon weight (g) O n , I 3.6 4.0 4.4 4.8 5.2 I I I I 111/000-
xFig. 9 Effect of the macronutrient application during 10 days after cutting on three ratoon traits.
-
: On the 10th day after cutting,1-
I : On the 40th day after cutting. The means with the same letter are not significantly different from one another at 5 % level, according to Dancan's Multiple Range TestRatoon height (em)
0 10 20 30 40 50
Ratoon weight (g)
0 3.6 4.0 4.4 4.8
r// I I I r
111/111 1 I x
Fig. 10. Eff'ect of the macronutrient deficiency during 10 days after cutting on three ratoon traits.
-
: On the 10th day after cutting,1-1
: On the 40th day after cutting. The means with the same letter are not significantly different from one another at 5 % level, according to Dancan's Multiple Range Testthan in standard and doubled solutions. On the 40th day, however, such a significant difference dis- appeared. The weight was significantly increased in response to the dose of macronutrients The values in macronutrient-deficient and standard solutions were 73 and 93
%
of the value in doubled solution, respectively. These ratios were approximately equal to those in the percentage of tillers and weight shown in Fig 7. Fertilizing during 10 days following cutting thus proved t o have a n important influence on ratoon, especially on percentage of tillers and weight.The effects of nitrogen-, phosphorus- or potassium-deficiency on the three traits of ratoon are shown in Fig 10 On the 10th day, after cutting, significant decrease of percentage of tille~s was observed in nitrogen- and phosphorus-deficient solution, but not in potassium-deficient solution On the 40th day, significant decrease of this trait was observed only in nitrogen-deficient solution, though an apparent decrease occured in phosphorus-deficient solution. Percentages of tillers in nitrogen-, phosphorus- and potassium-deficient solutions were 84, 92 and 101
%
of that in s t a n d a ~ d solution, respectively. Over 10th and 40th days, significant decrease of height was observed only on the 10th day and only in nitrogen-deficient solution With the decrease of weight, nitrogen-deficiency ranked first, followed by phosphorus-deficiency, potassium-deficiency and standard in turn, and mutual differences were all significant except those between phosphorus-deficient and potassium-deficient solutions, and betweenpotassium-deficient and standard solutions.. The weights in nitrogen-, phosphorus- and potassium- deficiencies were 75, 88 and 95
%
of' that in standard solution, respectively.Discussion
As can be seen from the observation on the 40th day after cutting, the application of macronutrients before cutting produced no significant effect on all the ratoon traits examined (Fig. 8), but that after cutting brought about considerable difference due to the applied amount in percentage of ratoon tillers as well as in ratoon weight, though not in ratoon height at all (Fig 9) This means that the time of fertilization as well as the amount is of great importance for increasing percentage of ratoon tillers, but not for increasing ratoon height. According to BAHAR and DE DATTA (1977), however, when the rate of nitrogen applied to ratoon crop increased, the tiller number of ratoon plants did not show any significant increase This discrepancy may be attributable to the difference between solution culture in pot and soil culture in field.
The result that macronutrient application before cutting had no significant effect on all the ratoon traits, may also suggest that macronutrient application before cutting produces no increase of the reserve substances in stem base This consideration may be supported by EHARA et a1 (1965a), who showed in Italian ryegrass and orchardgrass that the dry weight of new tops increased with the increase of reserve substances contained in stubble
According to DE DATTA (1981), the symptom of nitrogen and phosphorus deficiencies in rice plants is' stunted plants with limited number of tillers', while that of potassium deficiency is' stunted plants with slightly reduced number of tillers'. SEKIYA (1963a, b, 1967) showed that the inhibitory effect on the tiller ing-bud development in rice plants was largest for nitrogen deficiency, second for phosphorus deficiency, third for potassium deficiency; especially the effects of nitrogen and phospho~us deficiencies were remarkable EHARA et al. (196%) indicated on the regrowth of bahiagrass that the effect of macronutrient deficiency in nutrient solution was by far larger for nitrogen than others and very slight for potassium, and there was no difference of the regrowth behavior between the plants grown in phosphorus-deficient nutrient solution and those grown in standard one In the present experiment, the effect of macronutrient deficiency on percentage of ratoon tillers was largest for nitrogen, second for phosphorus, third and slight for potassium These facts show that the deficiency of some macro- nutrient affects main crop and ratoon crop in the same manner
The weight and tiller number of ratoon were influenced most remarkably by nitrogen (Fig. 10) This stands for the importance of nitrogen in ratoon crop of rice, since the weight and tiller number of ratoon directly take part in the grain yield of ratoon crop BAHAR and DE DATTA (1977) and MENGEL and WILSON (1981) reported that significant increase of grain yield in ratoon crop of rice was obtained by the nitrogen fertilization following cutting The same results were shown in sorghum by ESCALADA and PLICKNETT (1977) and TOUCHTON and MARTIN (1981) According to MAENO and EHARA (1970b), NADA and EHARA (1970) and WILMAN and W R I G H ~ (1978), ratoon weight also significantly increased by applying nitrogen fertilizer following cutting in oats, dallisgrass, Italian ryegrass, perennial ryegrass and orchardgrass These indications that the application of nitrogen is needed for the ratoon cropping in rice and grasses seem to support the results of the present experiment
As easily inferred from the above facts, the deficiency of nitrogen greatly reduced the growth of ratoon (Fig 10) This reduction of ratoon growth is considered to be due to the inhibitory effect of nitrogen deficiency against the utilization of reserve substances accumulated in stem base, because all the plants submitted to the treatment for macronutrient deficiency (Fig 10) were grown under the same nutritional condition from transplanting to cutting, and hence they should have had the same amount of the reserve substances at the cutting time Thus it may be concluded that the nitrogen applied just after cutting plays a very important role in the utilization of reserve substances, eventually in the growth of ratoon plant The above interpretation for the action of nitrogen is supported by the result of KUMAI and SANADA (1973) that in the regrowth of orchardgrass, nitrogen deficiency gave rise to the reduction of utilization efficiency of reserve substances.
Putting the results obtained from the present experiment together, in so far as the fertilizers are liquid ones, it can be said that the applications of nitrogen and phosphorus fertilizers immediately after harvesting of the main crop are most effective for ratoon production
Summary
In this section, the effects of macronutrients on ratoon growth of rice were examined for the amount, kind and time of application.
Rice plants of a cultivar Ginmasari were grown in Kimura's B solution (standard solution) On the heading date of the cultivar, material plants were submitted to the 20-day treatment which consisted of ten kinds of culture with six different nutrient solutions. Material plants were cut 10 days after the heading date (in the middle of the treatment) at 5 cm above the ground level. After the 20-day treat- ment finished, all the ratoon plants were cultured by the standard solution for further 30 days On the 10th day after cutting, percentage of ratoon tillers and ratoon height were noted On the 10th and 40th day after cutting, percentage of ratoon tillers, ratoon height and ratoon weight were recorded. The results obtained are as follows:
(1) The macronutrient application during 10 days prior to cutting had no significant influence on all the three ratoon traits examined, but that during 10 days after cutting brought about considerable differences due to the applied amount in two traits, percentage of ratoon tillers and ratoon weight.
(2) With the decreases of percentage of tillers and weight, the effect of nitrogen deficiency ranked first, followed by phosphorus deficiency, potassium deficiency and standard solution in turn. The values of these traits in potassium deficiency did not differ from those in standard solution.
SECTION 3. EFFECT OF WATER MANAGEMENT
Introduction
Effects of exte~nal environments such as light, temperature and macronutrients on the growth of ratoon were discussed in the preceding sections These discussions naturally lead to the interest that water management may also have significant effects upon the growth of ratoon. According to HARNAEZ
(1958), irrigation immediately after harvest is liable to cause the stubble to rot. BAHAR and DE D A ~ A (1977) found that when the stubble was reflooded, the cutting height of the main crop had no influence on the grain yield of ratoon crop That is, when the main crop was cut at the ground level, the yield of ratoon crop increase by delaying the flooding until 12 days after harvest. When the main crop was cut at 15 cm, on the other hand, the timing of the flood during the first 16 days after harvest had no effect on the yield of ratoon crop MENGEL and WILSON (1981) reported that early flooding after harvest of the main crop resulted in a more rapid and uniform regrowth than delayed flooding.
The objective of this section to determine the effect of reflood timing on the growth of rice ratoon. The study consists of two experiments.
Materials and Methods Experiment I.
Eighty plants each of twb rice cultivars, Yaeho and Oseto, were used as materials. Thirty five-day-old seedlings were transplanted on June 17 in 1980 to 1 /ZOO0 a Wagner pots with two plants per pot. Trans- planted plants were fertilized with 12.0 g of compound synthetic fertilizer (N: 15
%,
P20s : 12%,
KzO: 15%) Five-sixth of the fertilizer was broadcasted before transplanting; the rest was applied at the boot stage. Material plants were cut at ground level and at 5 cm above the ground on the 10th day after the heading date of each cultivar Immediately after the cutting, plants received two irrigation treatment; a continuous flooding 5 cm deep and a non-flooding. On the 5th, loth, 20th and 40th day after cutting, percentage of ratoon tillers and ratoon height were measured by the same manner asstated in the preceding section.
Experiment 11.
One hundred and fifty plants of a rice cultivar Koshihikari was used as materials. Thirty five-day-odl seedlings were transplanted on June 18 in 1981 to 112000 a Wagner pots with two plants per not. The transplanted plants were fertilized in much the same way as in Experiment I. Material plants were cut at 20 cm above the ground on the 10th day after the heading date of' the cultivar.. The plants received ten irrigation treatments which differed in the depth of water (drained, under 1 cm, 5 cm)
Aug S ~ P Oct
Treatment 24 26 28 30 1 3 5 7 9
1\T,
I * V
1 . . _ _ _ -
2
-
-1 Fig 1 1 Water management assigned.3 .
_ -
_ _ _
__..
-
-am--- : Drained 4_ ___
__-
-
: Under 1 cm of water 5 __. ._
_ _ _ _ _ _
-
0 : At 5 cm of water 6-__
_ _ _
. ._
_ _ _
__
_
.
_ _ _
___-
7 I _ _ _ _ _ _ _ _._ _ _
_____-
Material cutivar
,
Koshihikar i, headed 8_ _ _ _ _ _ _ _ _ _ _ _ _ _ _ _ _ _ _
on August 22. Cutting was made on9
_
_
_
_
_
_
_ _ _ _ _ _
_
September 1 10_ _ _ _ _ _ _ _ _
, ' " ' ' " ' , + ,
Aug Sep. Oct
and the period of flooding. Figure 11 shows the design of the experiment. Percentage of ratoon tillers and ratoon height were measured in the same way as in Experiment I.
Results Experiment I .
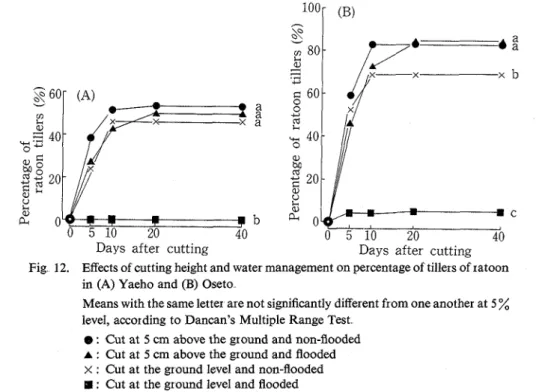
The heading dates of Yaeho and Oseto were August 31 and August 26, respectively Changes in percentage of ratoon tillers are shown in Fig. 12. Most of hills in either cultivar did not produce
Days after cutting Days after cutting
Fig 12. Effects of cutting height and water management on percentage of tillers of ratoon in (A) Yaeho and (B) Oseto
Means with the same letter are not significantly different from one another at 5 % level, according to Dancan's Multiple Range Test
@ : Cut at 5 cm above the ground and non-flooded
A : Cut at 5 cm above the ground and flooded
x : Cut at the ground level and non-flooded : Cut at the ground level and flooded
ratoons when the main crop was cut at ground level and the water depth was maintained at 5 cm. Flooding with 5 cm depth, however, did not affect the percentage of ratoon tillers when the main crop was cut at 5 cm. Reducing the cutting height from 5 cm to the ground level caused a significant decrease of ratoon number for Oseto, but not for yaeho. Percentage of ratoon tillers reached its highest value on the 20th day after cutting
Figure 13 shows the changes in ratoon height following cutting. In the treatment where cutting height was the ground level and water depth was 5 cm, there was observed extremely low ratoon height in Oseto, and was hardly observed ratoon growth in Yaeho Among the other treatments, no significant differences of ratoon height were found in both cultivars. Flooding with 5 cm depth did not affect ratoon height when the main crop was cut at 5 cm above the ground level. Cutting height did not aff'ect ratoon height, which reached the highest value within 35 days after cutting, in non-flooded treat- ments. Heading was observed in most treatments during the period from the 30th to the 35th day after cutting
Days after cutting Days after cutting Fig 13. Eff'ects of cutting height and water management on height of ratoon in (A) Yaeho
and (B) Oseto.
Means with the same letter are not significantly different from one another at 5 % level, according to Dancan's Multiple Range Test
@ : 'Cut at 5 cm above the ground and non-flooded A : Cut at 5 cm above the ground and flooded
x
: Cut at the ground level and non-flooded.
: Cut at the ground level and floodedTable 8 Percentage of ratton tillers and ratoon height in different water managements Days after cutting
Trait Treatment
----
number 5 10 20 40 1 2 3 Percentage of 4 r atoon tillers 5 6 7 8 9 10 Ratoon height 1 9.84~1 8 1 7 0 1 1 8 325f 1 9 42 6rt1.9 2 10 6fO 8 20.410 8 360rt1.2 46 4rt0.9 3 11 4 f 1 2 22 8h1.1 34 8f1.4 4 5 8 f l 6 4 9 6+0 9 19 0 5 0 8 37 2f 0.7 44 6 f l 5 5 10.4rt1.1 18 4 1 1 3 3 5 2 f l 6 4 4 2 f 1 8 6 9 0 r t l l 19.011 1 3 4 4 5 1 2 47 2 5 0 8 7 9 8 f 1 3 19 811.1 33 8 f l 5 44 8f1.7 8 9.450 9 1 7 0 k l 3 30 6rt2.1 43 0 1 2 0 9 8 850.3 18 4 5 0 2 31 8 5 1 0 4 4 4 5 1 6 10 8 4fO 5 16.810 8 33.051 4 40.8&1 2 NS NS NS NSNS: Means within vertical column are not significantly different from one another at 5 % level, according to analysis of variance.
Experiment I1
T h e heading date of Koshihikari was August 22. Material plants received ten irrigation treatments
(@. 11) The ratoon crop caused no missing hills Percentage of ratoon tillers and ratoon height on the 5th, loth, 20th and 40th day after cutting are shown in Table 8. Percentage of ratoon tillers was the highest on the 20th day from cutting, being the same as the result of experiment I Percentage of ratoon tillers tended to be lower in the treatments which had flooded immediately after cutting than in those which had not flooded for a week following cutting. Ratoon height reached the highest value within 35 days after cutting alike experiment I, and did not differ much among all the treatments. The conclusions based on the variance analyses for percentage of ratoon tillers and ratoon height are given in Table 8 as "NS', showing that there were no significant differences of variance among the irrigation treatments. Thus, the water management as shown in Fig. 11 seems not to significantly affect the percentage of ratoon tillers nor ratoon height, when the cutting is made at as high as 20 cm.
Discussion
There were uniformly observed vigorous ratoons when mother plants were cut at 5 cm above the ground level. When the stubbles were submerged in water due to the cutting at the ground level, however, most of the hills did not produce ratoons (Fig 12). On the other hand, BAHAR and DE D A T ~ A (1977) observed also that missing hill increased as the time between harvest and irrigation as shortened These facts suggest that the occurrence of missing hills are due to rotting of the resting buds of ratoon plant as HARNAEZ (1958) reported, and that large amount of oxygen are needed for regenerating of the resting buds, because the rotting is considered to be caused by a oxygen deficiency at the resting buds
Water management did not affect percentage of ratoon tillers and ratoon height when the main crop was cut at 5 cm above the ground (Fig 12 and Table 8) BAHAR and DE DATTA (1977) also reported that the effect of water management was not significant on the grain yield of ratoon crop According to MENGEL and WILSON (l98l), however, early flooding after the harvest of main crop resulted in rapid and uniform growth of ratoon crop and consequently in increase of grain yield This discrepancy may be due to the difference in the cultivar used as material and the condition of culture, especially the soil moisture at harvesting time of main crop
In either cultivar used as material, percentage of ratoon tillers did not increase after the 20th day from cutting (Fig 12 and Table 8) On the other hand, HSIEH and YOUNG (1959) and MAHIUL HAQUE and COFFMAN (1980) found in ratoon crop that tiller number related significantly and positively to grain yield These facts show that in double-cropping through ratooning, number of tillers required for high grain yield should be ensured in the period from the day of cutting of main crop to the 20th day after cutting.
Summary
To determine the effect of water management system on the growth of rice ratoon, two experiments, which were different from each other in year of' practice, cultivar used, cutting height and irrigation
condition, were conducted. Through the two experiments, material rice plants were grown in 1/2000 a Wagner pots and cut on the 10th day after heading Cutting was made at the ground level and 5 cm above the ground in experiment I, and at 20 cm above the ground in experiment I1 Water depth for irrigation was 5 cm in experiment I and under 1 cm and 5 cm in Experiment 11. At 40 days after cutting, percentage of ratoon tillers and ratoon height were examined. The results obtained are as follows:
(1) When the main crop was cut at the ground level and the water depth was maintained at 5 cm above the ground, most of the hills did not produce ratoons
(2) When the main crop was cut at 5 cm above the ground, water depth did not affect the percentage of ratoon tillers and ratoon height
(3) When the main crop was cut at 20 cm above the ground, no significant effects of water management on the percentage of ratoon tillers and ratoon height were observed
(4) Experimental results suggested that no special attention is needed for the water management in case of estimating agronomic characters of mother plant by ratoon traits.
SECTION 4. EFFECT OF RESERVE SUBSTANCES IN STEM BASE
Introduction
In the preceding section, the effects of some external environments on the growth of rice ratoon were studied. However, it is natural to consider that ratoon growth must be affected also by internal environments of the stubble and roots, such as the amount of reserve substances, the number and vigor of resting' buds, and so on With regard to this, EHARA et al. (1965a) reported that in herbage plants, the dry weight of new tops increased with the increase of reserve substnaces contained in the stubble. This may be the case with rice. However, the investigations concerning such internal environments have not so far been published to date in rice.
This section is to clarify the effect of reserve substances contained in stem base of rice plant on the growth of the ratoon
Materials and Methods
Forty plants each of 6 rice cultivar s, Ginmasar i, Sachiwatar i, Chiyohikar i, Azusa, Satominori and Yaeho, were used as materials. Thirty five-day-old seedlings were transplanted to 1/5000 a Wagner pots with a single plant per pot on June 5 in 1980 and compound fertilizer (N: 15
%,
PzOs: 12%, KzO: 15%)
was applied at the rate of 3..5 g per pot as basal dressing.. For 2 weeks from 4 days before heading to 10 days after heading, the plants were grown in the green house under three different environments; full sunlight (natural condition), about 50% sunlight and about 25% sunlight.. The intensities of sunlight in these environments were 83, 41 and 21x
lo3 lux, respectively. Regulation of sunlight was made aiming at artificial control of the amount of the reserve substances to be accumulated in the stem base of plant. The treatment was carried out by shading with black cheese cloth. The plantswere cut at 5 cm above the ground on the 10th day after heading (exactly, the heading date of relevant cultivar). Immediately after cutting, the plants were transferred to dark environment (real darkness) of 25°C. No fertilizer was applied to the ratoon crop.
Ratoon height and percentage of ratoon tillers were noted on the 5th, loth, 15th, 20th, 30th and 40th day, and ratoon weight was scored on the 40th day after cutting. Methods for measuring these traits were the same as those in CHAPTER I On the day of cutting, on the other hand, stem bases of some plants were sampled and measured for dry matter weight to determine the stem base weight per hill and stem base weight per stem. Furthermore, the total available carbohydrate (TAC) content of stem base was analyzed in the manner suggested by MURAYAMA et al. (1955) and from the results obtained, TAC weight in stem base per hill and that per stem, and TAC content in stem base were determined.
Results
The heading dates of the six cultivars ranged from August 9 to August 20.. The results of variance analysis for the five stem-base traits, i e
,
stem base wieght per hill and that per stem, TAC weight in stem base per hill and that per stem and TAC content in stem base, and those for the three ratoon traits, i.e., percentage of tillers, height and weight, are shown in Table 9. The variances due to cultivar were all significant. This suggests that the traits examined for stem base and ratoon are all heritable. The variances due to shading were also all significant and no variance due to cultivar x shading inter- action were significant. This result means that all the traits examined varied with the extent of shading, and that no detectable differences in the varying existed among cultivarsThe means of five stem-base traits of the six cultivars in three different environments are given in
Table 9 Variance analysis for five stem-base characters of mother plant and three ttaits of ratoon plant.
Mean square in stem-base characters1)
Source d f. TAC weight TAC weight
Stem base Stem base weight in stem base in stem base TAC content weight per hill per stem per hill per stem in stem base
Cultivar (C) 5 2.61** 0 0056* 0 442* 0.0029* 0..091**
Shading (S) 2 17.05** 0 0220** 3 227** 0 0163** 0 123**
C X S 10 0 51 0 0010 0 123 0 000'7 0 055
Error 54 0 27
-
--
0 022Mean square in ratoon traits2) Source d.f.
Percentage of
ratoon tillers Ratoon height Ratoon weight
Cultivar (C) 5 1452.2** 2015.4** 0 39**
Shading (S) 2 7887.4** 6885.8** 3 11**
C X S 10 85.8 61.5 0..04
Error 54 241.3 86.6 0..03
*.
**:
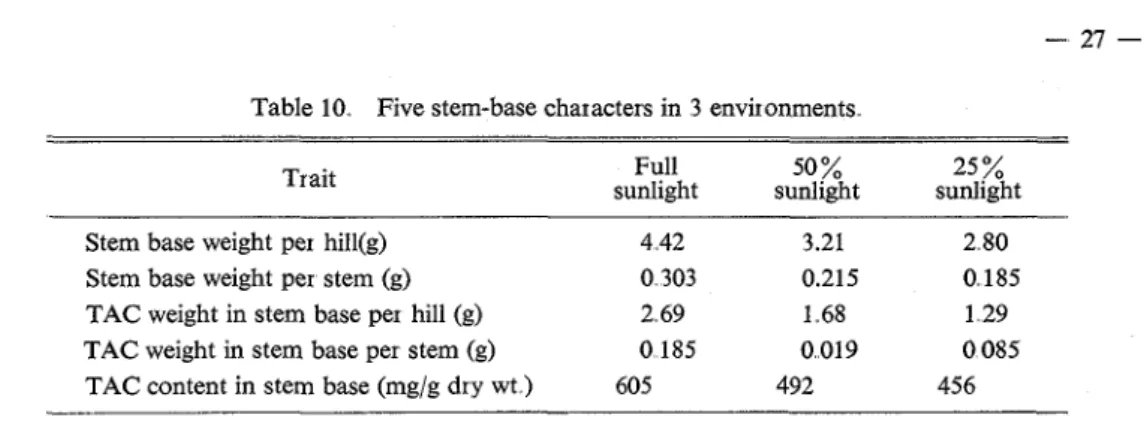
Significant at 5 and 1 % level, respectively.Table 10. Five stem-base characters in 3 environments.
Trait sunlight Full sunlight 50 % sunlight 25 %
Stem base weight per hill(g) 4 42 3.21 2 80
Stem base weight per stem (g) 0 303 0.215 0 185
TAC weight in stem base per hill (g) 2 69 1 68 1 29 TAC weight in stem base per stem (g) 0 185 0 019 0 085 TAC content in stem base (mg/g dry wt ) 605 492 456
Table 10 As seen from this table, the values of the five stem-base traits considerably and linearly increased with the intensity of sunlight
Figure 14 shows that the changes of percentage of ratoon tillers and ratoon height in the three different environments As shown in this figure, both the parameters increased logistically as the days after cutting increased The greatest values were significantly different from each other among the three environments.
D a y s after c u t t ~ n g D a y s after cutting
Fig 14 Changes in percentage of ratoon tillers and ratoon height in 3 different en- vironments.
: Full sunlight, A : 50% sunlight, : 25 % sunlight
The greatest values in percentage of ratoon tillers were 71,58, and 35
%
in full, 50%,
and 25%
sunlight, respectively. The time required for reaching these greatest values did not vary with environment, being about 15 days The greatest values in ratoon height were 64,48, and 30 cm in full, 50%,
and 25%
sunlight, respectively. The time required for reaching these greatest values was decreased with reducing intensity of sunlight; 30, 25, and 20 days in full, SO%, and 25% sunlight, respectively.
Figure 15 shows ratoon weight in the three different environments o n the 40th day after cutting. As seen from this figure, the weight was conspicuously decreased with the decrease of sunlight intensity. Both the five stem-base traits and the three ratoon traits increased with the increase of the intensity of sunlight. This tendency was statistically verified by the results shown in Table 11, which indicates that every one of the cor~elation coefficients between the five stem-base traits and the three ratoon traits was positive and significant. Of the five stem-base traits, those other than TAC content were correlated with the three ratoon traits more highly than TAC content. As t o the three ratoon traits, on the other