Resource Optimization for Connected Internet
of Things
その他(別言語等)
のタイトル
IoTにおけるリソースの最適化
著者
KUMRAI Teerawat
学位名
博士(工学)
学位の種別
課程博士
報告番号
甲第418号
研究科・専攻
工学専攻・先端情報電子工学コース
学位授与年月日
2018-03-23
URL
http://hdl.handle.net/10258/00009639
Resource Optimization for Connected
Internet of Things
Teerawat KUMRAI
Department of Information and Electronic Engineering
Muroran Institute of Technology
This dissertation is submitted for the degree of
Doctor of Philosophy of Engineering
Declaration
I hereby declare that this thesis is my own work and effort and that it has not been submitted anywhere for any award. Wherever contributions of others are involved, every effort is made to indicate this clearly, with due reference to the literature, and acknowledgement of collaborative research and discussions.
Teerawat KUMRAI March 2018
Acknowledgements
Firstly, I would like to express my sincere gratitude to my advisor Prof. Mianxiong Dong and Prof. Kaoru Ota for the continuous support of my Ph.D study and related research, for their patience, motivation, and immense knowledge. Their guidance helped me in all the time of research and writing of this thesis. I could not have imagined having a better advisor and mentor for my Ph.D study.
Besides my advisor, I would like to thank the rest of my thesis committee: Prof.Jay Kishigami, Prof. Yasuo Kudo, and Prof. Jie Li, for their insightful comments and encourage-ment, but also for the hard question which incented me to widen my research from various perspectives.
My sincere thanks also goes to Dr. Paskorn Champresert, and Dr. Kyoungsook Kim, who provided me an opportunity to join their team as intern, and who gave access to the laboratory and research facilities. Without they precious support it would not be possible to conduct this research.
I would like to acknowledge the financial, academic and technical support of the Muroran Institute of Technology. The Department of Information and Electronic Engineering has provided the support and equipment I have needed to produce and complete my thesis.
Last but not the least, I would like to thank my family: my parents and to my brother for supporting me spiritually throughout writing this thesis and my life in general.
Teerawat KUMRAI March 2018
Abstract
Recently, there are more than 9 billion things that connected in the Internet of Things (IoT) and the number is exceed more than 24 billion in 2020. It means that numerous data will be generated because of increasing quickly of the number of things. An infrastructure should be developed to manage the connected things in IoT. Moreover, cloud computing will play important role in terms of data storage and analysis for IoT. Therefore, a cloud broker is considered as an intermediary in the infrastructure for managing the connected things. The cloud broker will find the best deal between clients and service providers. However, there are three problems among cloud broker, clients and service providers that are the response time of the request from clients, the energy consumption of the system and the profit of the cloud broker. The three problems are considered as multi-objective optimization problem to maximize the profit of the broker while minimizing the response time of the request and the energy consumption. A multi-objective particle swarm optimization (MOPSO) is proposed to solve the problem. MOPSO is compared with a non-dominated sorting genetic algorithm-II (NSGA-II) and a random search algorithm.
Since, there are a lot of data including social media and geographic location, generated in IoT. Coupling social media with geographic location has boosted the worth of understanding the real-world situations. Event detection aims to find more specific topic which represents real-world event. However, identification of unusual and seemingly inconsistent patterns in data, called outliers, is necessary. The problem is how to partition a spatio-temporal domain to find a meaningful local outlier pattern. A k-dimensional (KD) tree partitioning is applied to divide a spatio-temporal domain into sub-cells. The optimal partitioning problem in a spatio-temporal domain has been proven as an NP-complete problem. Therefore, a genetic algorithm is proposed to solve the problem.
Moreover, in the future, there will be a steady increase in energy consumption as well as emission levels from using energy in IoT. It needs some system or application to manage the energy consumption and emission pollutant in IoT. Moreover, the smart grid is strongly related to IoT technologies. It is enabled by IoT to handle big data and reduce the number of communication protocols. The micro-grid is studied because of micro-grids are part of a larger system that makes the smart grid to become reality. The micro-grid also is able
viii
to manage energy consumption for reducing the emission pollutant. Thus, the operation management problem and pollutant emission problem are important problems for the micro-grid system. Thus, reducing the total energy expenses and pollutant emission of micro-micro-grid and improving the renewable energy sources (battery energy storage) are considered together with the operation management of the micro-grid system. A fitness-based modified game particle swarm optimization (FMGPSO) algorithm is proposed to minimize the total costs of operation and pollutant emissions in the micro-grid and multi-microgrid system. FMGPSO is compared with A non-dominated sorting genetic algorithm-III (NSGA-III), a multi-objective covariance matrix adaptation evolution strategy (MO-CMAES), and a speed-constrained multi-objective particle swarm optimization (SMPSO).
Table of contents
List of figures xiii
List of tables xv
Nomenclature xvii
1 Introduction 1
1.1 Background and motivation . . . 1
1.2 Statement and significance of resource optimization for connected Internet of things . . . 5
1.3 Purpose of the study . . . 8
1.4 Research rationale . . . 8
1.5 Educational advantages . . . 8
1.6 Main contribution of the studies . . . 9
1.6.1 Cloud brokering systems for connected Internet of things . . . 9
1.6.2 KD-partitioning for the local outlier detection . . . 9
1.6.3 Operation management for multi-microgrids control . . . 9
1.7 Scope of the studies . . . 10
1.7.1 Cloud brokering systems for connected Internet of things . . . 10
1.7.2 KD-partitioning for the local outlier detection . . . 10
1.7.3 Operation management for multi-microgrids control . . . 11
1.8 Research methodology . . . 11
2 Principles and Theories of the Study 13 2.1 Cloud Brokering Systems for Connected Internet of Things . . . 13
2.2 Operation Management for Micro-grids Control . . . 17
2.3 The partitioning for Local Outlier Detection in Geo-Social Media . . . 18
2.4 Particle Swarm Optimization . . . 19
x Table of contents
2.5.1 An initialize process . . . 23
2.5.2 Selection process . . . 23
2.5.3 Genetic operations process . . . 28
2.5.4 Population selection process . . . 28
2.6 Literature Review . . . 28
2.6.1 Optimization in Cloud Computing . . . 28
2.6.2 The Local Outlier Detection in Geo-Social Points . . . 32
2.6.3 Optimization in Micro-grids . . . 34
3 Cloud Brokering Systems for Connected Internet of Things 37 3.1 Cloud Brokering System . . . 37
3.2 Single-Objective Optimization Problem . . . 39
3.3 Multi-objective Optimization Problem . . . 40
3.4 Multi-Objective Particle Swarm Optimization for Cloud Brokering Problem 41 3.5 Computational Complexity of MOPSO . . . 43
3.6 Simulation Configuration and Results of MOPSO . . . 43
3.6.1 Simulation Configuration . . . 43
3.6.2 Simulation Results . . . 44
3.7 Conclusion . . . 51
4 The Local Outlier Detection in Geo-Social Points 53 4.1 Problem Statement . . . 53
4.2 Optimization Problem for Micro-grid . . . 57
4.3 Genetic Optimization Process . . . 57
4.4 Computational Complexity of MOGA . . . 59
4.5 Simulation Configuration and Results of MOGA . . . 59
4.5.1 Simulation Configuration . . . 59
4.5.2 Simulation Results . . . 60
4.6 Conclusion . . . 62
5 Operation Management for Multi-Micro-Grids Control 69 5.1 Operation Management for Micro-grids System . . . 69
5.2 Problem Statement . . . 71
5.2.1 Objective Functions . . . 71
5.2.2 Constraints . . . 73
5.3 Single-Objective Optimization Problem for Micro-grid . . . 75
Table of contents xi
5.5 Multi-objective Particle Swarm Optimization . . . 77
5.6 Modified Game . . . 78
5.7 Fitness-based Modified Game Particle Swarm Optimization . . . 79
5.8 Computational Complexity of FMGPSO . . . 80
5.9 Simulation Configuration and Results of FMGPSO . . . 80
5.9.1 Simulation Configuration . . . 80
5.9.2 Simulation Results . . . 83
5.10 Conclusion . . . 90
6 Conclusions and Future Directions 101 6.1 Cloud Brokering System . . . 101
6.2 Local Outlier Detection in Geo-social Media . . . 102
6.3 Multi-micro-grids System . . . 102
List of figures
1.1 An example of the Internet of things . . . 2
1.2 The future of the Internet of things (Source: http://visual.ly/future-internet-things) . . . 2
1.3 The architecture of an IoT [37] . . . 3
1.4 Increasing the number of data in the future [54] . . . 5
1.5 Increasing electric consumption and emission levels in the future (Source: U.S. Energy Information Administration, International Energy Outlook 2016) 6 1.6 Micro-grid . . . 6
2.1 Internet of Things: Things can be connected and communicated with each other via wireless technologies. Big data and cloud computing will play important roles in terms of analysis and data storage. . . 14
2.2 Cloud Computing Architecture . . . 16
2.3 An example of situation in geo-social points . . . 20
2.4 The basic idea of a flock of birds . . . 21
2.5 Example of position updates and velocity in particle swarm optimization . . 23
2.6 Genetic Optimization Process . . . 24
2.7 Multi-objective Genetic Algorithm . . . 25
2.8 An example of calculating constraint-dominance fitness . . . 26
2.9 An example of calculating constraint-dominance fitness . . . 27
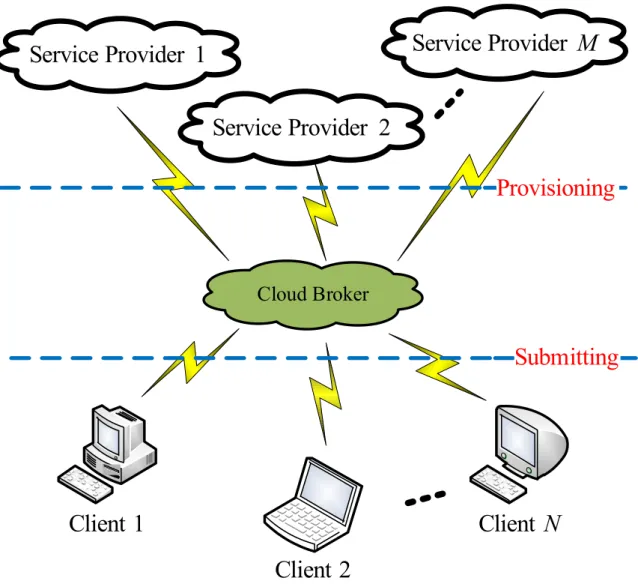
3.1 Cloud Brokering Model. The model consists of N clients, M cloud service providers and one cloud broker. . . 38
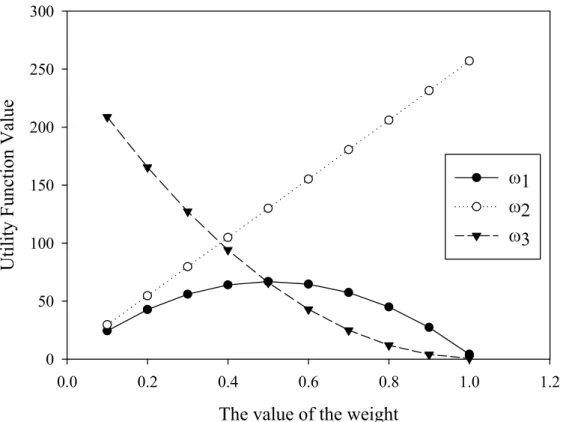
3.2 The utility function value of each weight value . . . 45
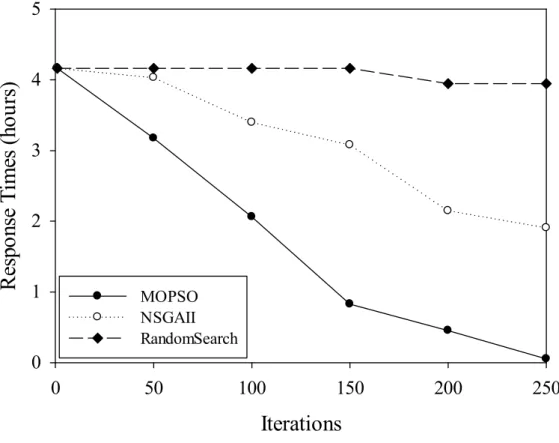
3.3 The minimum response time at the end of each iteration . . . 46
3.4 The minimum energy consumption at the end of each iteration . . . 47
3.5 The maximum profit of the cloud broker at the end of each iteration . . . . 48
xiv List of figures
3.7 The minimum energy consumption in case of 500 max iterations . . . 50
3.8 The maximum profit of the cloud broker in case of 500 max iterations . . . 51
4.1 An example of partitioning in geo-social points . . . 54
4.2 TF-IDF based on the two-dimensional grid partitioning . . . 55
4.3 2-dimensional pattern example . . . 56
4.4 The structure of an individual . . . 58
4.5 Mutation operator example . . . 58
4.6 Crossover operator example . . . 63
4.7 1% of Hiroshima . . . 64
4.8 5% of Hiroshima . . . 65
4.9 10% of Hiroshima . . . 66
4.10 The number of H-patterns . . . 66
4.11 The number of L-patterns . . . 67
4.12 The number of H-patterns in case of 500 max generations . . . 67
4.13 The number of L-patterns in case of 500 max generations . . . 68
5.1 A typical micro grid test system . . . 70
5.2 A multi micro grid test system (four MGs) . . . 82
5.3 Utility function value of each weight value of the MG system with BES . . 85
5.4 Utility function value of each weight value of the MG system without BES . 86 5.5 The total operation cost of the MG system with BES at the end of each iteration 88 5.6 The total emission of the MG system with BES at the end of each iteration . 89 5.7 The total operation cost of the MG system with BES in case of 600 max iterations . . . 90
5.8 The total emission of the MG system with BES in case of 600 max iterations 91 5.9 The total operation cost of the MG system without BES at the end of each iteration . . . 94
5.10 The total emission of the MG system without BES at the end of each iteration 95 5.11 The total operation cost of the MG system without BES in case of 600 max iterations . . . 96
5.12 The total emission of the MG system without BES in case of 600 max iterations 97 5.13 The total operation cost of the multi-MG system at the end of each iteration 98 5.14 The total emission of the multi-MG system at the end of each iteration . . . 99
List of tables
2.1 Optimization in cloud brokering . . . 31
2.2 Approaches to outlier detection . . . 33
2.3 Optimization in Micro-grids . . . 35
3.1 Parameters for Cloud Brokering System . . . 43
3.2 The Simulation Configurations . . . 44
3.3 C -metric . . . 52
4.1 The size of an individual . . . 60
4.2 C -metric . . . 60
5.1 Minimum and maximum power and bid cost of units in micro-grid system . 81 5.2 MO and start-up/shut-down cost of units in micro-grid system . . . 81
5.3 Emissions of the DG sources . . . 82
5.4 Minimum and maximum power and bid cost of units in multi-micro-grids system . . . 83
5.5 MO and start-up/shut-down cost of units in multi-micro-grids system . . . . 84
5.6 Comparison of operation cost ($) and simulation time of 30 runs in case of the MG system with BES . . . 87
5.7 Comparison of emissions (kg/MWh) in case of the MG system with BES . 87 5.8 Status of the units in the MG system with BES by FMGPSO (Total cost = 396.10 and Emission = 1396.15 kg/MWh) . . . 92
5.9 Optimal output power of the units in the MG system with BES by FMGPSO (Total cost = 396.10 and Emission = 1396.15 kg/MWh) . . . 93
5.10 Comparison of operation cost ($) and simulation time of 30 runs in case of the MG system without BES . . . 93
5.11 Comparison of emissions (kg/MWh) in case of the MG system without BES 94 5.12 Comparison of operation cost ($) of 30 simulation runs . . . 95
Nomenclature
Roman Symbols
AT the arrival time of a request from client i at service provider j CT the current time
E the total energy consumption of all the service providers IR the interest rate of the installed BES
k the dimension of the particles l the number of particles
LT the lifetime of the installed BES M the number of cloud service providers N the number of clients
n the number of neighbors including the target cell ORt an operating reserve requirements at time t P the profit of the cloud broker
RT the response time
S the set of cloud service providers U the set of clients
w an inertia weight Greek Symbols
xviii Nomenclature
α the significance level C − metric a performance metric ∆t a time interval duration
ηdischarge a discharge efficiency of BES
µ0 the mean value of the normal distribution ω1, ω2, ω3 the weighting factors
σ the standard deviation of the local importance scores Subscripts
i subscript index j subscript index Other Symbols
PBES,t a maximum discharge rates of BES at time t PBES,t a maximum BES charge rates of BES at time t BBES,t a bid of BES at time t
BFC,t a bid of FC at time t BGrid,t a bid of utility at time t bi j a binary variable BMT,t a bid of MT at time t BPV,t a bid of PV at time t BW T,t a bid of WT at time t
Cj the cost of service provider j CBES,max a maximum size of BES CBES,min a minimum size of BES CBES,t the cost of BES at time t
Nomenclature xix
CDG,t the cost of operating power and fuel of DGs at time t CGrid,t the cost of grid at time t
CO2,BES,t the amounts of carbon dioxide from BES at time t CO2,DGi,t the amounts of carbon dioxide from MT and FC at time t CO2,Grid,t the amounts of carbon dioxide from utility at time t
Ej the energy consumption that service provider j used to execute the job EBES,ts the emission of BES
EDG,ts the emission of DG EGrid,ts the emission of utility
ft the total costs of DG FCBES a fixed cost for BES
Li j the latency between client i and service provider j MCBES a maintenance cost for BES
MODG the fixed maintenance and operation cost of DG MOFC the fixed maintenance and operation cost of FC MOMT the fixed maintenance and operation cost of MT MOPV the fixed maintenance and operation cost of PV MOW T the fixed maintenance and operation cost of WT NOx,BES,t the amounts of nitrogen oxides from BES at time t NOx,DGi,t the amounts of nitrogen oxides from MT and FC at time t NOx,Grid,t the amounts of nitrogen oxides from utility at time t OT H an operation time
x the average of local importance scores of queen contiguity neighbors P(X ) a Pareto optimal objective
xx Nomenclature
Pi the price from client i PBES,t a power of BES at time t
PDemand,t a load demand of electrical at time t PFC,t a power of FC at time t
PGrid,t a power of utility at time t
Pj,max the maximum power of MT, PV, FC and WT Pj,min the minimum power of MT, PV, FC and WT PMT,t a power of MT at time t
PPV,t a power of PV at time t PW T,t a power of WT at time t
PM10,BES,t the amounts of particulate matter 10 micrometers from BES at time t PM10,DGi,t the amounts of particulate matter 10 micrometers from MT and FC at time t PM10,Grid,t the amounts of particulate matter 10 micrometers from utility at time t Ri the number of requests from client i
S(X ) a supercriterion
SDFC,t the shut-down cost for FC at time t SDMT,t the shut-down cost for MT at time t
Shi a shutdown cost coefficient for FC and MT at time t SO2,BES,t the amounts of sulphur dioxide from BES at time t SO2,DGi,t the amounts of sulphur dioxide from MT and FC at time t SO2,Grid,t the amounts of sulphur dioxide from utility at time t Sti a start-up cost coefficient for FC and MT at time t SUFC,t the start-up cost for FC at time t
Nomenclature xxi
Tj a spend time to execute the request tax a tax rate of grid
TCPDBES the Total Cost Per Day of BES uBES,t a status (off or on) of BES at time t uFC,t a status (off or on) of FC at time t uMT,t a status (off or on) of MT at time t
c1 a coefficient of the self-recognition component c2 a coefficient of the social component
⃗
gl the best position of the swarm ⃗pl the best position of the particle
r1, r2 random numbers that are uniformly distributed in the interval 0 to 1 ⃗vl a velocity vector
⃗xl a position vector Acronyms / Abbreviations ACO Ant Colony Optimization BES Battery Energy Storage BLE Bluetooth Low Energy CC Cloud Computing CO2 Carbon Dioxide D2D Device-to-Device
DGs Distributed Generation Sources DVFS Dynamic Voltage Frequency Scaling EA Evolutionary Algorithm
xxii Nomenclature
FiWi Fiber-Wireless
FMGPSO Fitness-Based Modified Game Particle Swarm Optimization GA Genetic Algorithm
GGA Grouping Genetic Algorithm HMM Hidden Markov Model IaaS Infrastructure as a Service IoT Internet of Things
lat latitude lon longitude
MANETs Mobile Ad-hoc NETworks MGCC Micro-Grid Central Controller MG Micro-Grid
MLIP Mixed Linear Integer Problem MOGA Multi-Objective Genetic Algorithm
MOPSO Multi-Objective Particle Swarm Optimization MT Micro-Turbine
NOx Nitrogen Oxides
NSGA Non-dominated Sorting Genetic Algorithm OMMG Operation Management of Micro-Grid OPC One-Point Crossover
PaaS Platform as a Service
PM10 Particulate Matter 10 micrometers PSO Particle Swarm Optimization PV Photo-Voltaic
Nomenclature xxiii
QoS Quality of Service RBA Rank-Based Allocation RESs Renewable Energy Sources RFID Radio-Frequency Identification SaaS Software as a Service
SAPSO Self-Adaptive Particle Swarm Optimization SO2 Sulphur Dioxide
tf-idf Term Frequency–Inverse Document Frequency VMs Virtual Machines
WSNs Wireless Sensor Networks WT Wind Turbine
Chapter 1
Introduction
1.1
Background and motivation
Internet of Things (IoT) is a system of interrelated computing devices, mechanical and digital machines, objects, animals or people that are provided with unique identifiers and the ability to transfer data over an Internet technology. In the other word, it is an Internet technology that connects humans, machines, and tools with each other via the Internet or wireless technologies as shown in figure 1.1. On the other hand, IoT is complex environments including many heterogeneous devices, application, and components. In the real world, the large number of things connected and data generated by those things in IoT will define a great require in term of processing and storage resources to be changed into useful services, systems and information. Some services, applications, or systems will require complex processing which include an analysis in time series and history of data. Therefore, it is very difficult when to consider IoT’s typical resource constraints to imagine ultra-scale real-world of IoT without including a cloud computing platforms or a smart devices/systems such as Smart Gateways [1], edge/fog nodes [31] and so on. Moreover, figure 1.2 shows the future of the Internet of things. The figure shows that there are 8 billion devices in use by 2014. In the future, there will be 10 connected objects for every man, woman, and child on the planet. It means there will be as many as 40 to 80 billion connected objects by 2020. Thus, a lot of data will be generated in the future because the number of things is rapidly increasing. Therefore, a resource management or resource optimization is important to make a powerful IoT. The resource management or optimization is a set of processes or methods which is used to adjust the available resources (devices, applications, systems and so on) and the planned resources to achieve established goals. Optimization is desired to achieve objectives and constraints within expected time and minimum resources usage. Therefore, the resource optimization is considered to manage connected things and analyze generated data in IoT.
2 Introduction Home Factory IP Network Hospital City Plane Transport
Fig. 1.1 An example of the Internet of things
Fig. 1.2 The future of the Internet of things (Source: http://visual.ly/future-internet-things)
1.1 Background and motivation 3
The architecture of IoT could be classified into three-layer architecture as shown in figure 1.3. The three-layer consist of application as a top layer, network layer as a middle layer and sensing layer as a bottom layer. The application layer represents many applications such as environment prediction & protection, intelligent transport, smart grid & micro-grid and so on. Next, the sensing layer consists of various types of sensing devices or sensors, such as, RFID, ZigBee, GPS and so on. Each sensing devices or sensor collects sensing data around its location. Then, the sensing device transmits the sensing data to the applications through the cloud computing platforms at the network layer. From the architecture of IoT, It can see that the cloud computing is an important part of IoT. Therefore, cloud computing is considered as an important roles in terms of analysis and data storage in IoT.
Cloud
Computing
Platform
The Internet
Information
Network
Mobile Telecom
Network
Environment prediction
& protection Intelligent Search Intelligent Traffic medicineTele- Smart Grid & Microgrid
RFID RFID label Sensor Network Sensor Nodes GPS Road Navigators Sensing Layer Network Layer Application Layer
Fig. 1.3 The architecture of an IoT [37]
In general, cloud computing is a delivery of a computing services to clients on demand. Moreover, the service of cloud computing can be classified into three categories as follows: Software as a Service (SaaS), Platform as a Service (PaaS) and Infrastructure as a Service (IaaS). To handle connected things, Infrastructure as a Service (IaaS) is considered. In IaaS, organizations can outsource support operations, including hardware, storage, servers, and networks. Cloud service providers will own equipment, work responsibilities, and maintenance by clients, who have the option to pay for actual usage. An infrastructure should
4 Introduction
be developed for supporting and managing the connected things. Therefore, an intermediary of IaaS in cloud computing is utilized to manage a huge number of things and data that are connected in IoT. A cloud broker is considered as an intermediary in the infrastructure for managing the connected things. The cloud broker will find the best deal between clients and service providers. However, the response time of the request from clients, the energy consumption of the system and the profit of the cloud broker are important problems among cloud broker, clients and service providers. Because cloud broker is expected the profit to manage the process between clients and service providers, clients also are expected the speed to execute their request, and service providers are expected to minimize energy consumption in the system.
Moreover, as mentioned about a lot of data will be generated in the future because the number of things is rapidly increasing, the data include social media and geographic location such as Tweet, Facebook, Instagram and so on. Figure 1.4 shows the information of increasing the number of data in the future. Coupling social media with geographic location has boosted the worth of understanding the real-world situations. It means that we could be analyzed those data to capture and predict real-world situations in emergency management. Thus, social media and geographic location data raise the need for the enhanced spatio-temporal data analysis to automatically discover potentially useful patterns and knowledge. Moreover, sometimes identification of unusual and seemingly inconsistent patterns in data is necessary. These pattern called outliers. It may represent some useful information about abnormal situations in many applications such as credit card fraud detection, clinical trials, voting irregularity analysis, data cleansing, network intrusion, severe weather prediction, geographic information systems, athlete performance analysis, and other data-mining tasks. However, there are many outliers’ definitions. The easy way is that an outlier of a keyword in geo-social media has a different pattern of the local importance measures with respect to the surrounding neighbors. It means geo-social media data are divided into sub-space and find a pattern outlier from sub-space. However, a different result could get depending on the size and way of sub-space partitioning. Thus, the problem is how to partition geo-social media data into sub-space while maximizing the number of outlier patterns.
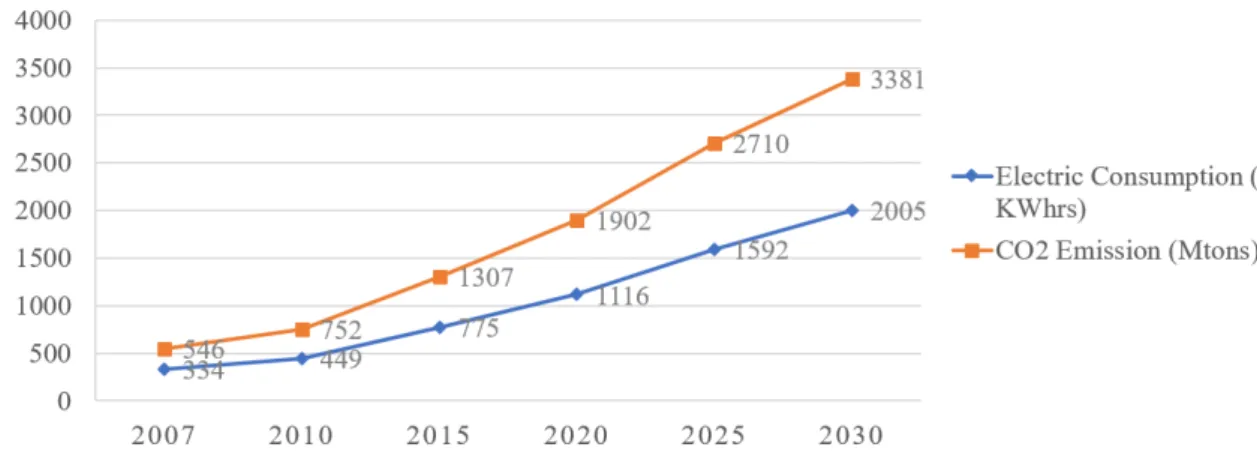
Finally, since there will be a steady increase in energy consumption as well as emission levels from using energy in IoT as shown in figure 1.5. It needs some system or application to manage the energy consumption and emission pollutant in IoT. Therefore, a micro-grid is considered to manage the energy consumption and emission pollutant, because the micro-grids are a part of a larger system that could be made reality smart grid that is strongly related to IoT technologies. Moreover, the smart grid is enabled by IoT to reduce the number of communication protocols and handle big data. The micro-grid also is able to manage
1.2 Statement and significance of resource optimization for connected Internet of things 5
Fig. 1.4 Increasing the number of data in the future [54]
energy consumption in IoT to reduce the emission pollutant in the system. The micro-grid is an electricity distribution systems containing loads and distributed generation sources (DGs), such as fuel cell (FC), micro-turbine (MT), photovoltaic (PV), and wind turbine (WT), including the energy storage options operating system (battery energy storage (BES)). Figure 1.6 shows an example of the micro-grid system. Since there are many units in the micro-grid system, it is difficult to manage operations in the system with minimum cost and energy. Moreover, some pollutant emissions such as CO2, NOx, SO2and PM − 10, are produced by some units in the micro-grid system. Therefore, the problem in the micro-grid system is how to manage operations while minimizing the pollutant emissions and the total operating cost.
1.2
Statement and significance of resource optimization for
connected Internet of things
Recently, there are more than 9 billion things that connected in the Internet of Things (IoT) and the number is exceed more than 24 billion in 2020. It means that numerous data will be generated because of increasing quickly of the number of things. An infrastructure should be
6 Introduction
Fig. 1.5 Increasing electric consumption and emission levels in the future
(Source: U.S. Energy Information Administration, International Energy Outlook 2016)
Controls
Fuel cell
Battery
Utility
Photo-voltaic
Wind turbine
NO
x
CO
2
SO
2
PM-10
Fig. 1.6 Micro-grid1.2 Statement and significance of resource optimization for connected Internet of things 7
developed to manage the connected things in IoT. A cloud broker is used as the intermediary to optimize resource selection in cloud computing. The requests from clients are matched by the cloud broker with offers provided by the service providers. In a sense, when the cloud broker find the best deal between the request from client and the cloud service provider, the cloud broker is expected the maximum profit. On the other hand, the cloud service providers are expected to execute the request from client with the minimum energy consumption. Moreover, when the clients submit their requests to cloud broker, they are expected with the minimum response time. Since the scheduling problem has been proven as an NP-hard problem [32], it can conclude that the cloud brokering problem is NP-hard problem.
Since, there are a lot of data including social media and geographic location, generated in IoT. Coupling social media with geographic location has boosted the worth of understanding the real-world situations. Many Twitter messages were concentrated in the path of Hurricane Sandy as presented in [70]. The tweets and flooding had a similar pattern of the path. Therefore, those messages reflected human experiences of the storm and the local information can be obtained by analysis those messages. There are many tools and techniques of spatio-temporal data mining, such as outlier detection, spatio-spatio-temporal clustering, co-occurrence pattern discovery and hotspot detection [69]. In particular, unusual and seemingly inconsistent patterns in data, called outliers. Sometimes the outliers represent useful information about abnormal situations in many applications.
One way to detection outlier is that a spatio-temporal domain is divided into several small areas and measure the keyword importance of each area. A different pattern of the local importance measures with respect to the surrounding neighbors is assumed as a spatio-temporal outlier of a keyword in geo-social media. However, different results are found depending on the way and size of sub-space partitioning. Moreover, the optimal partitioning problem in a spatio-temporal domain has been proven as an NP-complete problem [48].
Moreover, since there will be a steady increase in energy consumption as well as emission levels from using energy in IoT. It needs some system or application to manage the energy consumption and emission pollutant in IoT. The micro-grid is studied to manage the energy consumption as well as emission pollutant in IoT because of micro-grids are part of a larger system that makes the smart grid to become reality and the smart grid which is enabled by IoT to handle big data, is strongly related to IoT technologies. The micro-grid also is able to manage energy consumption in IoT to reduce the emission pollutant in the system. In the micro-grid system, renewable energy sources poses a challenge in term of the fluctuation and irregularly of the units. This is the reason why the battery energy storage (BES) should be developed to increase the high availability time. The BES can be developed by the micro-grid central controller (MGCC) in the micro-grid system. However, the capacity and/or size of
8 Introduction
BES is an important issue in the operation management problem in the micro-grid system. Therefore, the operation management problem is important problem in the micro-grid system. Moreover, some units in the micro-grid system produced some pollutant emissions such as CO2, NOx, SO2and PM − 10. Therefore, it is important to consider reducing the pollutant emissions and the total operating cost in the operation management problem in the micro-grid system. Moreover, the scheduling problem has been proven as an NP-hard problem [32], it can conclude that the operation management problem in the micro-grid is NP-hard problem.
1.3
Purpose of the study
1. To investigate a cloud brokering system for connected IoT system with considering the difficulty issues.
2. To investigate an operation management for an micro-grid system with considering operation cost and pollutant emissions.
3. To investigate an optimal solution of partitioning for finding patterns in geo-social points.
1.4
Research rationale
A novel optimization problem is formulated for solving a problem among of clients, service providers, and cloud broker. This aims to help manage connections in a cloud IoT system. Next, a novel algorithm for operation management in a multi-micro-grids system is proposed. This aims to help control cost and pollutant emissions in the system. Finally, a k-dimensional tree is applied to divide a spatio-temporal domain of geo-social media for finding patterns. This aims to help us to know a situation in the interested area.
1.5
Educational advantages
1. To obtain a cloud brokering system for connected IoT system and an algorithm for solving an optimization problem in the cloud brokering system.
2. To obtain a partitioning for finding patterns in geo-social points and an algorithm for finding the optimal solution of partitioning.
3. To obtain an operation management for a multi-micro-grids system and a novel algo-rithm for solving an optimization problem of the multi-micro-grids system.
1.6 Main contribution of the studies 9
1.6
Main contribution of the studies
1.6.1
Cloud brokering systems for connected Internet of things
1. A cloud brokering problem in a cloud IoT system is investigated by considering the energy consumption, broker profit, and response time.
2. A novel optimization problem is formulated to maximize the broker profit and to minimize the energy consumption of the system and response time of clients.
3. Particle swarm optimization (PSO) is proposed to solve the formulated problem as a single-objective optimization problem. Moreover, multi-objective particle swarm optimization (MOPSO) is designed to solve the formulated problem as a multi-objective optimization problem.
4. MOPSO is proposed to solve the multi-objective optimization problem by using exten-sive simulations. Moreover, there are three algorithms to compare the performance: MOPSO, a well-known genetic algorithm and a random search algorithm.
1.6.2
KD-partitioning for the local outlier detection
1. A k-dimensional (KD) tree is applied to divide a spatio-temporal domain into sub-cells. 2. Two outlier patterns of a keyword are formulated by the local importance measures
among the surrounding sub-cells.
3. The optimal solution of partitioning are investigated to maximize the number of two outlier patterns.
4. Genetic algorithm (GA) is proposed to seek the optimal solution of KD-tree partitioning while maximizing the number of outlier patterns by using extensive simulations.
1.6.3
Operation management for multi-microgrids control
1. An optimization operation management problem in an micro-grid system is investigated by considering the total cost of distributed generation sources, the maintenance and operation cost of fuel cell, micro-turbine, photovoltaic, and wind turbine, and the total battery energy storage cost per day and the pollutant emissions.
10 Introduction
2. A cost function, an emission function, and constraints are formulated to minimize total cost and pollutant emissions in operation management problem as a single-objective and multi-objective optimization problem, respectively.
3. Fitness-based modified game particle swarm optimization (FMGPSO) is designed and proposed to solve the formulated cost, emission function, and constraints by using extensive simulations. Moreover, there are four algorithms to compare the performance: FMGPSO, A non-dominated sorting genetic algorithm-III (NSGA-III), multi-objective covariance matrix adaptation evolution strategy (MO-CMAES), and speed-constrained multi-objective particle swarm optimization (SMPSO).
1.7
Scope of the studies
1.7.1
Cloud brokering systems for connected Internet of things
1. The Cloud brokering system will be implemented and tested in a simulator. 2. The simulation configuration
(a) The simulated system is used to find the best deals between 7 service providers and 5 clients.
(b) The simulated system is used to find the best deals with the maximum profit for the cloud broker and minimum response time and minimum energy consumption of the cloud.
(c) There are 3 types of instance: small, large and extra-large.
(d) The average execution time and instance prices depend on the instance type.
1.7.2
KD-partitioning for the local outlier detection
1. The KD-partitioning for the local outlier detection in geo-social media will be imple-mented and tested in a simulator.
2. The simulation configuration
(a) The number of the sample data is 33,030. Each data consists of geographical coordinates and timestamps.
(b) A k-dimensional (KD) tree is applied to divide a spatio-temporal domain in to sub-cells.
1.8 Research methodology 11
(c) A term frequency-inverse document frequency (t f − id f ) values of keyword ’landslide’ in each tweet is calculated.
(d) A normal distribution test is applied to find the optimal number of patterns. (e) Two-tailed normal distribution with α is considered by 0.05.
1.7.3
Operation management for multi-microgrids control
1. The multi-microgrids control system will be implemented and tested in a simulator. 2. The simulation configuration
(a) The micro-grid test system consists of the PV, WT, MT, FC and BES. There are 2 cases: the micro-grid system with BES and without the BES.
(b) The multi-micro-grid test system consists of 4 micro-grids. Each micro-grid consists of different DGs.
(c) There are limitation of productions and coefficients of each DG.
1.8
Research methodology
1. Define the formal definition of the systems, and formulate optimization problems 2. Study and review related theories and literature
3. Design an efficient optimization algorithms for the research problems 4. Test and discuss the performance of algorithms
5. Conclude the experiment result and error correction
Chapter 2
Principles and Theories of the Study
This chapter describes some principles that will be used in this study. The chapter starts with introducing the fundamental concepts of cloud brokering systems for connected Internet of Things, operation management for micro-grids control and outlier detection in geo-social media, respectively. Then, the multi-objective optimization techniques are presented. Finally, the literature review is presented.
2.1
Cloud Brokering Systems for Connected Internet of
Things
This section starts with introducing the fundamental concepts of an Internet of things and cloud brokering systems for connected Internet of things, respectively. Recently, there are many humans, machines and tools that can connect with each other via the wireless and/or Internet technologies such as Bluetooth Low Energy (BLE), Wi-Fi, ZigBee and Radio-Frequency Identification (RFID) as shown in figure 2.1. The Internet technology is called IoT. In 2011, the number of data and things that connected in IoT outnumber the number of population in the world. There are more than 9 billion thins that connected in currently and it could be exceed more then 24 billion by 2020 [33]. It means there are a lot of data that will be generated in the future. Therefore, it is very difficult to handle analysis and data storage problem. Cloud computing and big data will play important roles to those problems. However, only cloud computing is considered in this study.
.
Cloud computing or CC is a service delivered based on visualization technologies through data centers. Cloud computing delivers a service to clients on demand [14]. It means software, systems, and computing resources of the cloud service provider can be used by the clients
14 Principles and Theories of the Study
Machine
Person
Person
Machine
Way to Connect
Wireless
Technologies
Wi-Fi, RFID, BLE,
ZigBee
Analysis and Data
Storage
Big Data
&
Cloud Computing
Fig. 2.1 Internet of Things: Things can be connected and communicated with each other via wireless technologies. Big data and cloud computing will play important roles in terms of analysis and data storage.
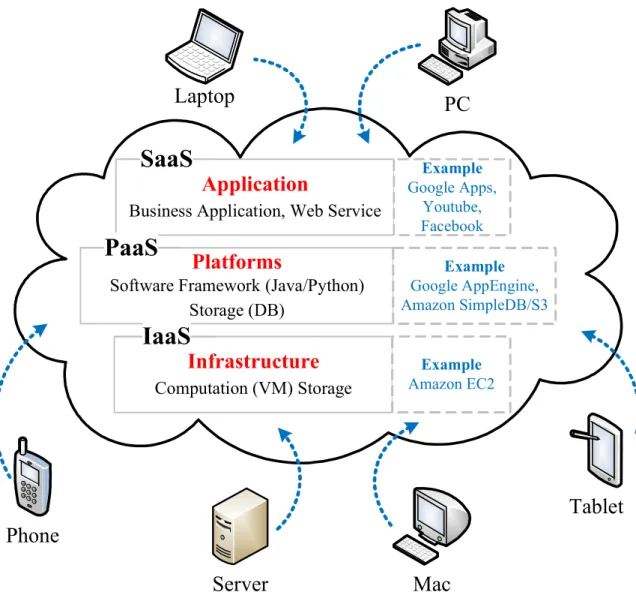
through the Internet anytime and anywhere. Additional, a mobile device (e.g., smart-phone and tablet) of some clients can be detected and used the computing resources on other mobile devices through D2D (device-to-device) communication [53]. Figure 2.2 shows the cloud computing architecture. In general, the service of cloud computing can be classified into three categories as follows:
1. The first service is Software as a Service (SaaS). In this service, clients can run software through the Internet without installing and maintaining the software.
2. The second service is Platform as a Service (PaaS). This service is to provide a platform allowing clients to develop, run, and manage applications visualization servers.
2.1 Cloud Brokering Systems for Connected Internet of Things 15
3. The third service is Infrastructure as a Service (IaaS). In this service, organizations can outsource support operations, including hardware, storage, servers, and networks. Cloud service providers will own equipment, work responsibilities, and maintenance by clients, who have the option to pay by actual usage.
Since, in the future, IoT will be a challenge by huge connected things and data on the Internet. An infrastructure is needed to develop for supporting and managing the connected things’ quantity. Therefore, an intermediary of IaaS in cloud computing is utilized to manage a huge number of things and data that are connected in IoT. Because sometimes clients can be submitted their request to the cloud service providers through the intermediary. The intermediary resides between the cloud service providers and clients. Thus, a cloud broker is used as the intermediary to optimize resource selection in cloud computing. The requests from clients are matched by the cloud broker with offers provided by the service providers. In a sense, when the cloud broker find the best deal between the request from client and the cloud service provider, the cloud broker is expected the maximum profit. On the other hand, the cloud service providers are expected to execute the request from client with the minimum energy consumption. Moreover, when the clients submit their requests to cloud broker, they are expected with the minimum response time. Therefore, how to maximize the profit of the cloud broker and minimize the total energy consumption in cloud computing and the response time of requests from clients is considered in this study.
Since the scheduling problem has been proven as an NP-hard problem [32], it can con-clude that the cloud brokering problem is NP-hard problem. The NP problem can be solved by using a meta-heuristic algorithm (evolutionary algorithm). Moreover, Several studies focused on meta-heuristic algorithm and cloud brokering in cloud computing [43, 71, 39]. The optimization problem of the energy consumption, CO2 emissions, and deployment cost in cloud computing is studied in [43]. A greedy heuristic algorithm and a multi-objective genetic algorithm were proposed to solve the problem. A parallel hybrid evolutionary algo-rithm (EA) was proposed in [39] to maximize the broker profit of virtual machine subletting in cloud computing. The veritable data from the cloud providers used for comparison be-tween the proposed EA and a greedy heuristic algorithm. Moreover, a novel framework was proposed in [71], called CLOUD Resource Broker. A particle swarm optimization-based resource allocation scheme and a deadline-based job scheduling were integrated into the proposed framework. However, neither method solved the profit of the cloud broker, the energy consumption in cloud computing and/or the response time of requests from clients simultaneously. Moreover, almost the proposed algorithm are based on a genetic algorithm. The genetic algorithm converges slowly and has a high complexity than a particle swarm optimization (PSO) scheme. Thus, the formulating, designing and developing the PSO for
16 Principles and Theories of the Study
Application
Business Application, Web Service
Platforms
Software Framework (Java/Python) Storage (DB)
Infrastructure
Computation (VM) Storage Example Google Apps, Youtube, Facebook Example Google AppEngine, Amazon SimpleDB/S3 Example Amazon EC2SaaS
PaaS
IaaS
Laptop
PC
Tablet
Mac
Server
Phone
Fig. 2.2 Cloud Computing Architecture
the cloud brokering system are the main motivations. The PSO is used to increase the profit of the cloud broker and reduce the total energy consumption in cloud computing and the response time of requests from clients.
Therefore, a cloud brokering problem is considered as a multi-objective optimization problem with three objectives: (1) maximizing the profit of the broker, (2) minimizing the energy consumption in cloud computing, and (3) minimizing the response time of requests from clients. Moreover, a multi-objective particle swarm optimization (MOPSO) scheme is used to seek the optimal solutions set (Pareto-set) for the cloud brokering problem.
2.2 Operation Management for Micro-grids Control 17
2.2
Operation Management for Micro-grids Control
This section starts with introducing the fundamental concepts of micro-grid and operation management for micro-grids control, respectively. Micro-grid is an electricity distribution systems containing loads and distributed generation sources (DGs) including the energy storage options operating system (a single system provides both of heat and power) that can be operated in a controlled, coordinated way either while connected to the main power network. Distributed generation sources are renewable resources such as the solar energy system and wind energy system. To raise energy crisis and centralize modern power grids, small-scale distributed generation sources and renewable energy sources (RESs) are combined with micro-grid [75]. Renewable energy sources in the micro-grid system in recently poses a challenge in whereby the fluctuation and irregularly of the units, i.e., wind turbine and photo-voltaic units. Thus, the battery energy storage (BES) should be developed to increase the high availability time. The BES can be developed by the micro-grid central controller (MGCC) in the micro-grid system. However, the capacity and/or size of BES is an important issue in the operation management problem in the micro-grid system. Moreover, some units in the micro-grid system produced some pollutant emissions such as CO2, NOx, SO2 and PM− 10. Therefore, it is important to consider reducing the pollutant emissions and the total operating cost in the operation management problem in the micro-grid system.
Several studies focused on the minimization operation management problem of the micro-grid system. There are some studies that consider the problem with the size and/or capacity of BES. For example, the authors in [18] proposed a mixed linear integer problem (MLIP) which is a solver in a modeling language for mathematical programming (AMPL) that considers the cost-benefit analysis, to optimize the size and/or capacity of an energy storage system in the micro-grid system. The optimizing the size and/or capacity of BES and the minimizing total operation cost of the micro-grid system problem were considered in [8]. An improved bat algorithm was proposed to solve the problems. Moreover, a novel software was proposed in [5], called a PSCAD/EMTDC software. The size of BES in the micro-grid system is optimized by using the proposed software.
Otherwise, there are some studies that not consider the problem with the size and/or capacity of BES. For example, in [15], the authors proposed linear programming for mini-mizing the operation management in the micro-grid system with optimini-mizing the state of a charger of BES. A mathematical model based on linear programming and multi-agent system for the micro-grid operation was proposed in [44]. In [35], the authors proposed particle swarm optimization scheme to optimize the operation of a typical micro-grid interconnected with the main grid. The system included a local load, wind power, hydro-power and storage devices.
18 Principles and Theories of the Study
Therefore, the operation management problem is considered as an optimization problem. The objectives of the problem are to minimize the total cost of DGs, operation cost of a fuel cell (FC), micro-turbine (MT), photovoltaic (PV) and wind turbine (WT) and the total BES cost per day as well as the pollutant emissions. Then, a fitness-based modified game particle swarm optimization (FMGPSO) scheme is proposed to find the optimal solutions set for the operation management problem. FMGPSO is an integration of game theory and PSO, because of both game theory and PSO can be used to solve both single-objective optimization problem and multi-objective optimization problem.
2.3
The partitioning for Local Outlier Detection in
Geo-Social Media
This section starts with introducing the fundamental concepts of geo-social media and the local outlier detection in geo-social media, respectively. Geo-tagged social media (in short, geo-social media) are pieces of information that can be attached to a photo, status or tweet with the physical location on a social networking site. Recently, the analysis of geo-social media is being emphasized to capture real-world situations in emergency management as well as to predict real-world situation. For example, the Hurricanes in the USA (Sandy and Katrina) and Haiti (Fay, Gustav, Hannah, and Ike), and the Tsunami and earthquake in Japan. These examples can be used as evidence. Moreover, many Twitter messages were concentrated in the path of Hurricane Sandy as presented in [70]. The tweets and flooding had a similar pattern of the path. Therefore, those messages reflected human experiences of the storm and the local information can be obtained by analysis those messages. Working with geo-location data in social media raises the need for the enhanced spatio-temporal data analysis to automatically discover potentially useful patterns and knowledge.
There are many tools and techniques of spatio-temporal data mining, such as outlier detection, spatio-temporal clustering, co-occurrence pattern discovery and hotspot detec-tion [69]. Clustering techniques have been used to extract localized events within a small geographic area in [2] and [73]. More specific topics that represent real-world events, are extracted by using spatio-temporal clustering methods such as tweets related to breaking news from noise are captured by implementing online clustering, namely TwitterStand[66]. Moreover, in [19], the authors introduced a space-time scan statistic approach. The approach is used to detect hotspots as topic events within a dataset across both space and time. Outliers is an unusual and seemingly inconsistent patterns in data. Sometimes it represents useful information about abnormal situations in many applications, for example, credit card fraud
2.4 Particle Swarm Optimization 19
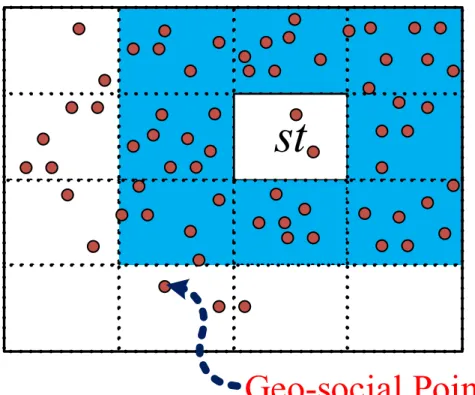
detection, network traffic monitoring and outbreak of disease. Figure 2.3a and figure 2.3b show and example of abnormal situations. Some area likes st in the figure 2.3a sometimes has small tweets but surrounding neighbors have many tweet. It means there is something happen in st area. On the other hand, if st area in figure 2.3b has many tweets but surrounding neighbors have small tweets. Thus, it also means something may happen in the area.
Therefore, this study focus on the outlier detection. A genetic algorithm based approach that can detect spatio-temporal outliers with a multi-objective optimization problem is proposed. In the beginning, a spatio-temporal domain is divided into several small areas and measure the keyword importance of each area. A different pattern of the local importance measures with respect to the surrounding neighbors is assumed as a spatio-temporal outlier of a keyword in geo-social media. The outlier patterns can be divided into two categories: H-pattern which is outbound and L-H-pattern which is lower bound. However, different results are found depending on the way and size of sub-space partitioning. Thus, an optimal partitioning problem is considered in this study. The optimal partitioning problem in a spatio-temporal domain has been proven as an NP-complete problem [48]. Therefore, a genetic algorithm is used to find the optimal way to partition a space. Because GA is capable of making a global search and requires a shorter processing time than other meta-heuristics algorithms.
2.4
Particle Swarm Optimization
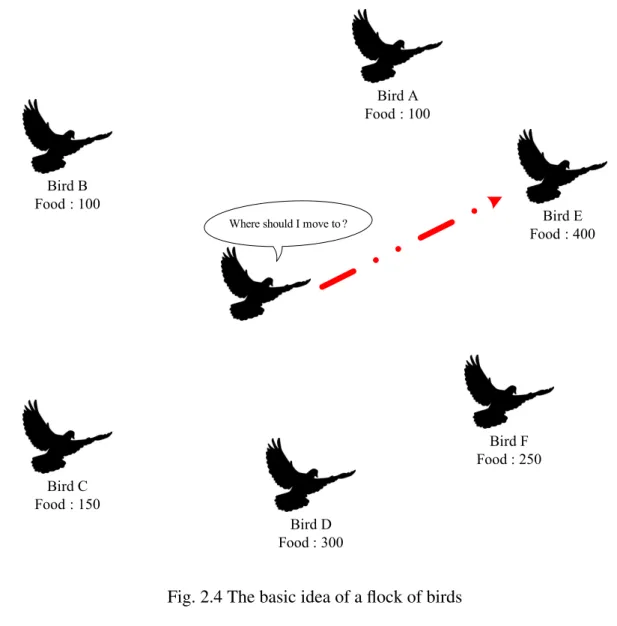
The particle swarm optimization (PSO) is described in this section. In 1995, Kennedy, Eberhart, and Shi designed PSO by imitating the motion of a flock of birds. Figure 2.4 shows a basis idea of a flock of birds. Each bird randomly out to search food and gains knowledge about the presence of food and his/her other members. The best strategy would be to search of food in the surrounding area and/or follow the distance the best food birds covered as shown in the figure. PSO is a population-based optimization tool and can be used to solve optimization problems. The set of potential solutions is represented by the swarm in PSO. A solution in the search space is represented by a particle in the swarm. Each particle moves repeatedly in the search space to find a new position as well as the best fitness value.
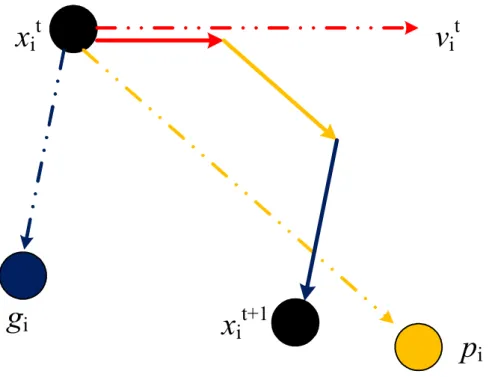
A position vector ⃗xl= (xl1, xl2, ..., xlk) with the l-th particles in k-dimensions is used to represent the particle in the swarm. ⃗vl = (vl1, vl2, ..., vlk) represents the velocity vector. ⃗pl= (pl1, pl2, ..., plk) and ⃗gl= (gl1, gl2, ..., glk) represent the best position of the particle and the best position of the swarm, respectively. In the beginning, PSO randomly generated particles to form an initial swarm. The updated velocity vector is computed at each iteration tin PSO. It can be calculated as follows:
20 Principles and Theories of the Study
st
Geo-social Point
(a) Many points in surrounding neighbors of st area
st
Geo-social Point
(b) Many points in st area
2.4 Particle Swarm Optimization 21 Bird A Food : 100 Bird B Food : 100 Bird C Food : 150 Bird D Food : 300 Bird E Food : 400 Bird F Food : 250
Where should I move to?
Fig. 2.4 The basic idea of a flock of birds
vlk(t + 1) = wvlk(t) + c1r1[plk− xlk(t)] + c2r2[glk− xlk(t)] (2.1) where c1denotes a learning factors called the coefficient of the self-recognition component and c2denotes a learning factors called the coefficient of the social component. w denotes an inertia weight and r1, r2denote random numbers that are uniformly distributed in the interval 0 to 1.
Then the positions of the particle are updated after updating the velocity. The updated positions can be calculated as follows:
22 Principles and Theories of the Study
where l and k denote the number of particles and the dimension of the particles, respectively. Next, after updating the position, the turbulence operator is used. Then, after all processes have finished, the set of gBest is updated. Finally, when the minimum/maximum objective function error is satisfied or the maximum limit of iteration is found, MOPSO terminates its processes.
An example of position updates and velocity in particle swarm optimization is shown in figure 2.5. The procedures of PSO can be implemented as follows:
Step 1 (Initialize): Set the parameters of the particle swarm.
Step 2: Generated randomly the particles (position and velocity vector) and calculated the fitness value .
Step 3: Set each particle’s pBest to the particle position.
Step 4: Collect the set of gBest by choosing the particle position with the best fitness value.
Step 5:Improve the position of particle by calculating the particle’s updated velocity, the particle’s position and the fitness value, respectively.
Step 6: Check the fitness value by comparing between the new position with pBest. If the new position is better than pBest, then set a new position as pBest.
Step 7: Collect the gBest by choosing the particle position with the best fitness value. Step 8: Check the fitness value error or the maximum limit of the number of iterations. If the fitness value error is not satisfied or the maximum limit of the number of iterations is not found go to Step 3, else next step.
Step 9: Report the gBest as the result.
2.5
Genetic Algorithm (GA)
The genetic algorithm (GA) is described in this section. GA is an adaptive heuristic search algorithm based on the evolutionary ideas of natural selection and genetics. Figure 2.6 shows the genetic optimization process. In the beginning, the initial population (P0) randomly generated µ individuals. In each generation (g), a pair of individuals who have high fitness value, are chosen from the population Pgby using a selection operator, for example, a binary tournament randomly takes two individuals from the population Pg, then compare them based on fitness values, finally chooses the one with the best fitness as a parent. Next, two offspring (q1c and q2c) are reproduced by two parents (p1and p2) by using a crossover operator with crossover rate. Then, each offspring is mutated by using a mutation operator with mutation rate. The three operators (selection, crossover, and mutation operator) repeatedly until the maximum number of offspring size is found. Next, the offspring (|Qg|) is combined with
2.5 Genetic Algorithm (GA) 23
v
i
t
x
i
t
p
i
x
i
t+1
g
i
Fig. 2.5 Example of position updates and velocity in particle swarm optimization
the population Pg. Then, the top µ individuals are selected by using a selection operator as the population of next generation (Pg+1). When the number of the generations (g) of GA reaches its maximum limit (gmax), GA terminates its genetic optimization process.
However, recently, the optimization problem is not considered only single-objective optimization problem. There are many optimization problem that considered as multi-objective optimization problem. Therefor, a multi-multi-objective genetic algorithm are presented for solving the multi-objective problem. Figure 2.7 shows procedure of a multi-objective genetic algorithm (MOGA). The MOGA is separated into four processes as follows:
2.5.1
An initialize process
In this process, the genetic algorithm randomly generated current individual values in population. The individual values will regenerate until the number of individuals reaches the predefined value M.
2.5.2
Selection process
In this process, two individuals in population are selected become parents. The domination ranking technique with objective or constraint domain is applied as a selection operator. In
24 Principles and Theories of the Study
Pg<- Randomly generated α individuals
g <- 0 , Q0<- Ø Initialize GA g = gmax Yes |Qg| =β Yes No p1<- BTournament(Pg) p2<- BTournament(Pg) qc1,qc2<- Crossover(p1,p2) Qg<- Qg U {q c1,qc2} Qg <- Mutate(Qg) Pg+1<- Selection(Pg U Qg) g <- g+1
Output Individuals and Fitness Value [gmax]
No
Binary Tournament & Crossover
Mutation Selection
2.5 Genetic Algorithm (GA) 25
Select Parents (Domination Ranking) Objective Domain Individual i Individual j
CrossOver +
Mutation
Offspring size = N Population size = MSelect New Population (Domination Ranking)
Objective Domain
New Population size = M
New Generation
Genetic Algorithm
Multi-Objective
Population size = M Size = M+N Start: Random individual in population
Fig. 2.7 Multi-objective Genetic Algorithm
the beginning, domination ranking technique will randomly takes two individuals (Ia, Ib) and plot their fitness value in objective domain. For example, if Ibdominate Ia, Ibis chosen as parent and drive this step again to find remaining parent. Moreover, the constraint-dominance operator is presented as follows.
Constraint-dominance operator
The fitness is used in selection operator in MOGA. It shows that an individual is inferior or superior to the others. It is determined by relationships among individuals. The rank of
26 Principles and Theories of the Study
V
1
: Violation in the first
constraint
V
2
: V
io
la
tio
n
in
th
e
se
co
nd
c
on
st
ra
in
t
A
D
C
B
E
Fig. 2.8 An example of calculating constraint-dominance fitness
individuals based on the constraint violation and objective values. Individual Xiis said to dominate Xjwith respect to constraints violation if:
Vk(Xi) ≤ Vk(Xj) for all k ∈ 1, 2, 3, ..., m and Vk(Xi) < Vk(Xj) at least one k ∈ 1, 2, 3, ..., m where Vk(Xi) denotes the violation that Xiyields in the k − th constraint. m is number of constraints. Individual Xiis said to dominate Xjwith respect to objective values if:
Fl(Xi) ≤ Fl(Xj) for all l ∈ 1, 2, 3, ..., n and Fl(Xi) < Fl(Xj) at least one l ∈ 1, 2, 3, ..., n Fl(Xi) denotes the objective value that Xi yields in the l − th objective. n is number of objectives.
Individual Xiis said to constraint-dominate Xj if: 1. Xj does violate at least one constraint but Xidoes not,
2. Both Xi and Xj violate at least one constraint, but Xi dominate Xj with respect to constraint violation, or
2.5 Genetic Algorithm (GA) 27
F
1
: Objective value in the
first objective
F
2
: O
bj
ec
tiv
e
va
lu
e
in
th
e
se
co
nd
o
bj
ec
tiv
e
A
B
C
D
E
Fig. 2.9 An example of calculating constraint-dominance fitness
3. Both Xi and Xj do not violate any constraints, but Xi dominate Xj with respect to objective values.
Fitness is calculated for each individual (Xi) as follows.
Fitness(Xi) = µ − d′ (2.3)
Where µ denotes the population size and d′ denotes the number of individuals that constraint-dominate Xi. Thus, non-dominated individuals have the highest fitness.
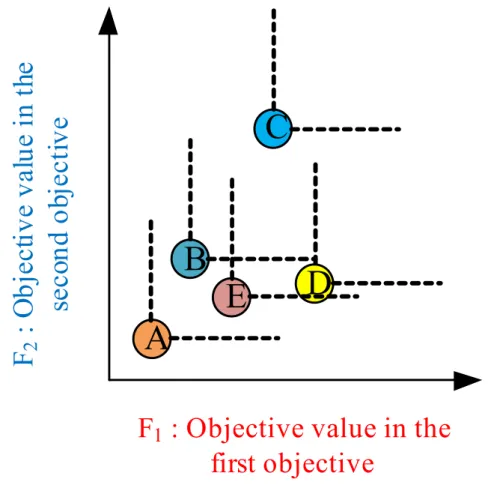
Figure 2.8 and 2.9 show an example of calculating constraint-dominance fitness. Five individuals are considered in constraint-dominance including A, B, C, D, and E. The fitness of D is one because there are four individuals that constraint-dominate D. The fitness of B is five because no individual constraint-dominate B. The fitness of C and A is three because A and C have the same ranking. However, if it is necessary to select between individual A and C, it can be calculated new fitness value for A and C by using an objective domain. Thus, the
28 Principles and Theories of the Study
new fitness of A is five because there is no individual that objective-dominate A and the new fitness of C is one because there are four individuals that objective-dominate C.
2.5.3
Genetic operations process
In this process, The two parents from parent selection process, reproduce two children by using a crossover operator. There are many crossover operators such as one-point crossover, two-point crossover, and simulated binary crossover (SBX). A one-point crossover is presented as an example. In the one-point crossover, the parents individuals (la, lb) are separated into two pieces, then these pieces again. After that, there are two new children, called offspring. However, if there is only crossover operator, the solution may toward to local optimal solution.
Therefore, mutation operator is applied to scatter the solution from local optimal solution. There are many mutation operators such as uniform random mutation, non-uniform mutation, and polynomial mutation. In the mutation operation, a new value randomly and instead of the an old value in gene of offspring.
2.5.4
Population selection process
In this process, the offspring set is combined with the current population set. Then, the selection operator is applied to choose the best set of individuals as a new population for next generation. The GA process will repeat until termination criteria. The termination criteria are a predefined number of iterations or until a predefined fitness value is not reached. The finalize result of GA operation is expected toward global optimal solution.
2.6
Literature Review
This section is divided into three sub-sections that are (1) literature review of optimization in cloud Computing, (2) literature review of optimization in micro-grids, and (3) literature review of the local outlier detection in geo-social points.
2.6.1
Optimization in Cloud Computing
Cloud computing resource management problems have been proven as NP-hard, such as scheduling, load balancing, and mapping. These problems could be solved by using a meta-heuristic algorithm, such as evolutionary algorithm, particle swarm optimization, genetic
2.6 Literature Review 29
algorithm, ant colony optimization, and neural networks. The related work on the resource management optimization problem in cloud computing is presented in this section.
Evolutionary algorithms have been proposed in several studies to solve the resource management optimization problems [43, 39, 71]. A multi-objective genetic algorithm and a greedy heuristic algorithm are proposed in [43] to reduce energy consumption which consists of the energy consumption, CO2emissions and deployment cost. The MOGA outperforms the greedy heuristic in terms of energy consumption and CO2emissions.
Moreover, evolutionary algorithms have been used in several studies to optimize an optimization problems in a wireless sensor network (WSN) [80, 47, 16]. In [80], the authors proposed a GA to optimize the connectivity of sensor nodes and the coverage in a k-covered hotspot area. GA also was proposed to solve a node placement problem in WSN in [47]. The objectives consist of maximizing the coverage and the network lifetime. Moreover, evolutionary algorithm with new genetic operators was proposed in [16]. The proposed EA used to solve the problem using high-dimensional quality of service (QoS) optimization for power grid communication networks and new genetic operators consist of aging operator, age-based crossover operator, aged-based mutation operator, and fitness-based crossoveroperator.
Otherwise, novel algorithms/frameworks have been proposed in several studies to solve optimization problems in wireless networks [74, 52]. An optimal forwarding problem in mobile ad-hoc networks (MANETs) was considered in [52]. The problem solved by using a novel game-theoretic framework to examine the optimal forwarding problem of a two-hop f-cast relay algorithm in MANETs. The relationship between the forwarding behaviors and the final throughput capacity were indicated by the proposed framework. In [74], the authors proposed a complex alliance strategy with multi-objective optimization of coverage. The proposed strategy could improve the effectiveness of sensor node coverage and the network lifetime in WSNs. A novel scheme also was proposed to calculate coverage expectation and proportionality.
Moreover, novel models/frameworks have been proposed in several studies to solve problems in cloud computing [77, 51, 13, 24, 50]. The authors in [24] proposed a multi-cloud architecture, called MCES, which can tolerate pressure more than single multi-cloud service under emergency environment. Smart evacuation services are deployed in multi-cloud providers. The authors in [50] proposed an online-deduplication mechanism based on an energy efficient storage system to manage virtual machine (VM) storage. A deduplication selection algorithm also was designed for minimizing the storage energy consumption. The results show that the proposed mechanism is able to reduce both of the energy consumption and the redundant data blocks without service interruption. In [13], a cloud-centric