比較的安価なNASの定性的・定量的な性能評価
6
0
0
全文
(2) 情報処理学会研究報告. Vol.2017-IOT-38 No.15 2017/6/24. IPSJ SIG Technical Report. publishes a document about best practices for perfor-. objective of the utility is to generate a wide variety of. mance*1 . The document says that “Storage pools have. controlled storage I/O workloads, allowing control over. multiple RAID options per tier for preferred type and. workload parameters such as I/O rate, LUN or file sizes,. drive count...(snip) Use RAID 6 for NL-SAS tier: Pre-. transfer sizes, thread count, volume count, volume skew,. ferred drive counts of 6+2, 8+2, or 10+2 provide the best. read/write ratios, read and write cache hit percentages,. performance versus capacity balance. Using 14+2 pro-. and random or sequential workloads. This applies to both. vides the highest capacity utilization option for a pool,. raw disks and file system files and is integrated with a de-. at the expense of slightly lower availability and perfor-. tailed performance reporting mechanism eliminating the. mance”. Why drive counts of 4+2 provides less perfor-. need for the Solaris command iostat or equivalent perfor-. mance than 6+2, 8+2 or 10+2? Why drive counts of. mance reporting tools. SNIA Emerald. 16+2 provides less capacity utilization option for a pool?. *3. is one of a program to provide pub-. Designers can not find any additional logical or quantita-. lic access to storage system power usage and efficiency. tive explanations of the description.. through use of a well-defined testing procedure, and addi-. It is useful for designers to share information about results of real performance evaluations of various storage. tional information related to system power. Measurement specification of SNIA Emerald*4 adopts Vdbench.. products. If evaluations are done under unfair conditions, a result of the evaluations can become one of the FUD. 2.2 SPC-1, SPC-1/E. for the product. In some cases, unfair evaluations are. SPC-1 Results provide a source of comparative storage. prohibited by an end user license agreement (EULA) of. performance information that is objective, relevant, and. the product. The evaluations should be done with co-. verifiable. That information will provide value through-. operation from a maker, vendors of each product under. out the storage product life-cycle, which includes develop-. fair conditions. This paper intends to introduce several. ment of product requirements, product implementation,. methods to evaluate storage systems and shows results. performance tuning, capacity planning, market position-. of quantitative evaluations of less expensive network at-. ing, and purchase evaluations. The SPC-1 Benchmark is. tached storage products. The definition of “less expen-. designed to be vendor/platform independent and are ap-. sive” is that the unit price per 1 TiB is around 100 USD.. plicable across a broad range of storage configuration and. One of objects of the paper is to share results of quan-. topologies. Any vendor should be able to sponsor and. titative evaluations under fair conditions and to call for. publish an SPC-1 Result, provided their tested configu-. collaboration to designers, makers, and vendors.. ration satisfies the requirements of the SPC-1 benchmark. 2. Benchmark applications. specification*5 . SPC-1 consists of a single workload designed to demon-. There are a lot of applications to evaluate storage sys-. strate the performance of a storage subsystem while per-. tems. This section introduce several useful applications. forming the typical functions of business critical applica-. to evaluate the system.. tions. Those applications are characterized by predominately random I/O operations and require both queries. 2.1 Vdbench. as well as update operations. Examples of those types. Vdbench is a command line utility specifically created. of applications include OLTP, database operations, and. to help engineers and customers generate disk I/O work-. mail server implementations. Otherwise, SPC-1/E is the. loads to be used for validating storage performance and. second SPC benchmark extension, which consists of the. storage data integrity*2 , developed by Oracle. It is written. complete set of SPC-1 performance measurement and re-. in Java with the objective of supporting Oracle heteroge-. porting plus the measurement and reporting of energy use.. neous attachment. At this time I/O has been tested on. This benchmark extension expands energy use measure-. Solaris Sparc and x86, All flavors of Windows, HP/UX,. ment and reporting to larger, more complex storage con-. AIX, Linux, Mac OS X, zLinux and RaspBerry Pi. The. figurations, complementing SPC-1C/E, which focuses on. *1. *3. *2. https://www.emc.com/collateral/software/ white-papers/h10938-vnx-best-practices-wp.pdf http://www.oracle.com/technetwork/server-storage/ vdbench-downloads-1901681.html. ⓒ 2017 Information Processing Society of Japan. *4 *5. https://www.snia.org/emerald https://www.snia.org/emerald/download/Spec_v2.1 http://www.storageperformance.org/results/benchmark_ results_spc1_active/. 2.
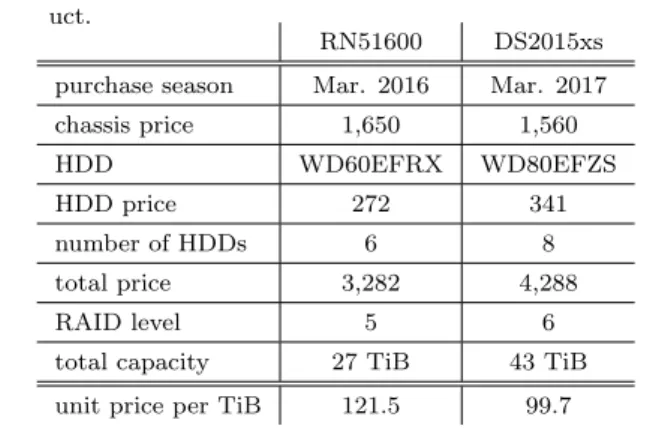
(3) 情報処理学会研究報告. Vol.2017-IOT-38 No.15 2017/6/24. IPSJ SIG Technical Report. storage component configurations. Additional details are. 表 1. A comparison of unit price per TiB of each storage product.. available in an SPC-1/E presentation available for viewing or download.. purchase season. RN51600. DS2015xs. Mar. 2016. Mar. 2017. chassis price. 2.3 IOzone. HDD. IOzone*6 is a filesystem benchmark tool. The bench-. 1,650. 1,560. WD60EFRX. WD80EFZS. 272. 341. 6. 8 4,288. HDD price. mark program generates and measures a variety of. number of HDDs. file operations including sequential read/write, sequen-. total price. 3,282. RAID level. 5. 6. 27 TiB. 43 TiB. 121.5. 99.7. tial reread/rewrite, backwards read, random read/write,. total capacity. record rewrite, strided read, fread/fwrite, freread/frewrite. unit price per TiB. and pread/pwrite. Iozone has been ported to many machines and runs under many operating systems.. 表 2. A comparison of specifications of each storage product. RN51600 DS2015xs Annapurna Labs Intel Core i3-3220 CPU Alpine AL-514. 2.4 fio fio is an I/O tool meant to be used both for bench-. 2. 4. 3.3. 1.7. memory (GB). 4. isaio, and more), I/O priorities (for newer Linux kernels),. number of NIC. GbE x 2. 4 GbE x 2, 10GbE x 2. rate I/O, forked or threaded jobs, and much more. It can. size (mm). 287.5 x 192 x 259. 157 x 340 x 233. work on block devices as well as files. fio accepts job de-. internal file system. BTRFS. EXT4. number of cores CPU Frequency (GHz). mark and stress/hardware verification*7 . It has support for 19 different types of I/O engines (sync, mmap, libaio, posixaio, SG v3, splice, null, network, syslet, guasi, solar-. scriptions in a simple-to-understand text format. Several example job files are included. fio displays all sorts of I/O performance information, including complete IO latencies and percentiles. Fio is in wide use in many places, for both benchmarking, QA, and verification purposes. It supports Linux, FreeBSD, NetBSD, OpenBSD, OS X, OpenSolaris, AIX, HP-UX, Android, and Windows.. ReadyNAS 516 (RN51600)*9 and the other is Synology DS2015xs*10 . The unit price per TiB of these two products are shown in Table 1. RN51600 is no longer on sale at the end of May 2017. The unit of price is USD. The unit price per TiB of these two products is around 100 USD. Specification of two products are described in Table 2. As the most significant aspect of DS2015xs, the product. 2.5 Oracle ORION ORION (Oracle I/O Calibration Tool) is a standalone tool for calibrating the I/O performance for storage systems that are intended to be used for Oracle databases*8 . The calibration results are useful for understanding the performance capabilities of a storage system, either to uncover issues that would impact the performance of an Oracle database or to size a new database installation. Since ORION is a standalone tool, the user is not required to. provides 2 port 10GbE SFP+ at the price. Unfortunately, evaluation with the 10GbE is not done in the paper because the author do not have any 10 GbE Switches. The author strongly hope some merciful network vendor give or rent me some 10 GbE Switches for an evaluative use. If the vendor would do so, the author intends to evaluate the products under fair conditions, and then also publishes the results and advertises the vendor on the workshop or symposium of IPSJ SIG-IOT and so on. If you are interested,. create and run an Oracle database.. please send the author E-mail.. 3. Evaluations. And DS2015xs can also provide read-write and readonly SSD cache technology.. 3.1 target products. The paper only introduces Synology DS2015xs bench-. In last year, the author accidentally met an opportunity to get two storage products.. One is NETGEAR. mark results because of space limitation. In the future paper, comparative evaluations between two or among more. *6 *7 *8. http://www.iozone.org http://freecode.com/projects/fio http://www.oracle.com/technetwork/jp/topics/ index-096484-ja.html. ⓒ 2017 Information Processing Society of Japan. products will be published. Do not miss it. *9 *10. https://www.netgear.com/business/products/storage/ readynas/RN51600.aspx https://www.synology.com/en-global/products/DS2015xs. 3.
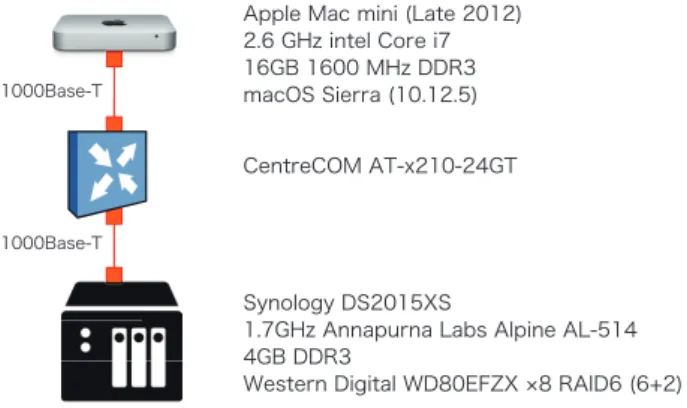
(4) 情報処理学会研究報告. Vol.2017-IOT-38 No.15 2017/6/24. IPSJ SIG Technical Report Apple Mac mini (Late 2012) 2.6 GHz intel Core i7 16GB 1600 MHz DDR3 macOS Sierra (10.12.5). 1000Base-T. CentreCOM AT-x210-24GT. writing a new file. Read This test measures the performance of reading an existing file. Re-Read This test measures the performance of reading a file that was recently read. It is normal for. 1000Base-T. Synology DS2015XS 1.7GHz Annapurna Labs Alpine AL-514 4GB DDR3 Western Digital WD80EFZX 8 RAID6 (6+2). 図 1. performance to be higher than the performance of. A diagram of benchmark setup for IOzone. the performance to be higher as the operating system generally maintains a cache of the data for files that were recently read. This cache can be used to satisfy reads and improves the performance. Random Read This test measures the performance of reading a file with accesses being made to random. 3.2 setting up If a laboratory of the author would have enough bud-. locations within the file. The performance of a system under this type of activity can be impacted by. gets, the paper can show evaluation results of network. several factors such as: Size of operating system’s. attached storage with 10GbE environment. A diagram. cache, number of disks, seek latencies, and others.. of an environment of evaluations is shown in Figure 1.. Random Write This test measures the performance of. DS2015xs is connected to CentreCOM AT-x210-24GT. writing a file with accesses being made to random lo-. GbE L2 network switch with 1000Base-T. And AT-x210-. cations within the file. Again the performance of a. 24GT is also connected to Apple Mac mini (Late 2012). system under this type of activity can be impacted. with 1000Base-T. macOS Sierra (10.12.5) is running on. by several factors such as: Size of operating system’. Mac mini. Benchmark programs are executed on macOS. DS2015XS provides Apple Filing Protocol (AFP) over TCP/IP and macOS mounts a share point.. s cache, number of disks, seek latencies, and others. Backwards Read This test measures the performance of reading a file backwards. This may seem like a strange way to read a file but in fact there are appli-. 3.3 benchmark with IOzone. cations that do this. MSC Nastran is an example of. In the paper, IOzone benchmark is used to measure. an application that reads its files backwards. With. throughput of storage systems. The benchmark can eval-. MSC Nastran, these files are very large (Gbytes to. uate storage systems with various type of operations. Ac-. Tbytes in size). Although many operating systems. cording to the documentation of iozone*11 , the evaluation. have special features that enable them to read a file. use 9 types of operations. The operations and their de-. forward more rapidly, there are very few operating. scriptions are as follows:. systems that detect and enhance the performance of. Write This test measures the performance of writing a. reading a file backwards.. new file. When a new file is written not only does the. Record Rewrite This test measures the performance. data need to be stored but also the overhead infor-. of writing and re-writing a particular spot within a. mation for keeping track of where the data is located. file. This hot spot can have very interesting behav-. on the storage media. This overhead is called the. iors. If the size of the spot is small enough to fit in the. “metadata” It consists of the directory information,. CPU data cache then the performance is very high.. the space allocation and any other data associated. If the size of the spot is bigger than the CPU data. with a file that is not part of the data contained in. cache but still fits in the TLB then one gets a dif-. the file. It is normal for the initial write performance. ferent level of performance. If the size of the spot is. to be lower than the performance of re-writing a file. larger than the CPU data cache and larger than the. due to this overhead information.. TLB but still fits in the operating system cache then. Re-write This test measures the performance of writ-. one gets another level of performance, and if the size. ing a file that already exists. When a file is written. of the spot is bigger than the operating system cache. that already exists the work required is less as the. then one gets yet another level of performance.. metadata already exists. It is normal for the rewrite. Strided Read This test measures the performance of. *11. http://www.iozone.org/docs/IOzone_msword_98.doc. ⓒ 2017 Information Processing Society of Japan. reading a file with a strided access behavior. An ex-. 4.
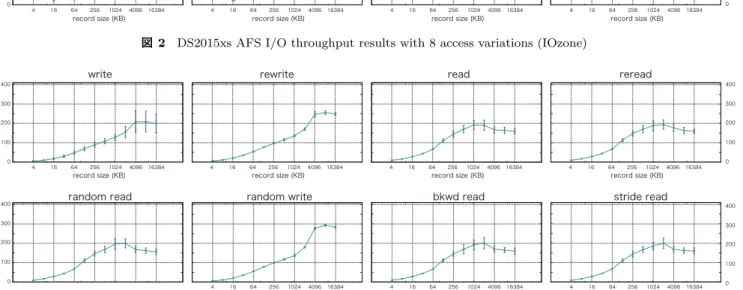
(5) 情報処理学会研究報告. Vol.2017-IOT-38 No.15 2017/6/24. IPSJ SIG Technical Report. ample would be: Read at offset zero for a length of. throughput degradation is waiting a response from prod-. 4 Kbytes, then seek 200 Kbytes, and then read for. uct company.. a length of 4 Kbytes, then seek 200 Kbytes and so. Meanwhile the results of random read, random. on. Here the pattern is to read 4 Kbytes and then. write, bkwd read and stride read show a character-. Seek 200 Kbytes and repeat the pattern. This again. istic pattern of throughput changes in each record size.. is a typical application behavior for applications that. Every results show the worst throughput in 16 KB record. have data structures contained within a file and is. size. In random read, random write and bkwd read,. accessing a particular region of the data structure.. throughput with 4KB and 8 KB record size show approx-. Most operating systems do not detect this behavior. imately same throughput with 512 KB record size. Each. or implement any techniques to enhance the perfor-. throughput with more than 1024 KB record size increase. mance under this type of access behavior. This access. linearly. Standard deviations in stride read are larger. behavior can also sometimes produce interesting per-. than results of the other operations. The result shows the. formance anomalies. An example would be if the ap-. product may increase throughput jitters under stride read. plication’s stride causes a particular disk, in a striped. operations. Although detail information for NFS storage of. file system, to become the bottleneck. IOzone also has a lot of command line options. In the. Hokkaido University Data Science Cloud System is not. evaluation three options are enabled to exclude effects of. clear, the author makes sure that the storage must be. cache. The options and their descriptions are as follows:. more expensive. The cloud system consists of Citrix (Ac-. -c Include close() in the timing calculations. This is use-. celerite)) CloudPlatform*12 and XenServer*13 *14 . Users. ful only if you suspect that close() is broken in the. of the system can make virtual machines (VMs) and can. operating system currently under test. It can be use-. attach NFS storage to VMs. In the comparative evalua-. ful for NFS Version 3 testing as well to help identify. tion, number of virtual CPU of a VM is 10, main memory. if the nfs3_commit is working well.. is 40GB, system storage is 222 GB. Capacity of attached. -e Include flush (fsync,fflush) in the timing calculations. NFS storage is 1 TB. An operation system of the VM is. -I Use DIRECT IO if possible for all file operations. Tells. Ubuntu 17.04. Evaluation benchmarks are executed with. the filesystem that all operations to the file are to. the same operations and same options of benchmarks on. bypass the buffer cache and go directly to disk. (not. Synology DS2015xs.. available on all platforms). As contrasted to the benchmark results of Synology. A file size of the benchmark is constantly 4 GB, a record. DS2015xs, the results of write and rewrite show lin-. size is dynamically changed doubling from 4 KB to 16 MB.. ear increments between record size and throughput from. Each benchmark evaluation is executed 40 times. Results. record size 4 KB to 4096 KB. Although the results of. of the benchmarks are shown in Figure 2. To compare. read and reread also show linear increments, the peak. with an more expensive network attached storage product,. throughput is on record size 1024 KB or 2048 KB. The. throughput performance of NFS storage attached to vir-. peak throughput of write, rewrite, read and reread. tual machines on Hokkaido University Data Science Cloud. are 254.1 MB/sec, 280.3 MB/sec, 258.1 MB/sec and 254.2. System is also measured (Figure 3). Plotted points are av-. MB/sec respectively. According to the results, the band-. eraged values of each combination of record size and its. width between VMs and NFS storages can be supposed to. throughput. These points are connected with lines. Stan-. be more than 1 Gbps. The results of random read, ran-. dard deviations of each combination are also described. dom write and stride read also show the similar char-. with error bars. The results of Record Rewrite are. actaristics between the record size and the throughput on. supposed to be effected by cache. The graph of Record. write, read and reread operations. The characteristics. Rewrite is omitted.. of rewrite is similar to the one of random write, the. For the results of DS2015xs AFS throughput, the results of write, rewrite, read and reread show constant throughput in each record size.. KB and 16384 KB.. Total average. write, rewrite, read, reread throughput through all record sizes are 70.1 MB/sec, 46.1 MB/sec, 95.9 MB/sec and 96.45 MB/sec. A detailed explanation of rewrite ⓒ 2017 Information Processing Society of Japan. peak of throughput is located between record size 4096. *12 *13 *14. https://accelerite.com/products/cloudplatform/ https://xenserver.org/ https://www.citrix.com/content/dam/citrix/en_us/ documents/customers/hokkaido-university-en.pdf. 5.
(6) 情報処理学会研究報告. Vol.2017-IOT-38 No.15 2017/6/24. IPSJ SIG Technical Report write. throughput (MB/sec). 100. 100 80 60. 40. 40. 20. 20. 4. 16. 64. 256. 1024. record size (KB). 4096. 16384. 4. 16. random read. 64. 256. 1024. record size (KB). 4096. 16384. 4. 16. random write. 64. 256. 1024. record size (KB). 4096. 16384. 4. 16. 64. 256. 1024. record size (KB). bkwd read. 4096. 16384. stride read. 0. 100. 80. 80. 60. 60. 40. 40 20. 20 0. 4. 16. 64. 256. 1024. record size (KB). 4096. 16384. 図 2. 4. 16. 64. 256. 1024. record size (KB). 4096. 16384. 4. 16. 64. 256. 1024. record size (KB). 4096. 16384. 4. 16. 64. 256. 1024. record size (KB). 4096. 16384. 0. DS2015xs AFS I/O throughput results with 8 access variations (IOzone). write. 400. throughput (MB/sec). reread. 60. 100. rewrite. read. reread. 400. 300. 300. 200. 200. 100. 100. 0. 4. 16. 64. 256. 1024. record size (KB). 4096. 16384. 4. 16. random read. 400. throughput (MB/sec). read. 80. 0. throughput (MB/sec). rewrite. 64. 256. 1024. record size (KB). 4096. 16384. 4. 16. random write. 64. 256. 1024. record size (KB). 4096. 16384. 4. 16. 64. 256. 1024. record size (KB). bkwd read. 4096. 16384. stride read. 0. 400. 300. 300. 200. 200. 100. 100. 0. 4. record size (KB). 図 3. 16. 64. 256. 1024. record size (KB). 4096. 16384. 4. 16. 64. 256. 1024. record size (KB). 4096. 16384. 4. 16. 64. 256. 1024. record size (KB). 4096. 16384. 0. NFS storage of Hokkaido University Data Science Cloud System I/O throughput results with 8 access variations (IOzone). 4. Pay forward cycle 5. Conclusion To share performance information under fair condition, the paper shows one result of benchmark with one storage product. The cost of evaluation is not negligible. To reduce the cost, the author will propose a system to collect various results. The author also hope to build a pay forward environment among evaluators, system designers, and product vendors. 参考文献 [1]. 中村 豊,佐藤彰洋:次世代ファイアーウォール機器の評 価検証について,インターネットと運用技術シンポジウム 2016 論文集,Vol. 2016, pp. 106–106 (2016).. ⓒ 2017 Information Processing Society of Japan. 6.
(7)
図
関連したドキュメント
[r]
転倒評価の研究として,堀川らは高齢者の易転倒性の評価 (17) を,今本らは高 齢者の身体的転倒リスクの評価 (18)
Standard domino tableaux have already been considered by many authors [33], [6], [34], [8], [1], but, to the best of our knowledge, the expression of the
Various attempts have been made to give an upper bound for the solutions of the delayed version of the Gronwall–Bellman integral inequality, but the obtained estimations are not
H ernández , Positive and free boundary solutions to singular nonlinear elliptic problems with absorption; An overview and open problems, in: Proceedings of the Variational
Keywords: Convex order ; Fréchet distribution ; Median ; Mittag-Leffler distribution ; Mittag- Leffler function ; Stable distribution ; Stochastic order.. AMS MSC 2010: Primary 60E05
In Section 4 we present conditions upon the size of the uncertainties appearing in a flexible system of linear equations that guarantee that an admissible solution is produced
It is suggested by our method that most of the quadratic algebras for all St¨ ackel equivalence classes of 3D second order quantum superintegrable systems on conformally flat
