Improvement in the performance and durability of PEFCs
using titanium-based ceramics as catalyst support materials
A Doctoral Thesis
Presented to
Interdisciplinary Graduate School of Medicine and Engineering
University of Yamanashi
September 2015
i
Table of Contents
Chapter 1
General Introduction
1.1 Research background ... 1
1.1.1 Polymer Electrolyte Fuel Cells (PEFCs) ... 2
1.1.2 Durability of PEFCs ... 4
1.2 Review of technologies to mitigate cathode catalyst degradation during the startup and shutdown cycling ... 7
1.2.1 Corrosion-resistant catalyst support materials ... 7
1.2.2 System operation strategies for reducing reverse current ... 9
1.3 Objective of the present research ... 11
1.4 References for Chapter 1 ... 14
Chapter 2
Performance and Durability of Titanium Nitride-Supported Platinum
Catalyst Mixed with Acetylene Black as the Cathode Catalyst for
Polymer Electrolyte Fuel Cells
2.1 Introduction ... 182.2 Experimental ... 19
2.2.1 Preparation of Pt/TiN catalysts ... 19
2.2.2 Preparation of MEAs ... 20
2.2.3 Performance test of single cells ... 21
ii
2.3 Results and discussion ... 23
2.3.1 Cell resistance and microstructure of catalyst layer ... 23
2.3.2 ECSA and Pt utilization of Pt/TiN + AB cathodes ... 24
2.3.3 Polarization performance of MEAs using Pt/TiN + AB cathodes ... 25
2.3.4 Durability of MEAs using Pt/TiN cathodes at high potentials ... 27
2.4 Conclusions ... 29
2.5 References for Chapter 2 ... 39
Chapter 3
Performance
and
Durability
of
Tantalum-doped
Titanium
Dioxide-Supported Platinum Catalyst with Fused Aggregate Structure
as the Cathode Catalyst for Polymer Electrolyte Fuel Cells
3.1 Introduction ... 413.2 Experimental ... 43
3.2.1 Preparation of Pt/Ta-doped TiO2 catalysts ... 43
3.2.2 Characterization of Pt/Ta-doped TiO2 catalysts ... 44
3.2.3 RDE measurement ... 45
3.2.4 Preparation of MEAs and single cells ... 46
3.2.5 Performance and durability test of single cells ... 46
3.3 Results and discussion ... 47
3.3.1 Characterizations of Ti1-xTaxO2–δ support and Pt/Ti1-xTaxO2–δ catalyst ... 47
3.3.2 Electrochemical characterizations of Pt/Ti1-xTaxO2–δ (x = 0.1, 0.2) catalysts... 49
3.3.3 Performance and durability of MEAs with Pt/Ti1-xTaxO2–δ (x=0.1, 0.2) heat-treated at 900 °C as the cathode catalysts ... 52
iii
3.5 References for Chapter 3 ... 70
Chapter 4
Novel Strategy to Mitigate Cathode Catalyst Degradation during
Air/Air Startup Cycling via the Atmospheric Resistive Switching
Mechanism of a Hydrogen Anode with Tantalum-doped Titanium
Dioxide-Supported Platinum Catalyst with Fused Aggregate Structure
4.1 Introduction ... 734.2 Experimental ... 75
4.2.1 Preparation of Pt/Ti0.9Ta0.1O2–δ catalysts ... 75
4.2.2 Preparation of MEAs and single cells ... 76
4.2.3 Performance and durability test of single cells ... 77
4.3 Results and discussion ... 79
4.3.1 Electrical and electrochemical properties of anode catalyst layer with Pt/Ti0.9Ta0.1O2–δ catalyst ... 79
4.3.2 Effect of the Pt/Ti0.9Ta0.1O2–δ anode on the durability of the MEA during air/air startup cycling ... 82
4.4 Conclusions ... 85
4.5 References for Chapter 4 ... 91
Chapter 5
General Conclusions
5.1 Conclusions ... 945.2 Future directions ... 98
iv
List of Publications
100Meeting Abstracts
101Patent Application
102- 1 -
Chapter 1
General Introduction
1.1 Research background
1.1.1 Polymer Electrolyte Fuel Cells (PEFCs)
One of the biggest challenges of the 21st century is to eliminate dependence on fossil fuel, because it is a limited resource and produces carbon dioxide which is the cause of global warming [1]. Renewable energy, such as solar energy, wind power, tidal power, geothermal heat and biomass, has attracted much attention as the alternative energy. In OECD countries, total primary energy supply from renewable sources increased at an average annual growth of 2.5% from 1990 to 2014 [2]. However, in order to promote further introduction of renewable energy, it is necessary to develop technologies for storing the energy, because the output of renewable energy fluctuates with time, season and weather. It is considered that hydrogen has an excellent potential as an energy carrier for massive and long-term storage of renewable energy [3]. Hydrogen can be produced from renewable sources with various methods. The energy density per mass is higher than fossil fuels and the energy density per volume can be enhanced by compression, liquefaction and transforming to hydrides. Additionally, it is possible to generate electric power with high efficiency and without CO2 emissions as well as other pollutant emissions by use of fuel cells. Fuel cells are a key technology for realizing the hydrogen-based renewable energy system.
Among the various types of fuel cells, polymer electrolyte fuel cells (PEFCs) are considered to be promising for automotive and stationary-power applications because of its high electricity generation efficiency, high power density and low operating temperature [4]. In the operating PEFC, the hydrogen oxidation reaction (HOR,
- 2 -
equation (1.1)) occurs at the anode, and the oxygen reduction reaction (ORR, equation (1.2)) occurs at the cathode respectively (Fig. 1-1). The polymer electrolyte membrane (PEM) transports protons as well as prevents from the mixing of hydrogen and oxygen gases. The electrons pass through an external circuit to produce an electromotive force. The overall reaction is shown in equation (1.3).
2H2 → 4H+ + 4e− (1.1) O2 + 4H+ + 4e−→ 2H
2O (1.2) 2H2 + O2 → 2H2O (1.3)
The HOR and the ORR occur on the heterogeneous catalyst surfaces where reactant gases (H2 or O2), protons (H+) and electrons (e−) can access, which is called “three-phase boundary”. A state-of-the-art technology to realize the three-phase boundary is forming a porous catalyst layer with carbon black-supported platinum catalysts (Pt/CB) and perfluorosulfonic acid (PFSA) binders (Fig. 1-2) [5]. Pt is one of the most active catalysts for the HOR and the ORR. The porous structure is created by carbon blacks (CBs) which has a fused aggregate structure. The reactant gases and electrons are transported to the Pt surface through the networks of pores and carbon blacks, respectively. The protons are supplied to the Pt surface through the networks of the PFSA binders.
- 3 -
Figure 1-1 Schematic drawing of the operating PEFC.
H
2Air
H
+e
-PEM CL GDL CL GDL Anode CathodeExternal load
GDL: Gas Diffusion Layer CL: Catalyst Layer
PEM: Polymer Electrolyte Membrane
Figure 1-2 Schematic drawing of a three-phase boundary in the cathode catalyst layer.
H
+e
-O
2H
2O
PFSA binder Carbon black Pt- 4 - 1.1.2 Durability of PEFCs
Durability is one of the essential characteristics for PEFCs to be beneficial and economical products. The required durability significantly varies depending on the application [6]. The life time targets of stationary applications are at least 40,000 h, while those of automotive applications are much more lower (e.g. 5,000 h for cars, 20,000 h for buses). For automotive applications, the number of startup and shutdown, starting from sub-freezing temperature and dynamic load cycling are the challenging issues in durability. Among the components of PEFCs, membrane and catalysts are easily deteriorated during such operation modes, because they are exposed to a harsh environment in the operating PEFCs. Therefore, considerable efforts are dedicated to understand the degradation mechanism of membrane and catalysts over the past few decades.
Membrane degradation is classified into chemical degradation and mechanical degradation. Hydrogen peroxide formation is considered to be a major factor of the chemical degradation [7]. The membrane is gradually decomposed to be thin by chemical reactions with oxygen radicals generated from hydrogen peroxide which can be produced by a chemical reaction of crossover gases on the catalysts and/or an electrochemical reaction of oxygen on the cathode catalysts [8,9]. Therefore, chemical stability of membrane has an impact on the life time of PEFCs. During the operation of PEFCs, catastrophic degradation can be caused by mechanical destruction of membrane. Membrane is subjected to a mechanical stress due to the dimensional change, which is caused by the relative humidity cycling [10]. The relative humidity cycling can be observed during startup/shutdown cycling and dynamic load cycling. Therefore, mechanical stability of membrane can determine the number of the cycling.
- 5 -
size of the Pt-based catalyst is usually controlled in the range of 2-6 nm to enhance the electrochemically active surface area of Pt (ECSA). Electrochemical instability of the Pt nanoparticles is one of the reasons of the catalyst degradation [11]. During startup/shutdown cycling and dynamic load cycling of PEFCs, the Pt nanoparticles can be exposed to a potential cycling. The small particles may dissolve into the electrolyte (ionomer) phase at high potentials and redeposit on the surface of large particles at low potentials, resulting in the coarsening of the particles [12]. This phenomenon is known as Ostwald ripening.
Corrosion of the CB support is also important issue of the catalyst degradation. Carbon is thermodynamically oxidized to CO2 above 0.207 V vs. the standard hydrogen electrode (SHE) [13]. Although the rate of carbon oxidation is slow, the reaction can be accelerated by the presence of Pt and high potentials [14]. If the CB support is oxidized to CO2, Pt particles on the CB supports are detached or sintered as well as the porous structure of the catalyst layer is destroyed [15,16]. The former brings about losses of the catalytic activity and the latter brings about increasing of the mass transport losses. Therefore, corrosion of the CB support causes severe performance degradation of PEFCs.
An abnormally high potential arises at the cathode during startup and shutdown, which is a major reason of the carbon corrosion in the operating PEFCs. This phenomenon is known as reverse current mechanism [17-20]. The reverse current mechanism can be explained as follows (Fig. 1-3). When the system is not operated for periods greater than a few hours, the anode gas channels are filled with air, due to crossover through the proton exchange membrane and leakage from outside air. At startup, the HOR begins to occur in the upper flow field of the anode due to the inflowing hydrogen, with the ORR beginning to occur on the facing cathode. On the
- 6 -
other hand, the ORR occurs on the lower flow field of the anode with the air still remaining in the gas channels, which causes an abnormally high potential at the facing cathode. This abnormally high potential accelerates the corrosion of the carbon support in the cathode catalyst layer.
Figure 1-3 Generation mechanism of the reverse current during the startup process [17].
Air O2+ 4H++ 4e-→ 2H2O Air 2H2O → O2+ 4H++ 4e- Pt → Pt2++ 2e- C + 2H2O → CO2+ 4H++ 4e- H2→ 2H++ 2e- H2 O2+ 4H++ 4e-→ 2H2O Air e- e- H+ H+
Anode gas inlet Anode gas outlet
Anode Cathode
PEM
- 7 -
1.2 Review of technologies to mitigate cathode catalyst degradation during
startup and shutdown
The cathode catalyst degradation during startup and shutdown is a vital issue for the durability of PEFCs. Many researches have been made to mitigate the degradation over a past few decades. The mitigation strategies can be classified into (1) improving the durability of catalyst support materials and (2) reducing the reverse current with a special system.
1.2.1 Corrosion-resistant catalyst support materials
One of the strategies to mitigate the cathode catalyst degradation is to use a corrosion-resistant alternative support material to CB. The needed properties for the catalyst support materials are high electrochemical stability at high potentials, high chemical stability at low pH, high electrical conductivity and high surface area. From the point of view of the electrochemical stability and the electrical conductivity, conductive ceramics have been attracted much attention as the alternative support material.
SnO2 and metal-doped SnO2 have been widely studied as corrosion-resistant catalyst support materials for PEFC cathodes. [21-26]. In our group, Sb-doped SnO2-supported Pt catalyst (Pt/Sb-doped SnO2) and Nb-doped SnO2-supported Pt catalyst (Pt/Nb-doped SnO2) with carbon black-like fused aggregate structures, which are beneficial for the lowering of the contact resistance between doped SnO2 particles, exhibited higher performance than Pt/CB, as well as enhanced stability at high potentials [25,26]. However, slight dissolution of Sn at potentials below 0.4 V has been pointed out in the literature [25,26].
- 8 -
electronic conductivity appears to be insufficient. It is well known that the electronic conductivity of titanium-based ceramics originates from the presence of Ti3+ ions [27]. Ti3+ ions can be generated by creating oxygen deficiencies or by introducing appropriate donor dopants into the TiO2 lattice. Magneli-phase titanium suboxides show comparable electrical conductivity to CB [28]. Ioroi et al. reported that Magneli-phase TiOx-supported Pt-based catalysts (Pt/TiOx) exhibited excellent durability during potential cycling up to 1.5 V vs. RHE [29,30]. Although their Magneli-phase TiOx synthesized by pulsed UV laser irradiation had a relatively high surface area ( > 20 m2 g−1), the ECSA values were still small compared to that of Pt/CB. Group-V elements (Nb, Ta, V) can be substitutionally incorporated within the rutile-TiO2 lattice to occupy at least 50% of the cation sites and act as n-type dopants for TiO2 [31]. Because of the high atomic d-orbital energy of Nb and Ta, incorporated Nb and Ta release their electrons to the TiO2 conduction band, thus leading to electrical conductivity [32]. There are a lot of studies about Nb-doped TiO2-supported Pt catalysts (Pt/Nb-doped TiO2) [33-36]. Compared with Pt/CB, comparable ORR activity and enhanced durability against high potentials have been reported with rotating disk electrode (RDE) technique [34-36]. However, a lower performance of MEA using Pt/Nb-doped TiO2 as the cathode catalyst is reported, which is attributed to a lower conductivity of Nb-doped TiO2 than that of CB [34]. On the other hand, few studies have focused on Ta-doped TiO2-supported Pt catalysts (Pt/Ta-doped TiO2). Kumar et al. reported that their Pt/Ti0.7Ta0.3O2 exhibited higher electrochemical stability than Pt/CB, though the ORR activity measured with the RDE technique was approximately half of that of Pt/CB [37].
Titanium nitride (TiN) is also well known to be a conductive titanium-based ceramic, with more than a factor of ten greater electronic conductivity compared to those of metal oxides or carbons [38], in addition to chemical and electrochemical stability in
- 9 -
acidic media [38,39]. Recently, Avasarala et al. demonstrated that a titanium nitride-supported Pt catalyst (Pt/TiN) outperformed a Pt/CB catalyst in catalytic activity for the same Pt particle size and loading [40]. However, they reported that the durability improvement of Pt/TiN compared to Pt/CB was minor, because the increased durability of Pt/TiN, gained from the catalyst support resistance to corrosion, was seen to be offset by an increase in the rate of Pt agglomeration [41]. In our previous study, Pt/TiN catalysts with highly preferred orientation of Pt nanoparticles on the TiN nanoparticles showed higher ORR activity and durability compared to Pt/CB with the thin-film rotating disk electrode (RDE) technique in acidic solutions at room temperature [42, 43].
1.2.2 System operation strategies for reducing reverse current
As discussed in 1.1.2, the reverse current brings about an abnormally high potential at the cathode (see Fig. 1-3 Region B), resulting in severe degradations of the cathode catalysts. Therefore, reduction of the reverse current is one of the possible strategies to suppress the cathode catalyst degradation.
The reverse current can be generated when a hydrogen/air interface is created at the anode. Gas purging is a commonly used technology to prevent the hydrogen/air interface. For stationary power application, inert gases, such as nitrogen, methane and propane, can be available for purging a fuel cell stack during the startup and shutdown process. Purging the anode gas cannels with such inert gases prevents the generation of hydrogen/air interface and avoids the cathode catalyst degradations [44]. However, it is not easy for fuel cell vehicles (FCVs) to use the inert gases as a purge gas. Ballier et al. invented a safe procedure for starting up a fuel cell system without an inert gas. The procedure included a purging of the cathode flow field with the reducing fluid fuel, such
- 10 -
as a hydrogen gas, then directing the reducing fluid fuel to the anode flow field [45]. With this procedure, the reverse current can be reduced because the cathode flow field is filled with hydrogen during the residual air ejected from the anode flow field.
Applying an auxiliary load is another effective way to avoid the cathode catalyst degradation during startup and shutdown. Kim et al. demonstrated that the consuming the residual air at the cathode with an auxiliary load during the startup procedure had a significant effect on mitigating the cathode catalyst degradations caused by the reverse current [46]. Controlling the cell voltages using an auxiliary load with a voltage controlling device is the other way to mitigate the cathode catalyst degradations during startup and shutdown. Perry et al. reported that the performance losses decreased by one twentieth, keeping the cell voltage below 0.08 V during the hydrogen introduction by drawing currents with an auxiliary load [47].
- 11 - 1.3 Objective of the present research
At the moment, system operation strategies are usually adopted to mitigate the catalyst degradation during startup and shutdown in commercialized PEFC systems [48,49]. However, the complicated system incurs cost increase, which is one of the factors to prevent a widespread of PEFC systems [50,51]. Therefore, this thesis focused on developing a technology to mitigate the cathode catalyst degradation during startup and shutdown without help from such a complicated system. I paid attention to conductive titanium-based ceramics as catalyst support materials because of the following advantages of titanium.
1. Excellent chemical and electrochemical stability 2. Controllable electronic properties by metal doping 3. Abundant in resources
Among the titanium-based ceramics, TiN is one of the most conductive compounds, which has more than a factor of ten greater electronic conductivity compared to those of metal oxides or carbons [38]. Kakinuma et al. successfully demonstrated Pt/TiN catalysts with highly preferred orientation of Pt nanoparticles on the TiN nanoparticles showed higher ORR activity and durability compared to Pt/CB with the RDE [42,43]. However, it is necessary to demonstrate the performance and durability of the membrane-electrode assemblies (MEAs) for practical use of the catalyst. The catalyst layer of MEAs is essentially a gas diffusion electrode, so that it is necessary to control the morphology in order to realize practical electrical conductivity and gas diffusivity.
In Chapter 2, I investigated the performance and durability of MEAs using the Pt/TiN as the cathode catalysts. I tried to control the electrical conducting pathways and gas diffusion pathways in the cathode catalyst layer by adding acetylene black (AB). I also discussed the degradation mechanisms of the Pt/TiN during a potential cycling
- 12 - simulated startup and shutdown of PEFC systems.
In terms of the chemical and electrochemical stability, TiO2 is the most promising compounds among the titanium-based ceramic. However, the electrical conductivity appears to be insufficient. Ta is a suitable dopant for improving the electrical conductivity of TiO2 because it acts as an n-type dopant in TiO2 [31,32] and the oxide is chemically and electrochemically stable in acidic media [52].
In Chapter 3, I studied on the performance and durability of Pt/Ta-doped TiO2 as cathode catalysts. In our group, SnO2 nanoparticles with carbon black-like fused aggregate structure, which are beneficial for lowering the contact resistance between nanoparticles, were successfully synthesized with the flame oxide synthesis method [25,26]. I applied the synthesis method to synthesize Ta-doped TiO2 with fused aggregate structure. I designed the electrical conductivity and the ORR activity, controlling the amount of Ta doping and the heat treatment temperature. Then, I investigated the performance and durability of MEAs using the Pt/Ta-doped TiO2 with fused aggregate structure as cathode catalysts.
Ta-doped TiO2 has been studied as gas sensors by using the change in the resistivity depending on the gas atmosphere [53,54]. The resistivity increases in oxidizing atmosphere due to the presence of adsorbed oxygen species which introduce a depletion layer on the surface. I considered that the reverse current could be reduced by the use of the Pt/Ta-doped TiO2 as anode catalysts without sacrificing the HOR performance, because the ORR at the anode could be suppressed by the high resistivity in oxygen atmosphere, while the HOR wasn’t disturbed due to the low resistivity in hydrogen atmosphere.
In Chapter 4, I demonstrated the above new concept for mitigating the cathode catalyst degradation during startup and shutdown. First, I discussed the electrical
- 13 -
resistivity and the HOR activity of the Pt/Ta-doped TiO2 catalyst layer. Then, I investigated the cathode catalyst degradations of the MEA using the Pt/Ta-doped TiO2 as the anode catalyst during air/air startup cycling.
In Chapter 5, as the general conclusions, I summarized the results of the investigations about conductive titanium-based ceramics as catalyst support materials. Finally, I revealed remaining challenges for the practical use as the fuel cell catalyst.
- 14 - 1.4 References for Chapter 1
[1] Intergovernmental Panel on Climate Change, IPCC Fifth Assessment Report (2013). [2] Renewables information (2015 edition), IEA statistics (2015).
[3] J.A. Turner, Science 285 (1999) 687-689.
[4] S.J. Peighambardoust, S. Rowshanzamir, M. Amjadi, Int. J. Hydrogen Energy 35 (2010) 9349-9384.
[5] T. Soboleva, X. Zhao, K. Malek, Z. Xie, T. Navessin, S. Holdcroft, ACS Appl. Mater. Interfaces 2 (2010) 375-384.
[6] J. Wu, X.Z. Yuan, J.J. Martin, H. Wang, J. Zhang, J. Shen, S. Wu, W. Merida, J. Power Sources 184 (2008) 104-119.
[7] A.B. LaConti, M. Mamdan, R. C. McDonald, Handbook of Fuel Cells, Vol. 3, W. Vielstich. H.A. Gasteiger, and A. Lamm, Editors, p. 648, John Wiley & Sons, New York (2003).
[8] M. Inaba, H. Yamada, J. Tokubaga, A. Tasaka, Electrochem. Solid-State Lett. 7 (2004) A474-A476.
[9] M. Inaba, T. Kinumoto, M. Kiriake, R. Umebayashi, A. Tasaka, Z. Ogumi, Electrochim. Acta 51 (2006) 5746-5753.
[10] X. Huang, R. Solasi, Y. Zou, M. Feshler, K. Reifsnider, D. Condit, S. Burlatsky, T. Madden, J. Polym. Sci. 16 (2006) 2346-2357.
[11] Y. Shao, G. Yin, Y. Gao, J. Power Sources 171 (2007) 558-566.
[12] A. Honji, T. Mori, K. Tamura, Y. Hishinuma, J. Electrochem. Soc. 135 (1988) 355-359.
[13] B.J. Eastwood, P.A. Christensen, R.D. Armstrong, N.R. Bates, J. Solid State Electrochem. 3 (1999) 179-186.
- 15 - 10-23.
[15] M. Hara, M. Lee, C.-H. Liu, B.-H. Chen, Y. Yamashita, M. Uchida, H. Uchida, M. Watanabe, Electrochim. Acta 70 (2012) 171-181.
[16] Y.-C. Park, K. Kakinuma, M. Uchida, D. A. Tryk, T. Kamino, H. Uchida, M. Watanabe, Electrochim. Acta 91 (2013) 195-207.
[17] C.A. Reiser, L. Bregoli, T.W. Patterson, J.S. Yi, J.D. Yang, M.L. Perry, T.D. Jarvi, Electrochem. Solid-State Lett. 8 (2005) A273-A276.
[18] H. Tang, Z. Qi, M. Ramani, J.F. Elter, J. Power Sources 158 (2006) 1306-1312. [19] Z. Siroma, N. Fujiwara, T. Ioroi, S. Yamazaki, H. Senoh, K. Yasuda, K. Tanimoto, J. Power Sources 172 (2007) 155-162.
[20] G. Maranzana, C. Moyne, J. Dillet, S. Didierjean, O. Lottin, J. Power Sources 195 (2010) 5990-5995.
[21] F. Takasaki, S. Matsui, Y. Takabatake, Z. Noda, A. Hayashi, Y. Shiratori, K. Ito, K. Sasaki, J. Electrochem. Soc. 158 (2011) B1270-B1275.
[22] A. Masao, S. Noda, F. Takasaki, K. Ito, K. Sasaki, Electrochem. Solid-State Lett. 12 (2009) B119-B122.
[23] T. Binninger, E. Fabbri, R. Kötz, T. J. Schmidt, J. Electrochem. Soc. 161 (2014) H121-H128.
[24] A. Rabis, D. Kramer, E. Fabbri, M. Worsdale, R. Kötz, T. J. Schmidt, J. Phys. Chem. C 118 (2014) 11292-11302.
[25] K. Kakinuma, M. Uchida, T. Kamino, H. Uchida, M. Watanabe, Electrochim. Acta 56 (2011) 2881-2887.
[26] K. Kakinuma, Y. Chino, Y. Senoo, M. Uchida, T. Kamino, H. Uchida, S. Deki, M. Watanabe, Electrochim. Acta 110 (2013) 316-324.
- 16 -
[28] G. Chen, S. Bare, T. Mallouk, J. Electrochem. Soc. 149 (2002) A1092-A1099. [29] T. Ioroi, T. Akita, M. Asahi, S. Yamazaki, Z. Siroma, N. Fujiwara, K. Yasuda, J. Electrochem. Soc. 158 (2011) C329-C334.
[30] T. Ioroi, T. Akita, M. Asahi, S. Yamazaki, Z. Siroma, N. Fujiwara, K. Yasuda, J. Power Sources 223 (2013) 183-189.
[31] D. Morris, Y. Dou, J. Rebane, C.E.J. Mitchell, R. G. Egdell, Phys. Rev. B 61 (2000) 13445-13457.
[32] J. Osorio-Guillen, S. Lany, A. Zunger, Phys. Rev. Lett. 100 (2008) 036601-1-4. [33] H. Chhina, D. Susac, S. Campbell, O. Kesler, Electrochem. Solid-State Lett. 12 (2009) B97-B100.
[34] H. Chhina, S. Campbell, O. Kesler, J. Electrochem. Soc. 156 (2009) B1232-B1237. [35] N.R. Elezovic, B.M. Babic, Lj. Gajic-Krstajic, V. Radmilovic, N.V. Krstajic, L.J. Vracar, J. Power Sources 195 (2010) 3961-3968.
[36] Y.-J. Wang, D.P. Wilkinson, J. Zhang, Dalton Trans. 41 (2012) 1187-1194. [37] A. Kumar, V. Ramani, J. Electrochem. Soc. 160 (2013) F1207-F1215.
[38] S.T. Oyama, The Chemistry of Transition Metal Carbides and Nitrides, Kluwer Academic Publishers (1996).
[39] I. Milosev, H. Strehblow, B. Navinsek, M. Metikos-Hukovic, Surf. Interface Anal. 23 (1995) 529-539.
[40] B. Avasarala, T. Murray, W. Li, P. Haldar, J. Mater. Chem. 19 (2009) 1803-1805. [41] B. Avasarala, P. Haldar, Energy 57 (2013) 545-553.
[42] K. Kakinuma, Y. Wakasugi, M. Uchida, T. Kamino, H. Uchida, M. Watanabe, Electrochemistry 79 (2011) 399-403.
[43] K. Kakinuma, Y. Wakasugi, M. Uchida, T. Kamino, H. Uchida, M. Watanabe, Electrochim. Acta 77 (2012) 279-284.
- 17 -
[44] A.P. Meyer, V.M. Callaghan, US Patent 6,645,650 B2 (Nov. 11, 2003).
[45] R.J. Balliet, C.A. Reiser, T.W. Patterson, M.L. Perry, US Patent 6,838,199 B2 (Jan. 4, 2005).
[46] J.H. Kim, E.A. Cho, J.H. Jang, H.J. Kim, T.-H. Lim, I.-H. Oh, J.J. Ko, S.C. Oh, J. Electrochem. Soc. 156 (2009) B955-B961.
[47] M.L. Perry, T. Patterson, C. Reiser, ECS Trans. 3 (2006) 783-795. [48] Fuel Cells Bulletin 1 (2013) 1.
[49] Fuel Cells Bulletin 11 (2014) 1.
[50] K. Kobayashi, M. Horiguchi, US Patent 7,470,481 B2 (Dec. 30, 2008).
[51] Y. Sugawara, T. Urata, T. Umeda, A. Yoshida, S. Shibata, J. Morita, US Patent 8,071,243 B2 (Dec. 6, 2011).
[52] K. Sasaki, F. Takasaki, Z. Noda, S. Hayashi, Y. Shiratori, K. Ito, ECS Trans. 33 (2010) 473-482.
[53] K. Kajihara, T. Yao, Phys. Chem. Chem. Phys. 1 (1999) 1979-1983.
[54] E. Traversa, M.L. Vona, S. Licoccia, J. Sol-Gel Sci. and Technol. 19 (2000) 193-196.
- 18 -
Chapter 2
Performance and Durability of Titanium Nitride-Supported Platinum
Catalyst Mixed with Acetylene Black as the Cathode Catalyst for
Polymer Electrolyte Fuel Cells
2.1 Introduction
The background and objectives of this research were described in Chapter 1. I will summarize them here briefly.
One of the most important issues for PEFCs is the severe degradation of cathode catalysts during startup and shutdown [1,2]. The cathode catalyst degradation is due to an intrinsic thermodynamic instability of the carbon support [3]. Therefore, great efforts have been made to develop a corrosion-resistant alternative support material to carbon [4,5]. The needed properties for the catalyst support materials are electrochemical stability at high potentials, chemical stability at low pH, high electrical conductivity and high surface area. From the point of view of the electrochemical stability and the electrical conductivity, conductive ceramics have been attracted much attention as the alternative support materials.
TiN is well known to be a conductive titanium-based ceramic, with more than a factor of ten greater electronic conductivity compared to those of metal oxides or carbons [6], in addition to chemical and electrochemical stability in acidic media [6,7]. Recently, Avasarala et al. reported that a TiN-supported Pt catalyst (Pt/TiN) showed higher catalytic activity and slightly higher durability than a Pt/CB [8,9]. Kakinuma et al. synthesized a Pt/TiN catalyst in which most of the Pt nanoparticles were hexagonal in shape, with clear faceting, and were also highly oriented on the TiN support. They reported that this catalyst showed much higher durability in the ECSA and mass
- 19 -
activity during a potential step cycling test (0.9-1.3 V vs. RHE) than a commercial Pt/CB due to the strong interaction between Pt and TiN [10,11].
I considered the highly-oriented Pt/TiN catalyst was promising for the corrosion-resistant cathode catalyst. However, the preceding studies on the Pt/TiN catalysts, including the studies by Kakinuma et al., were conducted with the thin-film RDE technique in acidic solutions. The catalyst layer of MEAs for PEFCs is essentially a gas diffusion electrode, which needs a practical electrical conductivity and gas diffusivity in order to realize a high performance. The durability can be affected by the difference in the testing condition: the catalysts are in contact with only electrolyte solution in RDE testing or ionomer and gas phase in MEA testing. Therefore, in the present work, I investigated the performance and durability of MEAs using the highly oriented Pt/TiN as the cathode catalyst. The thickness of catalyst layers in the MEAs was 5 times or more greater than that of the thin-film RDE. The electrical conductivity and gas diffusivity might become the problem in the MEAs. Therefore, I tried to control the electrical conducting pathways and gas diffusion pathways in the cathode catalyst layer by adding acetylene black (AB).
2.2 Experimental
2.2.1 Preparation of Pt/TiN catalysts
Pt/TiN catalysts were prepared with the same method described previously [10,11]. Briefly, TiN nanoparticles with 40 m2 g−1 were synthesized with a radio frequency (RF) plasma method (Nisshin Engineering Co.). Pt nanoparticles were deposited by the colloidal method [12-14]. The powder obtained was heat-treated at 400 °C in a 1% H2-containing N2 atmosphere for 2 h and then quickly cooled to room temperature
- 20 - under the same atmosphere.
The morphology of the catalysts was observed by transmission electron microscopy (TEM, H-9500, Hitachi High Technologies Co.). The average particle diameters and size distributions of Pt were confirmed to be 4.6 ± 1.6 nm from the TEM images. The Pt loading of the catalyst was measured by use of an inductively coupled plasma-mass spectrometric analyzer (ICP-MS, 7500CX, Agilent Technologies Inc.), after dissolving these Pt catalysts in hot aqua regia and were found to be 10 wt%.
2.2.2 Preparation of MEAs
Pt/TiN + AB catalyst layer was fabricated by a spray method. The Pt/TiN catalyst was mixed with AB (DENKA BLACK®, Denki Kagaku Kogyo K. K.), perfluorosulfonic acid (PFSA) solution (equivalent weight = 909 g eq−1, Asahi Glass Co., Ltd.) and solvent (mixture of water and ethanol). The volume ratio of PFSA binder (dry basis) to TiN and AB (PFSA binder/(TiN + AB)) was adjusted to 0.48. The catalyst paste obtained was directly sprayed onto the polymer electrolyte membranes (GORE-SELECT®, 30 μm, W. L. Gore & Associates Inc.) on a hot plate maintained at 60 °C to form the cathode catalyst layers. Graphitized carbon black-supported platinum (Pt/GCB) (TEC10EA50E, Tanaka Kikinzoku Kogyo K. K. (TKK)) was evaluated as a reference catalyst, because GCB has been reported to exhibit high stability at high potentials [15]. The cathode catalyst layer, which contained PFSA binder of 0.8 volume ratio to GCB, was prepared in the same manner described above. The volume ratio of the PFSA binder was adjusted considering the difference of the surface area of the materials (TiN: 40 m2 g−1, AB: 68 m2 g−1, GCB: 150 m2 g−1). The anode catalyst layers were fabricated in a similar manner using PtRu/CB (TEC61E54, TKK), PFSA solution and solvent (mixture of water and ethanol). The Pt loadings of the anode and
- 21 -
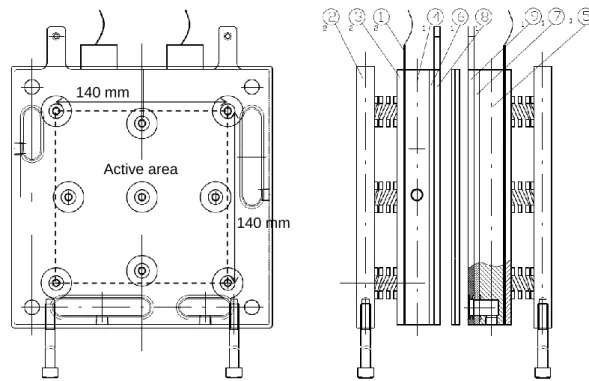
cathode were 0.1 and 0.05 mg cm−2, respectively. The Pt loading of the cathode was about ten times lower than the amount widely used, as a target for the mass-market penetration of fuel cell vehicles [16], whereas the Pt loading of the anode was maintained at the standard 0.1 mg cm−2 in order to avoid any effects of low Pt loading for the anode. The catalyst-coated membrane (CCM), having a practical-sized active area (196 cm2) was heated at 120 °C for 30 min and sandwiched between two gas diffusion layers with microporous layers (CARBEL-CL®, W. L. Gore & Associates, Inc.) to form the MEA. The MEA was mounted in a practical single cell designed for micro-CHP PEFC applications (Fig. 2-1). The single cell is equipped with carbon plates having a multi-channel serpentine flow field designed such that the pressure drop is lower than 5 kPa at 1 dm3 min−1 (anode) and 2 dm3 min−1 (cathode), because it is necessary for micro-CHP PEFCs to be operated at near-ambient pressure in order to reduce the power consumption of the air blowers.
2.2.3 Performance test of single cells
The cyclic voltammetry (CV) was measured at 65 °C from 0.08 to 1.0 V by use of a potentiostat (HZ-3000, Hokuto Denko K. K.) to evaluate the ECSA. The potential scan rate was 10 mV s−1, and fully humidified hydrogen and nitrogen were fed to the anode and cathode at a flow rate of 300 ml min−1 during the CV measurement. All of the potentials are referred to the hydrogen anode, which was assumed to approximate the reversible hydrogen electrode (RHE) potential. The ECSA was calculated by dividing the average of the electrical charge for the hydrogen adsorption and hydrogen desorption between 0.095 and 0.4 V by the hydrogen adsorption/desorption charge for clean polycrystalline Pt, 0.21 mC cm−2 [17,18]. The polarization curves were evaluated by measuring the cell voltages during constant current operations with an electronic
- 22 -
load (PLZ-664WA, Kikusui Electronics Corp.). The current density was measured up to 0.2 A cm−2, which is a typical rated operating condition for micro-CHP PEFCs. Hydrogen humidified at 65 °C was supplied to the anode at a fixed flow rate (0.390 dm3 min−1) that corresponded to 70% utilization at 0.2 A cm−2. Oxygen or air humidified at 65 °C was supplied to the cathode at fixed flow rates (1.706 dm3 min−1) that corresponded to 8% or 40% utilization, respectively, at 0.2 A cm−2. The cell temperature was maintained at 65 °C or 80 °C to evaluate the performance under fully humidified conditions (100% relative humidity, RH) or partially humidified conditions (53% RH). The cell resistance was measured with an AC milliohm-meter (MODEL3566, Tsuruga Electric Co.) at a frequency of 1 kHz during the performance evaluation. The Nyquist plots were measured with a fuel cell test load (Model 890e, Scribner Associates, Inc.) in combination with a frequency response analyzer (Model 1260A, Solartron Analytical) applying an alternating current of 5% amplitude to the current load within a frequency range from 20 kHz to 0.1 Hz.
2.2.4 Durability test of single cells
The durability test of the MEAs for simulating start/stop operation was carried out at 65 °C by the potential step cycling protocol recommended by the Fuel Cell Commercialization Conference of Japan (FCCJ) [19]. The potential was stepped between 0.9 and 1.3 V vs. the anode with a holding period of 30 s at each potential. Fully humidified hydrogen and nitrogen were fed to the anode and cathode at a flow rate of 300 ml min−1 during the potential cycles.
After a series of durability tests, cross-sections of the cathode catalyst layers were analyzed by scanning electron microscopy (SEM, S-5500, Hitachi High Technologies Co.) in order to observe the porous structures and the AB networks. The degradation of
- 23 -
AB was also analyzed by a confocal micro-Raman instrument (LabRAM HR-800 spectrometer, HORIBA Jobin Yvon, Ltd.) using the same procedure as described previously [15]. The atomic-scale observation of the interface between Pt and TiN was also carried out by use of a scanning transmission electron microscope (STEM, HD-2700, Hitachi High Technologies Co.) with an electron energy-loss spectroscopic attachment (EELS, Enfinium ER, Gatan Co.).
2.3 Results and discussion
2.3.1 Cell resistance and microstructure of catalyst layer
Figure 2-2 shows the cell resistance measured under a constant-current load at 50 mA cm−2 with an AC milliohm-meter at a frequency of 1 kHz. I confirmed that the Nyquist plots of the cell with Pt/TiN + 47 vol% AB intersected the real axis at around 1 kHz. The cell resistance using the Pt/TiN cathode was much higher than that using Pt/GCB. The TiN support particles were nanoscale cubic crystallites, without any formation of fused aggregate and showed high contact resistance between particles, even though the nanoparticles themselves show high electrical conductivity [10,11]. However, the cell resistance decreased with increasing AB content and approached that of a Pt/GCB cathode for values above 37 vol%.
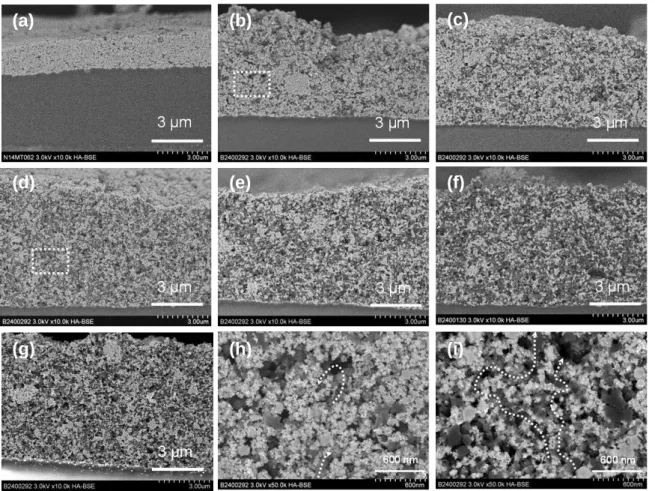
Cross-sectional images of each catalyst layer are shown in Fig. 2-3. The light gray, dark gray and black regions in each image correspond to Pt/TiN, AB and pores, respectively, and were distributed evenly in each catalyst layer. The thicknesses of the catalyst layers were well controlled from 2 μm to 8 μm. The magnified cross-sectional SEM image of the 23 vol% sample (Fig. 2-3 (h)) shows that the carbon networks are less than 1 μm in length and are dispersed in a fragmented fashion in the layer, without
- 24 -
any connection to each other. The magnified cross-sectional SEM image of the 47 vol% sample (Fig. 2-3 (i)) shows that the dispersed AB particles are in contact with each other and are able to construct longer electrically conductive networks. The electrical resistivity of composite materials tends to be dominated by the percolation law and decreases abruptly above a certain threshold [20]. The behavior of the cell resistance can be also explained by this theory.
2.3.2 ECSA and Pt utilization of Pt/TiN + AB cathodes
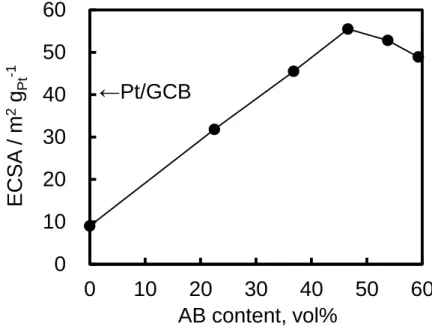
Figure 2-4 shows the cyclic voltammograms for Pt/TiN, Pt/TiN + 23 vol% AB, Pt/TiN + 47 vol% AB and Pt/GCB at 65 °C under 100% RH. The hydrogen adsorption/desorption peaks of Pt/TiN were ill-defined but became better defined by adding AB. The ECA values of the Pt/TiN + AB cathodes increased with increasing AB content up to 47 vol% (Fig. 2-5). This fact can be explained by the decrease of the number of electronically isolated catalyst particles in association with developing the electrically conductive networks with increasing AB content. It is necessary for AB to percolate only in the through-plane direction of the catalyst layer to decrease the electrical resistance. However, percolation in both the through-plane and in-plane directions is required to decrease the number of electronically isolated catalyst particles. This is the reason why the amount of AB required to reach the saturation ECSA value was greater than that required to reach the saturation cell resistance. Above 47 vol% AB, the ECSA values decreased slightly. The volume ratio of PFSA ionomer was fixed in all of the Pt/TiN + AB catalyst layers. It is considered that the decrease of ECSA for values greater than 47 vol% AB occurred because of an increase in the number of interceptions of the proton-conducting network due to the addition of excess AB with high surface area.
- 25 -
I also found that the highest ECSA value (56 m2 g−1: 47 vol% AB) was close to the geometrically estimated value (61 m2 g−1) calculated from the average Pt particle size (4.6 nm) based on TEM observation. The Pt utilization percentage (UPt), which is defined as the ratio of ECSA value estimated from the CV measurement to the Pt surface area estimated from the mean particle size, reached 92% in the MEA using a Pt/TiN + 47 vol% AB cathode. In a previous paper, our group reported that the UPt values of MEAs were strongly dependent on the state of distribution of the Pt particles on the support material, and those catalysts in which the Pt particles were distributed predominantly on the exterior surfaces of the support particles exhibited high UPt [21]. In the present catalyst layer, the TiN support particles did not contain any nanopores, and nearly all of the Pt particles existed on the TiN surface [10,11]. Thus, the UPt value for the catalyst layer using Pt/TiN was close to 100% when the electrically conducting pathways were supplied by the AB networks and the proton conducting pathways were constructed well by PFSA binder networks.
2.3.3 Polarization performance of MEAs using Pt/TiN + AB cathodes
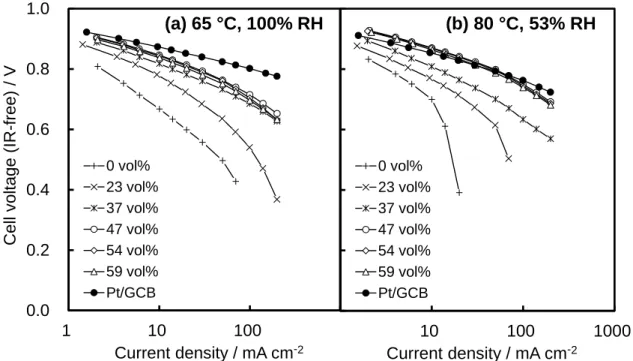
Figure 2-6 shows IR-free H2/O2 polarization curves for the MEAs using Pt/TiN cathodes with different AB content, as well as the Pt/GCB cathode. The relationship between the IR-free cell voltage and the logarithm of current density (Tafel plot) becomes linear when the reaction is controlled by a charge transfer process. The Tafel plots for Pt/GCB were linear and close to the theoretical value for the 4-electron oxygen reduction reaction (ORR) process at 65 °C (−67 mV decade−1) and 80 °C (−70 mV decade−1) [22]. On the other hand, the Tafel plots for Pt/TiN exhibited slopes that were steeper than the theoretical values and deviated from a straight line in the high current density region. The top surface of the TiN support nanoparticles is easy to
- 26 -
change to hydrophilic TiOxNy [23], suggesting that generated water could flood the Pt/TiN catalyst surface, inhibiting the oxygen mass transport. However, the Tafel slopes for the Pt/TiN + AB cathodes decreased with increasing AB content and approached that for Pt/GCB for values above 47 vol% (Fig. 2-7). This behavior can be understood by the analogy to the relationship between the cell resistance and AB content. The AB has a hydrophobic surface as well as a high electrical conductivity. The flooding of the Pt/TiN catalyst layer can be eliminated by introducing the percolated AB networks, which work as effective oxygen transport pathways due to their hydrophobic surface. I found that the hydrophilicity of the TiN surface can adversely affect the water management in the catalyst layer but that the flooding of the catalyst layer can be controlled by introducing hydrophobic materials like AB.
The apparent mass activity at 0.85 V (MA@0.85 V) for the Pt/TiN + AB cathode is plotted versus AB content in Fig. 2-8. The MA@0.85 V values increased with increasing AB content up to 47 vol% and then slightly decreased above 47 vol%. This behavior can be explained by the fact that the MA@0.85 V values varied depending on the ECSA change, because the relationship between the MA@0.85 V and AB content corresponded well to that between ECSA and AB content. The MA@0.85 V value above 47 vol% AB exceeded that of Pt/GCB at 80 °C under 53% RH. Kakinuma et al. have reported higher ORR activity of Pt/TiN compared to that of Pt/GCB by using the RDE technique [10,11]. In the present work, the practical-sized MEAs using Pt/TiN also showed higher ORR activity than that of Pt/GCB, controlling the electrical conductivity and the effect of flooding by adding AB.
I also evaluated the H2/air polarization curves of the MEAs (Fig. 2-9). The oxygen mass transport has a greater effect on the performance under this operating condition, because an excess of oxygen, 8% oxygen utilization, was supplied under H2/O2
- 27 -
operation, while a practical amount of oxygen, 40% oxygen utilization, was supplied under H2/air operation. Even at the practical oxygen utilization, the MEAs using Pt/TiN with AB contents greater than 47 vol% showed comparable performance to the MEA using Pt/GCB at 80 °C at 53% RH. I successfully demonstrated that the catalyst layer consisting of Pt/TiN catalyst with percolated AB networks is a promising system for PEFC cathodes, using the practical single cell and operating conditions for micro-CHP applications.
2.3.4 Durability of MEAs using Pt/TiN cathodes at high potentials
The durability of MEAs using Pt/TiN + AB and Pt/GCB cathodes was evaluated by means of a potential step cycling test (FCCJ protocol, 0.9-1.3 V vs. RHE; holding time, 30 s at each potential) at 65 °C under 100% RH, simulating the start/stop cycles in the PEFC. The ECSA values of these cathodes were evaluated every 100 cycles, and the H2/O2 polarization curves were measured after 3000 cycles. The MEA using Pt/TiN without AB didn’t move on to the durability test because the initial ECSA and performance were much lower than the MEA using the reference catalyst (Pt/GCB). Figure 2-10 shows the changes of ECSA during the potential step cycles as a function of the number of potential step cycles. It was difficult to calculate the ECSA value for 23 vol% AB after 1200 cycles, because the hydrogen adsorption/desorption peaks were too small. The percentages of retention of initial ECSA (0 cycles) at 3000 cycles were as follows: for AB additive contents of 37 vol%, 47 vol%, 54 vol% and 59 vol%, the retention percentages were 86%, 66%, 56%, and 61%, respectively. In contrast, the retention percentage of ECSA for commercial Pt/GCB was 16%. This indicates that Pt particles on the TiN support are more stable at high potentials than on the GCB support.
- 28 -
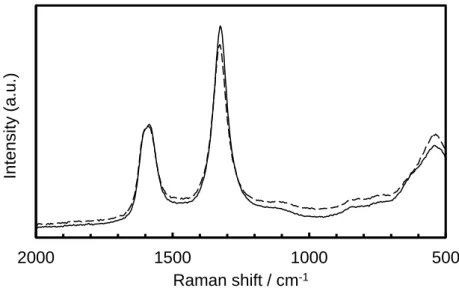
As shown in Fig. 2-11, the cell resistances of 23 vol% and 37 vol% increased after the potential cycles; however, there were no significant differences in the cell resistance for values over 47 vol%. This suggests that the added AB was not degraded during the potential cycling, because, as described in Section 2.3.2, the main electrically conductive pathways over 47 vol% are constructed by AB. Indeed, we investigated the degradation of the additive AB using the micro-Raman spectroscopic method previously reported [15]. The two characteristic peaks around 1330 and 1590 cm−1, shown in Fig. 2-12, correspond to the D (disordered graphitic lattice-graphene layer edge) and G (ideal graphitic lattice) bands, respectively. The relative peak intensity of the D band versus G band showed no significant difference during the cycle test, which means that negligible degradation occurred for the additive AB. The increase of the cell resistances for the 23-37 vol% catalyst layers can be explained by the fact that the TiN surface was oxidized, becoming poorly conductive, and the electrically conductive paths became deficient. I will discuss the oxidation of TiN in detail below.
Figure 2-13 shows the IR-free H2/O2 polarization curves of the MEAs using Pt/TiN cathodes with various AB contents, as well as the Pt/GCB cathode, after the potential cycling. Regardless of the AB contents, the performances of the Pt/TiN cathodes became nearly the same after the potential cycling. Large voltage losses were observed in the low current density region as well as in the high current density region. Many researchers have pointed out that the performance degradation of MEAs using Pt/CB cathodes during potential cycling corresponds to the degradation of ECSA, at least qualitatively [24,25]. However, the performance degradation of the MEAs using the Pt/TiN + AB cathodes was much larger than that of Pt/GCB, in spite of the less severe degradation of their ECSA values. These results indicate that the performance of the
- 29 -
Pt/TiN + AB cathodes was degraded by a mechanism other than ECSA degradation during the potential cycling.
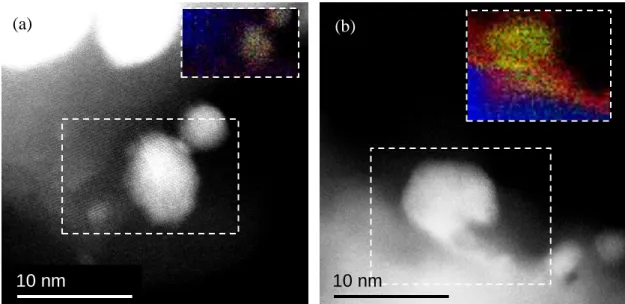
In the comparison of the SEM images of Pt/TiN + 47 vol% AB before (Fig. 4 (d)) and after (Fig. 4 (g)) the potential cycling, no significant differences in the pore structure were observed. This result indicates that there was negligible performance degradation due to a loss of mass transport properties, which would have occurred if there had been a collapse of the pores in the catalyst layer. To further investigate the performance degradation mechanism, atomic-scale STEM-EELS measurements were conducted on Pt/TiN + 47 vol% AB (Fig. 2-14). In the pristine sample, a small amount of oxygen was observed in the support material. However, after the potential cycling, an increased amount of oxygen was observed on the surface of the support material around the Pt particles. Specifically, it was found that the TiN surface around the Pt particles was oxidized to form an oxygen-rich oxynitride-like composition during the potential cycling. I consider that this oxynitride layer inhibited the electron transfer between TiN and Pt. These results suggest that the ORR activity for Pt/TiN decreased drastically during the potential cycling, because the electron transfer between Pt and TiN was inhibited by the oxygen-rich layer, which would have high electrical resistance.
2.4 Conclusions
I successfully fabricated practical-sized MEAs with well-dispersed Pt/TiN + AB cathode catalyst layers. The electrical resistance and the ECSA can be controlled by the amount of AB additives, which are dominated by the percolation law. For AB contents greater than 37 vol%, the AB networks were above the percolation threshold, so that the
- 30 -
electrical resistance reached the same level as that for Pt/GCB. The UPt value was close to 100% in the practical-sized MEA using a Pt/TiN + 47 vol% AB cathode. According to the Tafel slope analysis, it was also found that the percolated AB networks supplied effective gas transport pathways that were not flooded by generated water, thus enhancing the oxygen mass transport. The practical-sized MEA using Pt/TiN + 47 vol% AB showed 1.5 times greater apparent mass activity compared with an MEA using a commercial Pt/GCB catalyst, as well as comparable performance under practical operating conditions for micro-CHP applications.
I also investigated the durability of the MEAs using Pt/TiN + AB by means of the FCCJ’s potential cycling protocol for simulating the start/stop cycles in the PEFC. The ECSA degradation rates of the MEAs using Pt/TiN + AB cathodes were much lower than that of Pt/GCB during the potential cycling. This suggests that Pt particles on the TiN support are more stable at high potentials than those on the carbon support. However, the performances were severely degraded, becoming poorer than that for the Pt/CB after the potential cycling. It was revealed that this performance degradation was due to an oxynitride layer on the TiN surface around the Pt particles, which inhibited the electron transfer between Pt and TiN.
I conclude that catalyst layers using Pt/TiN with percolated carbon networks have excellent potential in performance, but TiN has an intrinsic instability at high potentials. From these results, I consider that the state of the titanium needs to be “oxides” in order to be stable at high potentials. I will study a titanium oxide-based support material in the next Chapter.
- 31 -
Figure 2-1 Schematic drawings of the practical single cell having 196 cm2 active area designed for micro-CHP PEFC applications; 1. Silicone rubber heater, 2. Outer end plate, 3. Heater push plate, 4. Inner end plate with inlet gas manifold, 5. Inner end plate with outlet gas manifold, 6. Insulating plate with inlet gas manifold, 7. Insulating plate with outlet gas manifold, 8. Current collector with inlet gas manifold, 9. Current collector with outlet gas manifold.
Figure 2-2 Relationship between the resistance of cells with Pt/TiN cathodes and AB content obtained with an AC milliohm-meter at a frequency of 1 kHz. The inset shows the Nyquist plots for Pt/TiN + 47 vol% AB. The cell resistances and the Nyquist plots were obtained under a constant-current load at 50 mA cm−2 in H2 (anode) and O2
(cathode) with 100% RH at 65 °C; H2 flow rate 0.390 dm3 min−1, O2 flow rate 1.706 dm3 min−1, ambient pressure.
140 mm 140 mm Active area
0.0
1.0
2.0
3.0
0
10
20
30
40
50
60
R
ce ll/
Ω
c
m
2AB content, vol%
←Pt/GCB
-1.0 -0.5 0.0 0.5 1.0 0.0 0.2 0.4 0.6 -Z " / Ω c m 2 Z' / Ω cm2 5 kHz 1 kHz 10 kHz 0.5 kHz- 32 -
Figure 2-3 SEM images of catalyst layers with different AB content: (a) 0 vol%, (b) 23 vol%, (c) 37 vol%, (d) 47 vol%, (e) 54 vol%, (f) 59 vol%, (g) 47 vol% after the
potential cycling, (h) magnified image of the dotted region in (b), (i) magnified image of the dotted region in (d). Typical electrically conductive paths (curves with arrows) are denoted in (g) and (h).
3 μm
(a) (b) (c)
(d) (e) (f)
- 33 -
Pt/TiN + 23 vol%AB Pt/TiN
Pt/TiN + 47vol%AB Pt/GCB
Figure 2-4 Cyclic voltammograms for Pt/TiN (solid line), Pt/TiN + 23 vol% AB (long dashed-dotted line), Pt/TiN + 47 vol% AB (short dashed line) and Pt/GCB (long dashed line) measured at 65 °C in N2 (cathode) and H2 (anode) with 100 % RH; potential sweep rate 10 mV s−1, H2 flow rate 0.3 dm3 min−1, N2 flow rate 0.3 dm3 min−1, ambient pressure.
0
10
20
30
40
50
60
0
10
20
30
40
50
60
EC
SA
/
m
2g
Pt -1AB content, vol%
←Pt/GCB
Figure 2-5 Relationship between the ECSA of cells with Pt/TiN cathodes and AB content at 65 °C and 100% RH.
- 34 - 0 50 100 150 200 250 0 10 20 30 40 50 60 T afel s lope / mV dec -1 AB content, vol% ←Pt/GCB 1 10 100 1000 Current density / mA cm-2 0 vol% 23 vol% 37 vol% 47 vol% 54 vol% 59 vol% Pt/GCB 0.0 0.2 0.4 0.6 0.8 1.0 1 10 100 1000 Cel l v ol tage (IR -free) / V Current density / mA cm-2 0 vol% 23 vol% 37 vol% 47 vol% 54 vol% 59 vol% Pt/GCB
Figure 2-6 IR-free H2/O2 polarization curves of Pt/TiN cathodes with different AB content and Pt/GCB cathode at (a) 65 °C and 100 % RH and (b) 80 °C and 53% RH; H2 flow rate 0.390 dm3 min−1, O2 flow rate 1.706 dm3 min−1, ambient pressure.
(a) 65 °C, 100% RH (b) 80 °C, 53% RH 0 50 100 150 200 250 T afe l s lop e / m V de c -1 ←Pt/GCB
Figure 2-7 Tafel slopes in O2 as the oxidant of Pt/TiN + AB cathodes obtained from 2 mA cm−2 to 10 mA cm−2 at (a) 65 °C and 100% RH and (b) 80 °C and 53% RH as a function of AB content.
(a) 65 °C, 100% RH
- 35 - 0 100 200 300 400 MA @ 0 .85 V / A gPt -1 ←Pt/GCB (O2) ←Pt/GCB (air) 0 100 200 300 400 0 10 20 30 40 50 60 MA @ 0 .85 V / A gPt -1 AB content, vol% ←Pt/GCB (O2) ←Pt/GCB (air) (a) 65 °C, 100% RH (b) 80 °C, 53% RH
Figure 2-8 Mass activities in O2 (solid circles) and air (open circles) as the oxidant at 0.85 V of Pt/TiN + AB cathodes obtained at (a) 65 °C and 100% RH and (b) 80 °C and 53% RH as a function of AB content. 0.0 0.2 0.4 0.6 0.8 1.0 1 10 100 1000 Cel l v ol tage (IR -free) / V Current density / mA cm-2 0 vol% 23 vol% 37 vol% 47 vol% 54 vol% 59 vol% Pt/GCB 1 10 100 1000 Current density / mA cm-2 0 vol% 23 vol% 37 vol% 47 vol% 54 vol% 59 vol% Pt/GCB (a) 65 °C, 100% RH (b) 80 °C, 53% RH
Figure 2-9 IR-free H2/air polarization curves of Pt/TiN cathodes with different AB content and Pt/GCB cathode at (a) 65 °C and 100 % RH and (b) 80 °C and 53% RH; H2 flow rate 0.390 dm3 min−1, air flow rate 1.706 dm3 min−1, ambient pressure.
- 36 -
Figure 2-10 Plots of the ECSA of the Pt/TiN cathodes with different AB content and Pt/GCB cathode as a function of the number of the potential cycling at 65 °C and 100% RH.
Figure 2-11 Relationship between the resistance of cells with Pt/TiN + AB cathodes obtained before (solid circles) and after (open circles) the potential cycling.
0.0
1.0
2.0
3.0
4.0
20
30
40
50
60
R
ce ll/
Ω
c
m
2AB content, vol%
initial
after 3000 cycles
0 10 20 30 40 50 60 0 1000 2000 3000 4000 EC S A / m 2g -1 Number of cycles, N 23 vol% 37 vol% 47 vol% 54 vol% 59 vol% Pt/GCB- 37 - 1 10 100 1000 Current density / mA cm-2 23 vol% 37 vol% 47 vol% 54 vol% 59 vol% Pt/GCB 0.0 0.2 0.4 0.6 0.8 1.0 1 10 100 1000 Cel l v ol tage (IR -free) / V Current density / mA cm-2 23 vol% 37 vol% 47 vol% 54 vol% 59 vol% Pt/GCB 500 1000 1500 2000 Int ens it y (a. u. ) Raman shift / cm-1
Figure 2-12 Raman spectra for the Pt/TiN + 47 vol% AB cathode before (solid line) and after (dashed line) 3000 cycles.
(a) 65 °C, 100% RH (b) 80 °C, 53% RH
Figure 2-13 IR-free H2/O2 polarization curves of Pt/TiN cathodes with different AB content and Pt/GCB cathode after 3000 cycles at (a) 65 °C and 100 % RH and (b) 80 °C and 53% RH; H2 flow rate 0.390 dm3 min−1, O2 flow rate 1.706 dm3 min−1, ambient pressure.
- 38 - (a)
10 nm
(b)
10 nm
Figure 2-14 HAADF STEM images and EELS element maps of platinum (green), nitrogen (blue), and oxygen (red) for Pt/TiN + 47 vol% AB cathode (a) before and (b) after the potential cycling.
- 39 - 2.5 References for Chapter 2
[1] Y. Shao, G. Yin, Y. Gao, J. Power Sources 171 (2007) 558-566.
[2] Y. Yu, H. Li, H. Wang, X. Z. Yuan, G. Wang, M. Pan, J. Power Sources 205 (2012) 10-23.
[3] B.J. Eastwood, P.A. Christensen, R.D. Armstrong, N.R. Bates, J. Solid State Electrochem. 3 (1999) 179-186.
[4] E. Antolini, E.R. Gonzalez, Solid State Ionics 180 (2009) 746-763. [5] S. Sharma, B.G. Pollet, J. Power Sources 208 (2012) 96-119.
[6] S.T. Oyama, The Chemistry of Transition Metal Carbides and Nitrides, Kluwer Academic Publishers (1996).
[7] I. Milosev, H. Strehblow, B. Navinsek, M. Metikos-Hukovic, Surf. Interface Anal. 23 (1995) 529-539.
[8] B. Avasarala, T. Murray, W. Li, P. Haldar, J. Mater. Chem. 19 (2009) 1803-1805. [9] B. Avasarala, P. Haldar, Energy 57 (2013) 545-553.
[10] K. Kakinuma, Y. Wakasugi, M. Uchida, T. Kamino, H. Uchida, M. Watanabe, Electrochemistry 79 (2011) 399-403.
[11] K. Kakinuma, Y. Wakasugi, M. Uchida, T. Kamino, H. Uchida, M. Watanabe, Electrochim. Acta 77 (2012) 279-284.
[12] M. Watanabe, M. Uchida, S. Motoo, J. Electroanal. Chem. 199 (1986) 311-322. [13] M. Watanabe, M. Uchida, S. Motoo, J. Electroanal. Chem. 229 (1987) 395-406. [14] M. Uchida, Y. Aoyama, M. Tanabe, N. Yamagihara, N. Eda, A. Ohta, J. Electrochem. Soc. 142 (1995) 2572-2576.
[15] M. Hara, M. Lee, C.-H. Liu, B.-H. Chen, Y. Yamashita, M. Uchida, H. Uchida, M. Watanabe, Electrochim. Acta 70 (2012) 171-181.
- 40 -
[17] M. Watanabe, S. Motoo, J. Electroanal. Chem. 60 (1975) 259-266. [18] M. Watanabe, S. Motoo, J. Electroanal. Chem. 60 (1975) 275-283.
[19] A. Iiyama, K. Shinohara, S. Iguchi, A. Daimaru, Membrane and catalyst performance targets for automotive fuel cells, in W. Vielstich, H. Yokokawa, H.A. Gasteiger (Eds.), Handbook of Fuel Cells, Vol. 6, Ch. 61, John Wiley & Sons, Ltd, Hoboken, NJ (2009).
[20] W. Bauhofer, J. Z. Kovacs, Comp. Sci. Tech. 69 (2009) 1486-1498.
[21] M. Uchida, Y.-C. Park, K. Kakinuma, H. Yano, D. A. Tryk, T. Kamino, H. Uchida, M. Watanabe, Phys. Chem. Chem. Phys. 15 (2013) 11236-11247.
[22] U. A. Paulus, T. J. Schmidt, H. A. Gasteiger, R. J. Behm, J. Electroanal. Chem., 495 (2001) 134-145.
[23] K.G. Grigorov, I.C. Oliveira, H.S. Maciel, M. Massi , M.S. Oliveira, Jr., J. Amorim, C.A. Cunha, Surf. Sci., 605 (2011) 775-782.
[24] Y.-C. Park, K. Kakinuma, M. Uchida, D. A. Tryk, T. Kamino, H. Uchida, M. Watanabe, Electrochim. Acta 91 (2013) 195-207.
[25] Y.-C. Park, K. Kakinuma, M. Uchida, H. Uchida, M. Watanabe, Electrochim. Acta 123 (2014) 84-92.
- 41 -
Chapter 3
Performance
and
Durability
of
Tantalum-doped
Titanium
Dioxide-Supported Platinum Catalyst with Fused Aggregate Structure
as the Cathode Catalyst for Polymer Electrolyte Fuel Cells
3.1 Introduction
In Chapter 2, I investigated the performance and durability of the MEAs using Pt/TiN mixed with AB as the cathode catalyst layers. I found that it is necessary for the Pt/TiN catalyst layer to be mixed with the AB to achieve a practical electrical conductivity due to the high contact resistance of the Pt/TiN. The MEA using Pt/TiN + 47 vol% AB showed 1.5 times greater apparent mass activity and a comparable performance under a practical operating condition of PEFCs, compared with the MEA using a commercial Pt/GCB catalyst. However, the performance was severely degraded after a potential cycling due to the formation of oxynitride on the TiN surface around the Pt particles, which inhibited the electron transfer between Pt and TiN. From these results, I considered that the morphology of the support material have to be improved to reduce the contact resistance, and the state of the titanium is needed to be “oxides” in order to be stable under the potential conditions of startup and shutdown.
TiO2 shows excellent chemical and electrochemical stability in acidic media, but the electronic conductivity appears to be insufficient. There are two strategies for enhancing the electrical conductivity, which are creating oxygen deficiencies and introducing appropriate donor dopants into the TiO2 lattice. Some researchers pointed out the surface transformation of titanium suboxides into TiO2 at high potentials [1,2], as I observed in the case of TiN. Therefore, I considered metal-doped TiO2 is favorable to a corrosion-resistant support material. Especially, I paid attention to Ta-doped TiO2,
- 42 -
because Ta has favorable properties for the dopant, such as the function as an n-type dopant, high solubility into the TiO2 lattice [3] and the electrochemical stability of Ta2O5 at high potentials [4].
Recently, Ta-doped TiO2 has attracted much attention as transparent conducting oxide (TCO) because of its superior optical and electrical properties [5,6,7]. Hitosugi et al. reported the electrical resistivity and the optical transparency of the epitaxial growth anatase Ta-doped TiO2 films by the pulsed laser deposition (PLD) [5]. The minimum resistivity of 2.5 × 10⁻⁴ Ω cm and the internal transmittance of 95% in the visible light region were achieved at the Ta dopant levels of 5 atom%. Bawaked et al. studied the resistivity and the charge carrier concentration of anatase Ta-doped TiO2 films synthesized aerosol assisted chemical vapor deposition (AACVD) [7]. The resistivity decreased and the charge carrier concentration increased with increasing the Ta dopant level up to 6 atom%. Most of the studies on Ta-doped TiO2 were conducted by use of thin films deposited on substrates. However, the morphology should be nanoparticles in order to apply to catalyst support materials for PEFCs.
Kakinuma et al. synthesized Nb-doped SnO2 and Sb-doped SnO2 nanoparticles with fused aggregate structure by the flame oxide synthesis method and reported promising ORR activities using these materials as supports for Pt catalyst [8,9]. Senoo et al. investigated the Pt/Nb-doped SnO2 catalyst from the view point of the morphology and concluded that a chain-like fused aggregate structure and the presence of well dispersed Pt nanoparticles are preferred for the enhancement of the ORR activity [10]. These results suggest that it is important to form the morphology of metal oxide support nanoparticles into fused aggregate structure in order to achieve high ORR activity.
In this Chapter, I synthesized Ta-doped TiO2 nanoparticles with fused aggregate structure by the flame oxide synthesis method and investigated the performance and
- 43 -
durability of Pt/Ta-doped TiO2 with fused aggregate structure as cathode catalysts for PEFCs. First, I designed the electrical conductivity and the ORR activity, controlling the amount of Ta doping and the heat treatment temperature. Then, I investigated the performance and durability of MEAs using the Pt/Ta-doped TiO2 with fused aggregate structure as cathode catalysts.
3.2 Experimental
3.2.1 Preparation of Pt/Ta-doped TiO2 catalysts
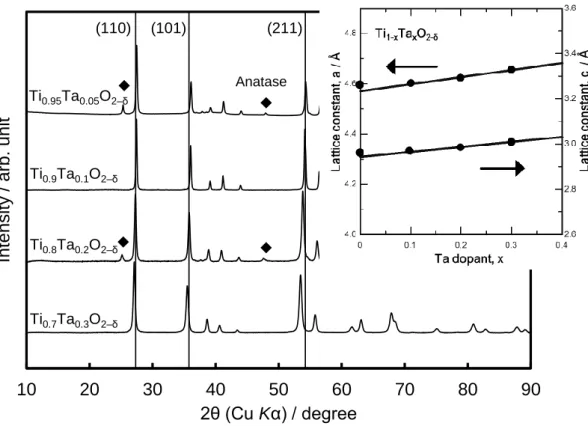
Ta-doped TiO2 nanoparticles with a fused aggregate structure were synthesized by a flame oxide-forming method [8-10]. Titanium 2-ethylhexanoate and tantalum 2-ethylhexanoate were mixed and dissolved in terpene oil. The mixing ratio was controlled to four different Ti:Ta mole ratio of 95:5, 90:10, 80:20 and 70:30. The solution was mixed by a magnetic stirrer for 2 h at room temperature. The solutions obtained were supplied to an atomizer at a rate of 3.0 g min−1 by a peristaltic pump and were injected into a flame with oxygen gas at a rate of 5.0 L min−1. The temperature of the flame, which was generated by propane (1.0 L min−1) and oxygen (9.0 L min−1), was about 1000 °C, as measured by an infrared-ultraviolet radiation thermometer (IR-CAQ2CS, Chino Co.). The gas flow rates mentioned above were maintained constant for all samples to unify the oxidation conditions. The entire synthesis procedure lasted for about 1 hour, and ca. 10 g of powder was collected with a high efficiency particulate air (HEPA) filter. The powder obtained was heat-treated at 850 °C in a 4% H2-containing N2 atmosphere for 2 h and then quickly cooled to room temperature under the same atmosphere. Thus, we obtained Ti1-xTaxO2–δ (x=0.05, 0.1, 0.2, 0.3) nanoparticles. Pt nanoparticles were deposited on the Ti1-xTaxO2–δ by the
![Figure 1-3 Generation mechanism of the reverse current during the startup process [17]](https://thumb-ap.123doks.com/thumbv2/123deta/7694945.1216870/12.892.154.754.467.731/figure-generation-mechanism-reverse-current-startup-process.webp)