Japan Advanced Institute of Science and Technology
JAIST Repository
https://dspace.jaist.ac.jp/
Title
The Effect of Silence Feature in Dimensional
Speech Emotion Recognition
Author(s)
Atmaja, Bagus Tris; Akagi, Masato
Citation
Proc. 10th International Conference on Speech
Prosody 2020: 26-30
Issue Date
2020-05-25
Type
Conference Paper
Text version
publisher
URL
http://hdl.handle.net/10119/16290
Rights
Copyright (C) 2020 International Speech
Communication Association. Bagus Tris Atmaja and
Masato Akagi, Proc. 10th International Conference
on Speech Prosody 2020, 2020, pp.26-30.
http://dx.doi.org/10.21437/SpeechProsody.2020-6
Description
The Effect of Silence Feature in Dimensional Speech Emotion Recognition
Bagus Tris Atmaja
1,2, Masato Akagi
21
Sepuluh Nopember Institute of Technology, Surabaya, Indonesia
2Japan Advanced Institute of Science and Technology, Nomi, Japan
bagus@ep.its.ac.id, akagi@jaist.ac.jp
Abstract
Silence is a part of human-to-human communication, which can be a clue for human emotion perception. For automatic emotion recognition by a computer, it is not clear whether silence is use-ful to determine human emotion within a speech. This paper presents an investigation of the effect of using silence feature in dimensional emotion recognition. Since the silence feature is extracted per utterance, we grouped the silence feature with high statistical functions from a set of acoustic features. The result reveals that the silence features affect the arousal dimen-sion more than other emotion dimendimen-sions. The proper choice of a threshold factor in the calculation of silence feature im-proved the performance of dimensional speech emotion recog-nition performance, in terms of a concordance correlation coef-ficient. On the other side, improper choice of that factor leads to a decrease in performance by using the same architecture. Index Terms: speech emotion recognition, dimensional emo-tion, silence feature, silence threshold, affective computing
1. Introduction
One of the elements of human to computer communication is the perception, which is implemented as automatic recognition in computers. Perception is the application’s ability to con-sume, organize, and classify information about the user’s phys-ical and digital, and current and historphys-ical context. Perceptual data includes things like location, date, time, mood, expres-sion, environment, physiological responses, connected applica-tions, networks, and nearby devices [1]. Due to this difference with human communication, especially on processing the data, the processing mechanism to obtain perceptual data on human– to–machine communication may be different from human–to– human communication.
Emotion is one of human perceptions. The difference be-tween emotion and mood is that emotions are short-lived feel-ings that come from a known cause, while moods are feelfeel-ings that are longer lasting than emotions and often without appar-ent cause [2]. Emotions can range from happy, ecstatic, sad, and prideful in the category, while moods are either positive or negative. Emotion also can be described in a degree of valence, arousal, and dominance. Other researchers used liking [3] and expectancy [4] as additional dimensions or attributes to those dimensional emotions.
Valence (V) is the pleasantness of the stimulus [pleasure (P)], ranges from positive (extreme happy) to negative (extreme unhappy). In other words, it is also known as “sentiment” or “semantic orientation” [5]. Arousal or activation (A) is the intensity of emotion provoked by the stimulus, ranges from sleepiness to excitement. The dominance (D) or power dimen-sion refers to the degree of power or sense of control over the emotion [6]. This three-dimensional emotion model is known as VAD or PAD model [7].
The concept of verbal communication is by conveying ver-bal words. However, some researchers reported that the use of non-verbal words, i.e., pause or silence, is needed for better hu-man communication. Adding pause to emotional speech affects the recognition rate by human participants. Furthermore, si-lence and other disfluencies are not only useful for human com-munication but also can be effective cues for the computer to recognize human emotion [8].
An investigation on how speech pause length influences how listeners ascribe emotional states to the speaker has been done by authors in [9]. The author manipulated the length of speech pauses to create five variants of all passages. The partic-ipants were asked to rate the emotionality of these passages by indicating on a 16 point scale how angry, sad, disgusted, happy, surprised, scared, positive, and heated the speaker could have been. The data reveal that the length of silent pauses influences listeners in attributing emotional category to the speaker. Their findings argue that pauses play a relevant role in ascribing emo-tions and that this phenomenon might be partly independent of language.
Different from human to human communication, human to machine communication (or human-machine interaction, HMI) is a form of communication where humans interact with a vari-ety of devices like sensors and actuators, or generally the com-puter. Although the silence aforementioned is useful for human emotion perception, it is still unclear whether it is useful or not for human to machine communication. One of the clue for this question is a study by Tian et al. [8], [4], which used disfluen-cies and other non-verbal vocalizations as features for speech emotion recognition. Their results indicated that disfluencies and non-verbal vocalizations provide useful information over-looked by the other two types of features for emotion recog-nition: lexical and acoustic features. However, instead of us-ing silences or pauses, they used filler pauses, fillers, stutters, laughter, breath, and sigh within an utterance to extract those features.
Instead of using silence feature, Atmaja and Akagi [10, 11] removed silence within speech and extract acoustic features from the speech region after silence removal. Their results show an improvement of emotion category detection on an emotional speech dataset by utilizing silence removal and attention model. However, this method may slightly corrupts the speech fluency, because it generated a context of audio samples artificially.
The contribution of this paper is the investigation of the use of silence as a feature in automatic dimensional speech emotion recognition (SER). For each utterance, a number of frames are calculated and checked whether those frames can be categorized as silence. The fraction of the number of silence frames over total frames is measured as a silence feature. This silence fea-ture is grouped with high statistical function (HSF), i.e., mean and standard deviation, of an acoustic feature set as the input to speech emotion recognition system. The comparison of HSF
10th International Conference on Speech Prosody 2020 25-28 May 2020, Tokyo, Japan
Table 1: GeMAPS feature [13] and its functionals used for di-mensional SER in this research.
LLDs loudness, alpha ratio, hammarberg index, spec-tral slope 0-500 Hz, specspec-tral slope 500-1500 Hz, spectral flux, 4 MFCCs, F0, jitter, shim-mer, Harmonics-to-Noise Ratio (HNR), Har-monic difference H1-H2, HarHar-monic difference H1-A3, F1, F1 bandwidth, F1 amplitude, F2, F2 amplitude, F3, and F3 amplitude.
HSFs mean (of LLDs), standard deviation (of LLDs), silence
with and without silence feature can be used to determine the ef-fect of silence feature on dimensional speech emotion recogni-tion. The measure of comparison was given by the concordance correlation coefficient (CCC) [12].
2. Acoustic and silence features
2.1. Acoustic feature set
Acoustic features are the input to an SER system. One of the acoustic feature sets proposed for SER is called Geneva Min-imalistic Acoustic Parameter Set (GeMAPS), which is devel-oped by Eyben et al. [13]. Those acoustic features extracted on frame-based processing are often called as Low-Level De-scriptors (LLD). This frame-based processing is common in other speech processing applications. Other researchers [14] proposed to ex tract functional features on certain lengths, e.g., 100 ms, 1 s, or per utterance/turn depend on the given labels. These functional features is often called as High-Level Statis-tical Functions (HSF). The reason for using HSF is to roughly describe the temporal and contour variations of different LLDs during certain period/utterance [15]. Assuming that emotional content lies temporal variations rather than LLDs, HSFs may give a more accurate performance in determining emotional state from speech. Schmitt et al. suggested that using mean and standard deviation (std) from a set of acoustic features (GeMAPS) performed better than LLDs on speech emotion recognition [16]. We used these mean and std features, which are extracted per utterance from LLDs in GeMAPS feature set (2 × 23 features). To add those functionals, we proposed to use a silence feature, which is also extracted per utterance. The computation of a silence feature is explained below.
2.2. Silence feature
Silence, in this paper, is defined as the portion of the silence frames compared to the total frames in an utterance. In human communication, this portion of silence in speaking depends on the speaker’s emotion. For example, a happy speaker may have fewer silences (or pauses) than a sad speaker. The portion of silence in an utterance can be calculated as
S = Ns Nt
, (1)
where Nsis the number of frames to be categorized as silence
(silence frames), and Nt is the number of total frames within
an utterance. To be categorized as silence, a frame is checked whether it is less than a threshold, which is a multiplication of a factor with a root mean square (RMS) energy (Xrms).
Math-ematically, it can be formulated
th = α× Xrms (2) and Xrmsis defined as Xrms= v u u t 1 n n ∑ i=1 x[i]2 (3)
These equations are similar to what is proposed in [17]. The author of that paper used a fixed threshold, while we evaluated some factors of α to find the best factor for silence feature in speech emotion recognition. The equation 1 to calculate the silence feature is also similar to the calculation of the disfluency feature proposed in [4]. In that paper, the author divides the total duration of disfluency over the total utterance length on n words. Fig. 1 shows the calculation of our silence feature. If Xrms from a frame is below the th, then it is categorized as
silence and follow the calculation of the equation 1.
...
Figure 1: The moving frame to calculate a silence feature
3. Experiments
3.1. Dataset
The “Interactive Emotional dyadic MOtion CAPture” (IEMO-CAP) database, collected by the Speech Analysis and Interpre-tation Laboratory (SAIL) at the University of Southern Califor-nia (USC) was used to investigate the effect of silence feature on dimensional SER. This dataset consists of multimodal measure-ment of speech and gesture, including markers of the face, head, and hands, which provide detailed information about facial ex-pressions and hand movements during a dyadic conversation. Among those modalities, only speech utterance is used. The total utterances are 10039 turns with three emotion attributes: arousal, valence, and dominance. The average turn duration is 4.5 s with average 11.4 words per turn. The annotations are rated by at least two evaluators per utterance. The evaluators were USC students. We used emotion dimensions scores aver-aged from those two annotators as gold-standard labels in the experiments. The detail of that pilot study for developing the dataset can be found in [18].
3.2. Speech emotion recognition system
SER is an attempt to make the computer recognize emotional states in speech. A deep neural network (DNN)-based SER is the common approach in recent days. Among numerous DNN methods, convolutional neural network (CNN) and LSTM are
the most common [14], [15]. We choose an LSTM-based di-mensional SER due to its simplicity and the hardware support (CuDNN [19]). This architecture is a modification from the pre-vious LSTM-based SER system reported in [20] by enlarging the size of networks and using different parameters for multi-task learning.
For the input features, three sets of acoustic features are evaluated. These features are GeMAPS feature set (baseline); mean and std of GeMAPS (mean+std); and mean, std, and si-lence (mean+std+sisi-lence) features. The features in GeMAPS are extracted in 25 ms and 10 ms of the window and hop lengths using openSMILE feature extraction toolkit [21]. Mean, std, and silence are extracted per utterance. The silence feature is extracted per utterance from 2048 samples of time frame length (128 ms) and 512 samples of hop length (32 ms) with 16000 Hz of sampling frequency. The implementation of silence fea-ture computation was performed using LibROSA python pack-age [22]. Those features are evaluated to the same architecture, shown in Fig. 2, which is implemented using Keras toolkit [23]. Each frame shown in that figure represents a time frame to cal-culate Xrmsand to check whether it is a silence (if it is greater
than th) or not.
The first layer on the dimensional SER system on that fig-ure is the batch normalization layer. This layer is intended to accelerate deep network training, as suggested in [24]. The size of the batch normalization layer depends on the input fea-tures. GeMAPS has the size of the nodes of (3409 × 23) for IEMOCAP dataset, mean+std has a size of (1 × 46), and mean+std+silence has a size of (1 × 47). After a batch nor-malization layer, we stacked three LSTM layers (unidirectional, 512 nodes each) and flattened the output of the last LSTM layer. Three dense layers with each size of 1 are connected to Flat-ten layer to predict the degree of valence, arousal, and domi-nance. The degree of those emotion dimensions is a floating-point value ranges from [-1, 1], converted from the original 5-point scale. The total size of the networks (trainable parameters) depends on the input features, about 10 million for GeMAPS input, and about 5 million for mean+std and mean+std+silence inputs.
For each input feature set, a number of 100 epochs were performed with earlystopping callbacks with a number of 10 patiences. This means, if the training process did not find an improvement of performance after 10 epochs, it will stop and save that best model for evaluation. To obtain a consistent/same result on each run, the same fixed random number is initiated at the top of the SER computer programs.
To measure the performance, a correlation measure, namely CCC, is used. This CCC is a measure of relation between pre-diction and true dimensional emotion degree (valence, arousal, dominance), which penalizes the score if the prediction shifts the true value. Instead of using a single value, we measure CCC for each emotion dimension. This method enables us to ana-lyze which emotion dimension relates to specific features. The cumulative performance for all three dimensions can be given in an average of three CCC scores. The fair comparison can be performed between mean+std and mean+std+silence feature inputs, as it only has a difference in input size by a single value (46 vs. 47).
4. Results and discussion
4.1. Effect of silence feature on dimensional SER
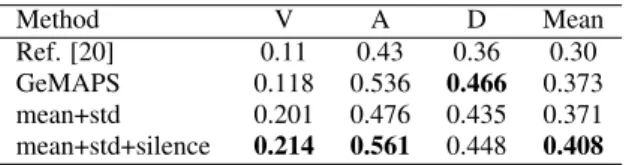
Although it is stated previously that the fair comparison could be made by comparing results from mean+std vs. mean+std+silence, for the sake of research continuity, the re-sult from the previous reported rere-sult [20] and GeMAPS fea-ture are presented as baselines. Both kinds of research used the same SER architecture and the same input with different size of network (64 vs. 512 nodes for each LSTM layer). By us-ing larger networks and different multitaskus-ing coefficients, an improvement of arousal has been obtained on GeMAPS feature input, while the CCC scores of both valences and dominance are similar. Our approach adopted multitask learning to train simul-taneously valence, arousal, and dominance from [25]. Here, the coefficients (weighting factors) used for valence, arousal, and dominance are 0.1, 0.5, and 0.4, respectively. Table 2 shows the obtained CCC score for each emotion dimension and its average score from different methods.
Using HSFs of LLDs from GeMAPS, i.e., mean and std of 23 acoustic features, an improvement of valence was obtained. However, the CCC score of arousal and dominance decreased, although the average CCC score remains the same. This type of input feature (mean+std) has a smaller number of dimensions (1 × 46) compared to GeMAPS feature (3409 × 23). The size of the network of input with mean+std also about half of the network of GeMAPS input.
On the last method in Table 2, a silence feature was com-bined with std+mean resulting (1 × 47) of input size. This small modification leads to improvements in valence and arousal among other methods. A CCC score for this mean+std+silence input for dominance has decreased compared to GeMAPS, but slightly higher than mean+std. Both CCC scores on valence and arousal improved with 6% and 17% relative improvement. This result suggests that the silence feature affects arousal (active-ness of speech) more than other dimensions. This finding may follow that humans tend to use more pauses in speech when they are sad and fewer pauses when they are happy.
To extend this investigation, an evaluation of the silence threshold factors (α) was performed and discussed below. Table 2: Results of dimensional emotion recognition by various methods measured in CCC scores; V: valence; A: arousal; D: dominance. Method V A D Mean Ref. [20] 0.11 0.43 0.36 0.30 GeMAPS 0.118 0.536 0.466 0.373 mean+std 0.201 0.476 0.435 0.371 0.214 0.561 0.448 0.408 mean+std+silence
4.2. Evaluation of silence threshold factors
Most studies on silent pauses used threshold as one of the ob-jects of study [26], [27]. Those studies categorized thresholds in silent pause into two groups: low threshold (200 ms) and high threshold (2000 ms). However, the definition of the threshold used here is different from those researches. The threshold in this research is defined as the upper-bound of RMS energy of a frame to be categorized as silence (equation (2)).
The silence threshold factor (α) in equation (2) plays an important role in determining whether a frame belongs to the silence category. To investigate the effect of this factor on
- mean
- std
-
silence
(47)
LSTM
(512)
LSTM
(512)
LSTM
(512)
Batch
Normalization
(1,47)
Flatten
()
Dense (1)
Dense (1)
Dense (1)
valence
arousal
dominance
Figure 2: Structure of dimensional SER system to investigate the effect of silence features; the number inside the bracket represents the number of nodes/units. th,α=0.4 th,α=0.3 th,α=0.2 th,α=0.1 Xrms frames Xrms
Figure 3: RMS energy of corresponding frames with Xrmsand
threshold lines for different silence threshold factors.
dimensional SER performance, we variate the α to 0.4, 0.3, 0.2, and 0.1. The result obtained in the previous Table 2 with mean+std+silence input was obtained using α = 0.3.
Fig. 3 shows the example of an utterance, its Xrmsof
cor-responding frame, Xrms, and three lines of threshold using
dif-ferent silence threshold factors. As shown in that figure, using α = 0.4may result in an incorrect decision to include speech as silence. However, using a low silence threshold factor, e.g., α = 0.1, leads to a smaller number of silence frames due to a tight filter. An evaluation to choose the proper factor is needed to obtain the optimal silence feature for dimensional SER.
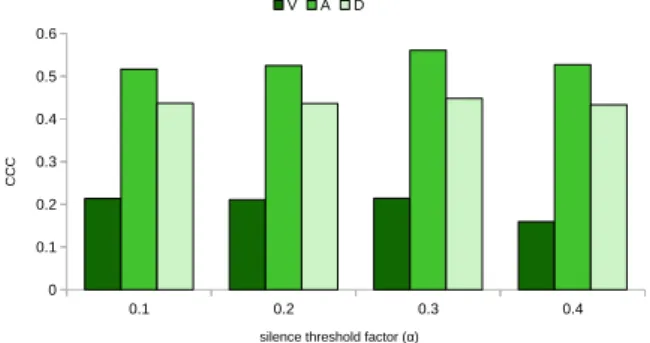
Fig. 4 shows the effect of changing the silence threshold factor to the CCC score of valence, arousal, and dominance. Using a higher factor will impact on increasing the number of silence frames. On the other side, using a smaller factor will decrease the possibility to count a frame as a silence. As can be seen in that figure, the best CCC score was obtained using α = 0.3.
The result shown on Fig. 4 also supports the finding that the silence affects the performance of predicting arousal. Using α = 0.1, α = 0.2, and α = 0.3 shows no difference on valence and dominance (0.21 and 0.43), but on arousal dimension. The CCC scores on arousal dimension are 0.51, 0.52, and 0.56 for α = 0.1, α = 0.2, and α = 0.3, respectively. Using α = 0.4 decreases the CCC scores of three emotional dimensions. This high silence threshold factor may select non-silence frames as silence frames. The average CCC scores for this α variation are 0.389, 0.392, 0.408, and 0.373 for α = 0.1, α = 0.2, α = 0.3, and α = 0.4, respectively. These results also suggest that using improper silence threshold factor will decrease the performance of dimensional SER, especially on the arousal dimension.
0.1 0.2 0.3 0.4 0 0.1 0.2 0.3 0.4 0.5 0.6 V A D
silence threshold factor (α)
CCC
Figure 4: Evaluation of different silence threshold factors (α) and its impact on CCC score of valence, arousal, and domi-nance.
5. Conclusions
In this paper, we investigate the effect of using silence fea-ture on the dimensional speech emotion recognition. The result reveals that using mean+std+silence features affects the CCC score of predicted emotion degree compared to mean+std fea-tures. Using a proper factor of silence threshold, a remark-able improvement of CCC scores was obtained, particularly on arousal (activation) dimension. This can be explained that passiveness or activeness in speech, which reflected by num-ber of pauses/silences in speech, contribute to arousal degree, as expected. On the other side, the use of improper silence threshold may decrease the performance of arousal. Using a fixed random number to initiate the computation of dimensional speech emotion recognition (same number for both mean+std and mean+std+silence for all architectures), the consistent re-sults were obtained to support that finding on effect of silence on dimensional speech emotion recognition.
There are some issues which need to be confirmed for the future research. Although we obtained improvements in all emotion dimensions by using mean+std+silence from mean+std, the relationship between silence features with va-lence and dominance dimensions needs to be verified. The re-lation between positive and negative emotion dimensions with silence features is also meriting further study., e.g., more silence features with more valence, arousal, and dominance.
6. References
[1] J. Sukis and L. Lawrence, “The human-to-machine com-munication model,” https://developer.ibm.com/articles/cc-design-cognitive-models-machine-learning/, Jan 2018, Accessed: 15-May-2019.
[2] K. R. Scherer et al., “Psychological models of emotion,” The
ropsychology of emotion, vol. 137, no. 3, pp. 137–162, 2000. [3] F. Ringeval, B. Schuller, M. Valstar, N. Cummins, R. Cowie,
L. Tavabi, M. Schmitt, S. Alisamir, S. Amiriparian, E.-M. Mess-ner et al., “Avec 2019 workshop and challenge: state-of-mind, de-tecting depression with ai, and cross-cultural affect recognition,” in Proceedings of the 9th International on Audio/Visual Emotion Challenge and Workshop, 2019, pp. 3–12.
[4] J. D. Moore, L. Tian, and C. Lai, “Word-level emotion recognition using high-level features,” in International Conference on Intelli-gent Text Processing and Computational Linguistics. Springer, 2014, pp. 17–31.
[5] D. Jurafsky and J. H. Martin, Speech and language processing, 3rd ed. (Draft of September 11, 2018). Retrieved March, 2018. [6] H. Gunes and M. Pantic, “Automatic, dimensional and continuous
emotion recognition,” International Journal of Synthetic Emo-tions (IJSE), vol. 1, no. 1, pp. 68–99, 2010.
[7] A. Mehrabian and J. A. Russell, An approach to environmental psychology. the MIT Press, 1974.
[8] L. Tian, C. Lai, and J. Moore, “Recognizing emotions in dialogues with disfluencies and non-verbal vocalisations,” in Proceedings of the 4th Interdisciplinary Workshop on Laughter and Other Non-verbal Vocalisations in Speech, vol. 14, 2015, p. 15.
[9] E. Tislj´ar-Szab´o and C. Pl´eh, “Ascribing emotions depending on pause length in native and foreign language speech,” Speech Com-munication, vol. 56, no. 1, pp. 35–48, 2014.
[10] B. T. Atmaja and M. Akagi, “Speech emotion recognition based on speech segment using lstm with attention model,” in 2019 IEEE International Conference on Signals and Systems (IC-SigSys). IEEE, 2019, pp. 40–44.
[11] B. T. Atmaja, K. Shirai, and M. Akagi, “Speech emotion recogni-tion using speech feature and word embedding,” in 2019 Asia-Pacific Signal and Information Processing Association Annual Summit and Conference (APSIPA ASC), Nov 2019, pp. 519–523. [12] L. Lawrence I-kuei, “A concordance correlation coefficient to
evaluate reproducibility,” Biometrics, pp. 255–268, 1989. [13] F. Eyben, K. R. Scherer, B. W. Schuller, J. Sundberg, E. Andr´e,
C. Busso, L. Y. Devillers, J. Epps, P. Laukka, S. S. Narayanan et al., “The geneva minimalistic acoustic parameter set (gemaps) for voice research and affective computing,” IEEE Transactions on Affective Computing, vol. 7, no. 2, pp. 190–202, 2015. [14] M. Schmitt, N. Cummins, and B. Schuller, “Continuous emotion
recognition in speech–do we need recurrence?” Training, vol. 34, no. 93, p. 12, 2019.
[15] S. Mirsamadi, E. Barsoum, and C. Zhang, “Automatic speech emotion recognition using recurrent neural networks with local attention,” in 2017 IEEE International Conference on Acoustics, Speech and Signal Processing (ICASSP). IEEE, 2017, pp. 2227– 2231.
[16] M. Schmitt and B. Schuller, “Deep recurrent neural networks for emotion recognition in speech,” in Proceedings DAGA, vol. 44, 2018, pp. 1537–1540.
[17] G. Sahu, “Multimodal speech emotion recognition and ambiguity resolution,” arXiv preprint arXiv:1904.06022, 2019.
[18] C. Busso, M. Bulut, C.-C. Lee, A. Kazemzadeh, E. Mower, S. Kim, J. N. Chang, S. Lee, and S. S. Narayanan, “Iemocap: Interactive emotional dyadic motion capture database,” Language resources and evaluation, vol. 42, no. 4, p. 335, 2008.
[19] S. Chetlur, C. Woolley, P. Vandermersch, J. Cohen, J. Tran, B. Catanzaro, and E. Shelhamer, “cudnn: Efficient primitives for deep learning,” arXiv preprint arXiv:1410.0759, 2014.
[20] B. T. Atmaja, R. Elbarougy, and M. Akagi, “RNN-based di-mensional speech emotion recognition,” in ASJ Autum Meeting. Acoustical Society of Japan, 2019, pp. 743–744.
[21] F. Eyben, F. Weninger, F. Gross, and B. Schuller, “Recent devel-opments in opensmile, the munich open-source multimedia fea-ture extractor,” in Proceedings of the 21st ACM international con-ference on Multimedia. ACM, 2013, pp. 835–838.
[22] B. McFee, V. Lostanlen, M. McVicar, A. Metsai, S. Balke, C. Thom, C. Raffel, D. Lee, F. Zalkow, K. Lee, and et al., “li-brosa/librosa: 0.7.1,” Oct 2019.
[23] F. Chollet et al., “Keras,” https://keras.io, 2015.
[24] S. Ioffe and C. Szegedy, “Batch normalization: Accelerating deep network training by reducing internal covariate shift,” in 32nd In-ternational Conference on Machine Learning, 2015, pp. 448–456. [25] B. T. Atmaja and M. Akagi, “Multitask learning and multi-stage fusion for dimensional audiovisual emotion recognition,” in ICASSP, IEEE International Conference on Acoustics, Speech and Signal Processing Proceedings (to appear), 2020.
[26] E. Campione and J. V´eronis, “A large-scale multilingual study of silent pause duration,” in Speech prosody 2002, international conference, 2002.
[27] R. Rose, “Silent and filled pauses and speech planning in first and second language production,” TMH-QPSR, p. 49, 2017.
![Table 1: GeMAPS feature [13] and its functionals used for di- di-mensional SER in this research.](https://thumb-ap.123doks.com/thumbv2/123deta/6084372.1074576/3.892.467.808.416.627/table-gemaps-feature-functionals-used-mensional-ser-research.webp)