Applicability of the Reflection Index of Respiration Based
on Heart Rate Variability Analysis to Firefighting Activity
Yushi Ito
1, Yasushi Oka
2and Yukihisa Kuriyama
31Nohmi Bosai Ltd, Japan
2Faculty of Environment and Information Sciences, Yokohama National University, Japan 3Department of Systems Innovation, School of Engineering, The University of Tokyo, Japan
ABSTRACT
Firefighting is one of the most physically demanding and hazardous occupations in any country. When the firefighting activity continues for extended periods of time, firefighters are at risk for a decline in their physical and mental work ability. To ensure their safety, it is important for firefighters to be knowledgeable regarding their own physical condition.
We have introduced an index of cardiorespiratory load that reflects respiratory metabolism state, the reflection index of respiration (RIR). This index is derived based on data, obtained under designed load activities, performed in a shuttle run test and bicycle ergometer test. Therefore, the applicability and effectiveness of this index to activities involving severe physical activities at a firefighting site, have not yet been evaluated.
The RIR was applied in a simulated firefighting activity test, conducted according to a standardized protocol. This standardized firefighting test protocol consisted of 13 activities and required continuous physical activity for 26 min.
The following results were obtained. First, RIR showed a good response to load intensity even when the activity loads varied irregularly in time. Second, the variation of the RIR demonstrated a good correlation, both, with the respiratory metabolic state and the blood lactate levels. Third, the RIR presented high sensitivity in response to firefighters’ changes in body movements and respiration, during the simulated firefighting activity test.
The proposed index, providing objective information that supplements a firefighter’s subjective assessment of his or her own physical state, could be applied in the prevention of overexertion and is expected to improve the occupational safety of firefighters.
Keywords: Firefighter, Heart Rate Variability, Simulated Firefighting Activity Test, Frequency Analysis, Reflection Index of Respiration
Corresponding to: Yasushi Oka, Email: [email protected]
■ Research Paper ■
Received June 25, 2019 Accepted May 30, 2020
1. INTRODUCTION
Firefighting is a hazardous occupation with the potential for exposure to severe physiological and thermal hazards [1-2]. Firefighting activity exercised over a prolonged period, results in an increased risk for various conditions such as decreased exercise capacity [3], incidences of negligence [4], heat exhaustion, disorientation, fainting, and myocardial infarction [5-6]. The occurrence of such symptoms while firefighting, may have serious consequences due to errors in individual judgment. To prevent human error and to eliminate the potential risk factors that may arise as a result of continued activities in the line of duty, it is crucial for firefighters to be aware of their own physical condition.
Heart rate (HR) is a well-known index, representing a vital condition. It is easy to measure and widely used to set exercise intensity. In addition to HR, respiratory metabolism such as aerobic or anaerobic state, also carries important information to evaluate the safe time period for a firefighter to continue working. In an anaerobic dominated state, one can only continue an activity for a limited time. A conventional and well-known method to identify the aerobic/anaerobic state is measuring blood lactate levels, in order to evaluate the accumulation of fatigue. However, blood lactic acid measurement is not possible during firefighting activities. Respiratory metabolism analysis with a mask, to monitor respiration with a gas analyzer, can provide accurate evaluation for the aerobic or anaerobic state of an individual. However, it is not possible to use this respiratory measuring system during firefighting activities. Therefore, we directed our research in evaluating the respiratory function and its aerobic/anaerobic state, using another method, which is applicable during firefighting activities.
Using this novel method, the body’s condition can be evaluated by extracting information and using frequency analysis [7-11]. Therefore, we focused on the use of electrocardiographic information that can be obtained non-invasively. Authors proposed an objective index, the reflection index of respiration (RIR), which is derived by applying frequency analysis to the variation of R-R interval, in order to quantitatively comprehend the effect of the cardiorespiratory response under significant physical load. They found that it was possible to identify the transition from aerobic to anaerobic-dominated metabolism and estimate the degree of cardiopulmonary functional load, by using the value of RIR, rather than respiratory metabolism measurements [11].
Since the index RIR was derived based on data obtained in planned load-imposed tests, such as a shuttle run test with a continuously increasing load from low to high-level of exercise, or a multi-step incremental load test using a bicycle ergometer, it was not clear how RIR would change when the imposed load intensity varies over time, as it does, during the activities at a firefighting site.
By applying this objective index to a simulated firefighting test, the purpose of this study was to evaluate the objective index responsiveness to the imposed load and to verify that the information on the cardiopulmonary load state can be reliably obtained.
2. EXPERIMENTAL PROCEDURES
In order to examine the applicability of the RIR to firefighting activities, it is valuable to apply it to an actual firefighting situation. However, actual fires are unpredictable, and it impossible to wait for starting a fire, while wearing a measuring equipment. A large-scale, practical firefighting drill, using middle-rise buildings is a good alternative, however these drills are only carried out a few times a year. Firefighting includes several different activities involving changes of varying intensities in corresponding physical demands [10, 12]. Therefore, we proposed a simulated firefighting activity test. The test can be repeatedly implemented to reproduce the physical demands during a practical fire drill. The test was conducted with the cooperation of the Yokohama City Fire Bureau [10, 12].
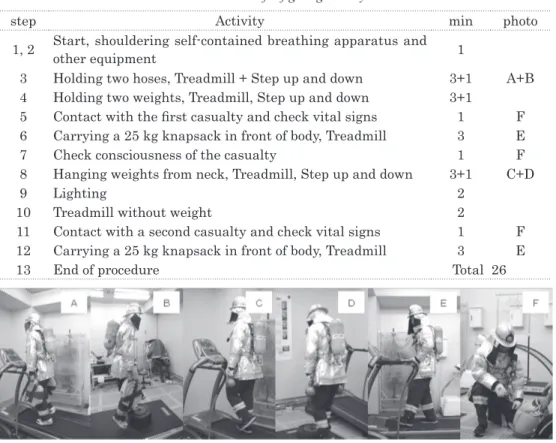
Table 1 Simulated firefighting activity test
step Activity min photo
1, 2 Start, shouldering self-contained breathing apparatus and other equipment 1
3 Holding two hoses, Treadmill + Step up and down 3+1 A+B
4 Holding two weights, Treadmill, Step up and down 3+1
5 Contact with the first casualty and check vital signs 1 F
6 Carrying a 25 kg knapsack in front of body, Treadmill 3 E
7 Check consciousness of the casualty 1 F
8 Hanging weights from neck, Treadmill, Step up and down 3+1 C+D
9 Lighting 2
10 Treadmill without weight 2
11 Contact with a second casualty and check vital signs 1 F
12 Carrying a 25 kg knapsack in front of body, Treadmill 3 E
13 End of procedure Total 26
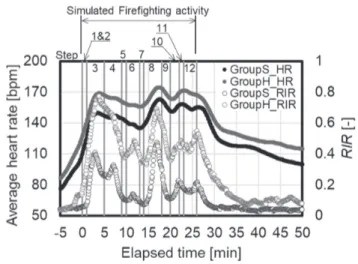
As listed in Table 1, 13 activity items were extracted from the actual firefighting drill conducted in an eight-story training building, as shown in Figure 1. The simulated firefighting activity test lasted 26 minutes and was conducted in a climate-controlled room, to simulate hot and humid conditions. The actual fire equipment was replaced by a variety of weights. Ascending and descending stairs were replaced by a combination of running and walking on a treadmill and stepping up and down. The instantaneous heart rate increased rapidly at the beginning of the activity and remained high, 160-180 bpm, until the end of the activity. This was observed in both the practical fire drill and the simulated firefighting activity test. According to the heart rate variation during the test, and interviewing the firefighters who carried out the test, “Carrying a firefighting hose” (step 3), “Carry firefighting materials and equipment” (step 8), and “Casualty evacuation” (steps 6 and 12) were the most rigorous actions. Details comparing of the variation of the heart rate and the temperature at the tympanic membrane, between the simulated and the practical firefighting drill, were reported in literature [10, 12].
The test was conducted in an artificial climate chamber, at 30°C temperature and 70% humidity. The participants performed the test wearing a fire suit, fire trousers, fire helmet, leather gloves, a self-contained breathing apparatus, typical sports shoes, and all measurement devices. As shown in Table 2, a total of 78 firefighters from the
Yokohama City Fire Bureau, participated in this test. Their age range was 19 to 59 years, and their average body mass index (BMI) was 23 kg/m2. RR interval of 61 participants’ data was measured successfully. Frequency analysis of the data for the remaining 18 participants could not be performed because of data interruption or outliers, due to noise contamination.
The cardiac potential data was obtained using a Holter monitor (AC-301A; Armelectronics Co. Ltd., Japan) at a 1-ms sampling intervals or a heart rate sensor (Electrocardiogram Heart Rate Sensor, DL-310, Sports & Medical Engineering, Japan) at a 2-ms sampling intervals. Data was collected continuously from 5 min before the start until the end of the test. Blood lactate was measured within a minute after completion of the test using Lactate Pro (LT-1710, Arkray Inc.).
Table 2 Physical characteristics of the participants
Number of participants: 78
Age [years] Height [cm] Weight [kg] BMI [kg/m2]
Ave
Max Min Ave Max Min Ave Max Min Ave Max Min
37 59 19 171 184 160 69 90 57 23 30 20
The study was approved by the Research Ethics Committee of Yokohama National University. The safety manager clearly explained the purpose of this research to the participants and obtained their consent for participation. The safety manager informed the participants that the test would be stopped immediately if the safety manager determined that a participant could not continue the test or if a participant expressed a desire to discontinue the test.
3. OBJECTIVE INDEX AND PHYSIOLOGICAL CONSIDERATION
Heart rate is one of the indicators used to define vital status, however it is affected by other factors. It is well known that the heart rate rises when an individual is nervous. On the other hand, electrocardiographic information can be gathered with comparative ease.LF band (0.04 - 0.15Hz) and HF band (0.15 - 0.4 Hz) of RR interval frequency are defined in relation with the activity of autonomic nerves, and ratio of the power in LF band to that in HF band, is an index, evaluating the status of autonomic nerve system [13]. In a situation where the instantaneous heart rate reaches 180 bpm or more, the effect of respiratory reflex appears in the very-high-frequency (VHF) band (0.4 to 1.0 Hz) rather than in HF band.
RIR [11], an objective index illustrating cardiorespiratory load, represents the degree
of cardiorespiratory load and respiratory metabolism. It is defined as the ratio of the power of spectral density in the VHF range (PVHF) to the total power spectral densities in the low, high, and very-high frequency ranges (PLF + PHF + PVHF) from 0.04 to 1.0 Hz as shown in Equation 1.
0.15 0.4 1 0.04 0.15 0.4 ( ) , ( ) , ( ) VHF LF HF VHF LF HF VHF P RIR P P P P PSD f df P PSD f df P PSD f df = + + =
∫
=∫
=∫
(1)By using this objective RIR index, the cardiorespiratory state can be visualized without using a metabolic monitoring device, such as a mask and a gas analyzer. In addition, the relationship between this index and other biological parameters, such as blood lactate, has been reported [11]. It has become clear that the RIR has better sensitivity than the heart rate in defining the shift from an aerobic to an anaerobic dominated state under high load intensity. This characteristic change was observed regardless of the difference in age or physical strength of the participants.
MemCalc/Win software, which is based on the maximum entropy method [14], was employed for frequency analysis of the electrocardiogram data. The results of the frequency analysis were obtained every 5 seconds, which is the shift time between the segments, and the time segment length (Ts) was set to 3 minutes for the analysis and
was plotted at the midpoint time of the Ts.
A Welch’s t-test was applied to compare age, height, weight, the blood lactic acid values and RIR. The threshold for statistical significance was set at p < 0.01.
The Pearson’s correlation coefficient was employed to evaluate the correlation between Lactate and mean RIR. The calculation was carried out with Microsoft Excel 2019 (Microsoft Excel 2019 MSO (16.0.12730.20144)). The null hypothesis implied no correlation in two variables, the threshold for statistical significance was set at p < 0.01.
4. RESULTS AND DISCUSSION
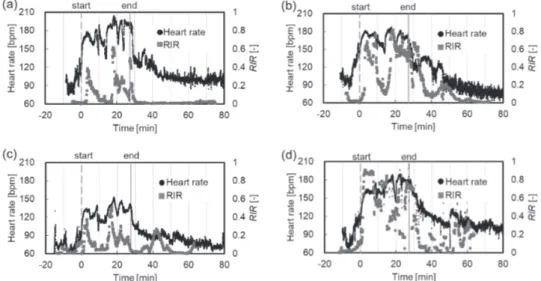
To verify the applicability of the RIR to firefighting activities, in which the load intensity varies over time, a simulated firefighting activity test was conducted. As shown in Figure 2, the measurement was sturdy in the event of a disturbance. Results were grouped depending on whether the participants completed the test smoothly or not, based on an interview and observation. The observation criteria included: failing in any of the following conditions: body movement unsteadiness, requiring body support immediately after the test, inability of the participant to take off their firefighting equipment, and others.
Figure 2 Variations of heart rate and RIR with time during the simulated firefighting activity test. (a), (c) participants who completed the test smoothly,
(b), (d) the participants who barely completed the test with unsteady movements
Figure 2 (a) and (c) illustrate the heart rate and RIR results of participants, who
completed the test smoothly (participants A and C). Figure 2 (b) and (d) show the results of the participants, who barely completed the test with unsteady movements (participants B and D). Participants A and B were younger, 27 and 28 years old, respectively. Participants C and D were older, both were 41 years old. The dashed line indicates the start time of the simulated firefighting activity test, and the solid line indicates the end of the test.
Participant A had a slightly wider range of instantaneous heart rate variability than B. However, participant A had a much narrower range of RIR variability than B. The fluctuation ranges of both the instantaneous heart rate and the RIR of participant C were narrow and the ranges of those of participant D were wide.
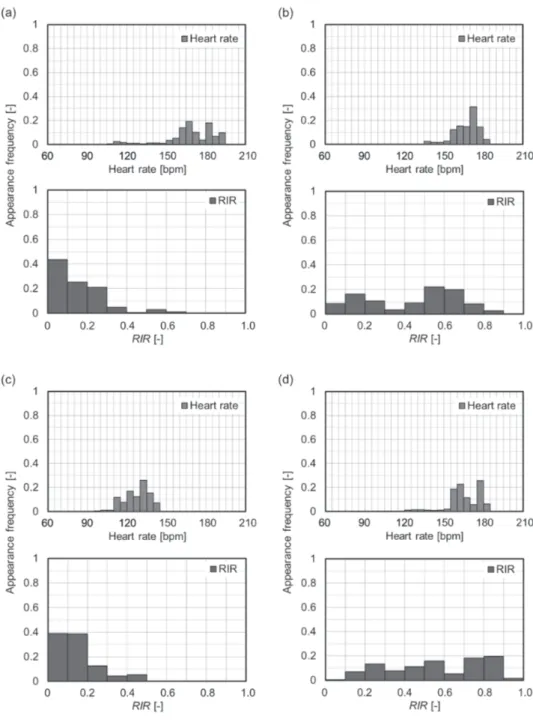
To clarify the difference between the physical responses of these four participants, appearance frequency distributions of their mean heart rate and RIR are shown in
Figure 3. The mean heart rate was calculated using the instantaneous heart rate during
a 3 min period, obtained every 5 seconds. The appearance frequency of the mean heart rate was obtained based on data, counted in sections, every 5 bpm from 60 to 200 bpm. The RIR appearance frequency was also obtained based on data counted every 0.1 from 0 to 1.0.
Mean heart rate did not differ significantly during the test among the participants except for participant C. However, there was some difference in the RIR distribution among the participants.
Figure 3 Variations in the appearance frequency of the heart rate and the RIR during a simulated firefighting activity test.
(a) and (c) participants who completed the test smoothly,
A previous study had analyzed the relationship between the RIR and the blood lactate level and had reported that anaerobic metabolism became dominant when the RIR exceeded 0.3, and blood lactate began to accumulate when the RIR exceeds 0.6 [11].
Participant’s A RIR was mostly in the range of 0.3 or less during the test. The time duration when participant’s B RIR was over 0.3, accounts for 70 % of the whole time of activity, and that over 0.6, accounts for 32 %. Participant’s C RIR was less than 0.5 for most of the activity time, and just 10 % the time period his RIR was over 0.3. Participant’s D RIR was over 0.3 for 70 % of the whole time of the activity.
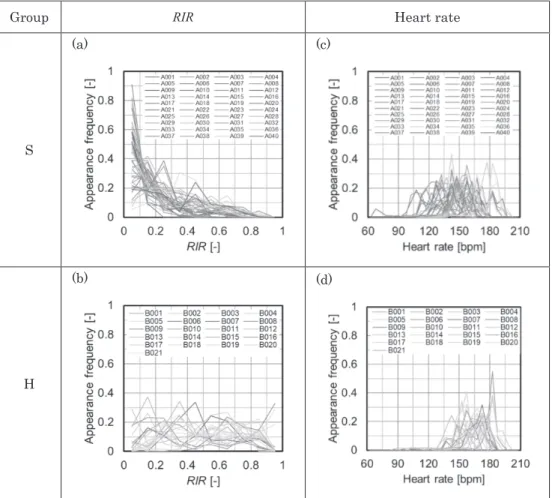
Although the four participants conducted the same activity, there was a difference in their cardiorespiratory response, as mentioned above. Therefore, results were classified into two groups, S and H (“Smooth” and “Hard”), based on whether the participants completed the test smoothly or not, respectively. Figure 4 presents the results classified into the two groups, based on the appearance frequencies of the RIR and mean heart rate. Originally, it was described as a bar graph. However, as the data could not be distinguished due to overlapping, it was represented as a line graph, setting the median value of the segment as the represented value.
Group RIR Heart rate
S
(a) (c)
H
(b) (d)
Figure 4 Distributions of the appearance frequency of the heart rate and RIR during a simulated firefighting activity test
In group S, the time period in which the RIR was over 0.6 is less than 20 % of the whole activity time. In group H, the time period in which RIR was over 0.6 was greater than 20 % of the whole activity time.
We defined 20 % as a threshold, based on the comparison of the results at 10, 20, and 30 %. Out of the 61 participants, 40 participants were categorized as group S, and 21 participants as group H. The mean heart rate distribution of group H was slightly shifted to the higher range, however, the distribution pattern between both groups did not show significant difference. The group S RIR distribution stood out less in the 0.3 region, however, that of group H, was uniformly distributed throughout the RIR region.
Table 3 Comparison between group S and H, and results of Welch’s t-test Group S H n = 40 n = 21 Age [years] Ave 34 39 Max 55 54 Min 19 24 p - value 2.1×10⁻² Height [cm] Ave 173 170 Max 184 181 Min 164 163 p - value 4.1×10⁻² Weight [kg] Ave 69 70 Max 84 90 Min 57 58 p - value 5.9×10⁻¹ Blood lactate [mmol/L] Ave 3.0 5.8 Max 7.3 9.8 Min 1.2 1.8 p - value 9.1×10⁻⁵ Mean RIR [-] Ave 0.20 0.49 Max 0.41 0.77 Min 0.04 0.32 p - value 4.0×10⁻¹²
Table 3 shows age, height, weight, blood lactate level, and mean RIR of each classified
group. Each participant’s average RIR was calculated with the RIR obtained every 5 seconds during the whole period of the simulated firefighting activity. The mean RIR was defined as all participants’ average RIR for each group. This table also shows p-value, which was calculated by Welch’s t-test, to evaluate whether there were significant differences between group S and group H. As a result of Welch’s t-test, the blood lactate levels and mean RIR showed clear difference among the groups (p = 9.1×10⁻⁵ and p = 4.0×10⁻¹²).
Figure 5 The relationship between blood lactate, measured within a minute after completion of the simulated firefighting activity test, and the mean RIR
Figure 5 shows the relationship between the blood lactate level, measured within a
minute after completion of the simulated firefighting activity test, and the mean RIR. Using Pearson’s correlation coefficient between the blood lactate level and the mean RIR of each group, we determined the p-value to be 2.1×10⁻⁸ and the correlation coefficient to be 0.66, suggesting a significant correlation between them. The blood lactate levels of participants classified as group H were clearly higher than those of participants classified as group S. The average value of group S results was slightly less than 4 mmol/L, which indicated the onset of blood lactate accumulation. In contrast, the average blood lactate level of group H was greater than 4 mmol/L, with a maximum value of 9.8 mmol/L. These results suggested that the longer high RIR value were maintained, the higher the blood lactate level increased. Accumulation of blood lactate indicates continuation of activity under an anaerobic dominated state.
Figure 6 illustrates the time histories of the average values of heart rate and RIR for
each group. While Figure 2 shows four representative time series data, Figure 6 shows averaged data of all participants, forming each group. There were 40 participants in group S, and 21 participants in group H. The changes over time in the heart rate and
RIR of groups S and H showed similar graphs. Quantitative differences in the heart rate
and RIR depend on whether the participants completed the simulated firefighting activity smoothly or not. In group S, a sufficient decrease in the RIR occurred at the transition from step 3 to step 4 and some bimodal peaks were observed. In group H, no apparent decrease occurred at the same point and no bimodal peaks were observed. The
RIR value of group H was approximately twice as much as that of group S. This suggests
that members of group H continued their activity under more stress in respect to their cardiopulmonary function. The fluctuation range of the RIR was greater than that of the HR, therefore the index RIR could be considered to be a reliable parameter to monitor changes in respiratory metabolism state.
As mentioned above, it was possible to determine the state of the respiratory metabolism of the firefighters by tracking the changes in the proposed RIR index as well as the heart rate fluctuations. It is difficult to continue a steady activity for an extended period of time under an anaerobic metabolic state. Therefore, it is important to reduce this anaerobic-dominant time. The applicability and usefulness of the RIR was verified. The proposed RIR and heart rate are the principal parameters to provide objective information, supplementing a firefighter’s subjective assessment of his or her own physical state. Thus, overexertion could be prevented the occupational safety of firefighters improved.
5. CONCLUSIONS
To improve the occupational safety of firefighters, the applicability of the reflection index of respiration, RIR, was evaluated through a simulated firefighting activity test. A total of 78 firefighters participated in this test, and data from 61 firefighters were successfully obtained. The following conclusions were reached while tracking changes in RIR:
• Even with imposed loads varying irregularly in time, the RIR showed good response in relation of the intensity of the imposed load.
• The variation of RIR showed good correlation with both the respiratory metabolic state and blood lactic acid levels.
• The variation of the RIR in time, matches the activity observation status of the firefighter during the simulated firefighting activity.
The index RIR obtained by applying the frequency analysis to the variation of R-R interval could help evaluate the respiratory metabolic state of firefighters during a firefighting activity. The applicability and usefulness of the RIR has been demonstrated. The combination of the RIR and the heart rate monitoring can be applied in preventing overexertion of firefighters and supporting and improving their occupational safety.
ACKNOWLEDGEMENTS
The authors are pleased to acknowledge the support of the Yokohama City Fire Bureau for this study.
This work was supported in part by the Grants-in-Aid for Scientific Research (B); (No. 26282093).
REFERENCES
1. Sothmann, M.S., Saupe, K., Jasenof, D., and Blaney, J., Heart rate response of firefighters to actual emergencies. Implications for cardiorespiratory fitness, Journal of Occupational Medicine, 34 (8), 797-800, 1992.
2. Smith, D.L., Barr, D.A., and Kales, S.N., Extreme sacrifice: sudden cardiac death in the US fire service, Extreme Physiology & Medicine, 2-6, 2013.
3. Kondo, N., The effects of non-thermoregulatory factors on heat loss responses during exercise, Japanese Journal of Biometeorology, 42 (1), 39-53, 2005. (in Japanese)
4. Shoji, T., Egawa, Y., and Koshimizu, H., A study on the task performance on the different thermal conditions, Specific Research Reports of the National Institute of Industrial Safety, 28 (5), 49-61, 2003. (in Japanese)
5. Kay, B.F., Lund, M.M., Taylor, P.N., and Herbold, N.H., Assessment of firefighters’ cardiovascular disease-related knowledge and behaviors, American Dietetic Association, 101 (7), 807-809, 2001.
6. Selkirk, G.A., and McLellan, T.M., Physical work limits for Toronto firefighters in warm environments, Journal of Occupational and Environmental Hygiene, 1 (4), 199-212, 2004.
7. Tani, A., Kagitani, T., and Hori, S., Evaluation of autonomic nervous function by spectral analysis of heart rate variability, Clinician, 416, 1071-1077, 1992. (in Japanese).
8. Osaka, M., Fluctuation of heart rate and autonomic nervous system, Nippon Ika Daigaku Zasshi, 62 (1), 71-75, 1995. (in Japanese).
9. Park, S.W., Brenneman, M., Cooke, W. H., Cordova, A., and Fogt, D., Determination of anaerobic threshold by heart rate or heart rate variability using discontinuous cycle ergometry, International Journal of Exercise Science, 7(1), 45-53, 2014. 10. Kuriyama, Y., Oka, Y., Ito, Y., and Enari, M., Proposals of standardized training
procedure and indices indicating firefighters’ fatigue, Proceedings of 13th International Conference and Exhibition on Fire Science and Engineering, Interflam, 681-686, 2013.
11. Ito, Y., Oka, Y., and Kuriyama, Y., Proposal of objective index to evaluate cardiorespiratory state based on heart rate fluctuation analysis, Journal of Japan Society for Safety Engineering, 57 (1), 56-64, 2018. (in Japanese)
12. Oka, Y., Ohba, J., Ikeda, M., Touma, K., and Kuriyama, Y., Proposal of simulated firefighting activity model to measure fatigue condition of firefighters during operation, Bulletin of Japan Association for Fire Science and Engineering, 63 (1), 9-16, 2013. (in Japanese)
13. Task Force of The European Society of Cardiology and The North American Society of Pacing and Electrophysiology, Heart rate variability: standards of measurement, physiological interpretation and clinical use, Circulation, 93(5), 1043-65, 1996. 14. Tanaka, Y., Ohtomo, N., and Terachi, S., Nonlinear time series analysis 2. The
construction of a data analysis system “MemCalc”, Bulletin of the Faculty of Engineering, Hokkaido University, 160, 1992. (in Japanese)

![Table 3 Comparison between group S and H, and results of Welch’s t-test Group S H n = 40 n = 21 Age [years] Ave 34 39Max5554 Min 19 24 p - value 2.1×10 -2 Height [cm] Ave 173 170Max184181 Min 164 163 p - value 4.1×10 -2 Weight [kg] Ave 69 70Max8490 Min 57](https://thumb-ap.123doks.com/thumbv2/123deta/6764092.1161617/11.701.86.641.123.598/table-comparison-group-results-welch-group-height-weight.webp)