Southeast Asian Studies, Vol. 24, No.3, December 1986
Notes
Soils in the Toposequence of the Gunung Gadut
Tropical Rain Forest, West Sumatra
Toshiyuki WAKATSUKI, * Amrizal SAIDI** and Azwar RASYIDIN**
Abstract
Chemical, physical, morphological and mineralogical properties of soils in the toposequence of Gunung Gadut tropical rain forest, West Sumatra, were determined. The study area has an annual rainfall of more than5, ()()() mm, among the highest in the world, and no real dry season. No water deficit in the soil was found throughout the year. A reconnaissance soil survey revealed a close relation between the distribution of soil types and the topography as well as geologic conditions.
Soilsinfour pennanent plots for study of forest ecology and flora were examinedindetail. The Pinang Pinang plot is in a foothill Dipterocarp forest on a gentle hill top with a partly narrow and partly broad ridge at 550 m altitude. Soils were relatively young Typic Dystropepts developed from Quaternary andesite. Although the soils show a prominent red color and strong acidity, adequate nitrogen and base status make them relatively fertile. Clay minerals were kaolin and 2: 1 type vermiculite. The Gajabuih plot is also in a foothill Dipterocarp forest on a northwestern slope near a ridge with moderately steep to undulating relief at 550 m altitude. Soils were Oxic Dystropepts or Orthoxic Tropudults developed from Permian shale and phyllite, which had yellowish brown color and a well-developed structure. Although levels of nitrogen and available calcium seemed tobeadequate, Mg was relatively poor in comparison with Ca. Clay minerals were predominantly kaolin and gibbsite. The Airsirah plot isinahill oak forest on a broad and undulating ridge at 1,100 m altitude. Soils were highly leached and strongly acid Tropudults developed from Quaternary volcanic ash. Soil fertility was low. Clay minerals were spheroidal haIloysites. The G. Gadut plot is in a mossy mountain oak forest on a wide plateau at 1,600 m altitude. Soils were extremely infertile Tropaquods developed from Quaternary volcanic ashes. A thick organic horizon was underlain by bleached and extremely leached subhorizons. TheCINratios were very high. Clay minerals were allophane and imogolite.
Chemical fertility, especially available calcium, correlated well with tree heights. The upper limits of tree height were estimated at 119 m for the Pinang Pinang plot, 109 m for the Gajabuih plot, 51 m for the Airsirah plot, and 38 m for the G. Gadut plot, whereas the measured maximum heights were respectively 59 m, 61 m, 34 m, and 20 m.
*
:E
JiflJz, Faculty of Agriculture, Shimane Uni-versity, Matsue 690, Japan** Department of Soil Science, Faculty of Agricul-ture, Andalas University, Padang, West Suma-tra, Indonesia
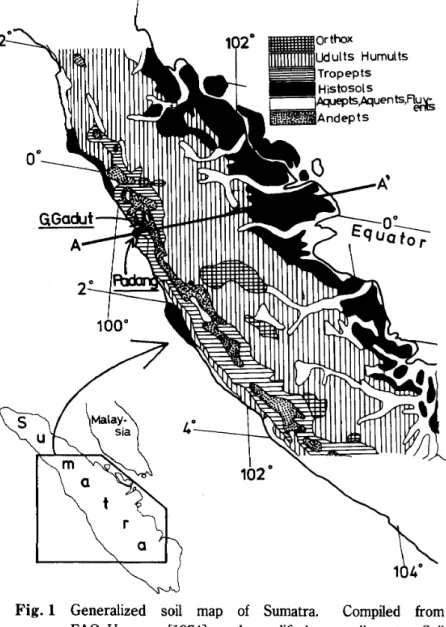
Generalized soil map of Sumatra. Compiled from FAD-Unesco [1974] and modified according to Soil Taxonomy [USDA Soil Management Support Service 1983].
l
orthox Udults Humults Tropepts Histosols c=:::JtqJepts,/lquents,~ ~Andeptsin the surrounding area and in Sumatra, principally from the viewpoint of natural soil fertility. To evaluate fertility, soil morphologi-cal, physimorphologi-cal, chemical and mineralogical charac-teristics were investigated. These properties vary with the local topography which, in turn, is related to geologic conditions, and therefore soils are described according to their topose-quences on three different scales: soils in Sumatra, soils in the G. Gadut region, and soils in the Pinang Pinang and Gajabuih plots.
Fig. I
Introduction
Hotta and Ogino, in close cooperation with staff and students of Andalas University, Padang, Indonesia, have been studying the forest ecology and plant taxonomy of the tropical rain forest in the G. Gadut region, West Sumatra [Hotta and Ogino 1984 ; Qgino 1985]. They have established four plots for field observation at various altitudes from 550 to 1,600 m: Pinang Pinang and
Gajabuih plots at 550 m, which have species characteristic of foothill Dipterocarp forest;
Air-sirah plot at 1,100 m, which has a
hilloak forest; and G. Gadut plot at 1,600 m, which has a mossy mountain oak forest.
The authors also conducted soil survey as members of this field survey team. Soil supplies nutrients and water to plants, and thus forest ecosystems are strongly controlled by soil condi-tions. But little information is available on soil conditions or soil fertility in tropical rain forest [Baillie and Ashton 1983; Burn-ham 1975].
The G. Gadut region has one of the highest rainfalls in the world, i. e., 5,000-6,000 mm or more a year. Here the soils of the wettest tropical forest can be studied.
This report describes soils of the four permanent plots in the G. Gadut region as well as soils 244
T. WAKATSUKIet al.: Soilsinthe Toposequence of the Gunung Gadut TropicalRainForest, West Sumatra
Detailed
1.
Climate
Temperature:
Soils in the Gunung GadutToposequence
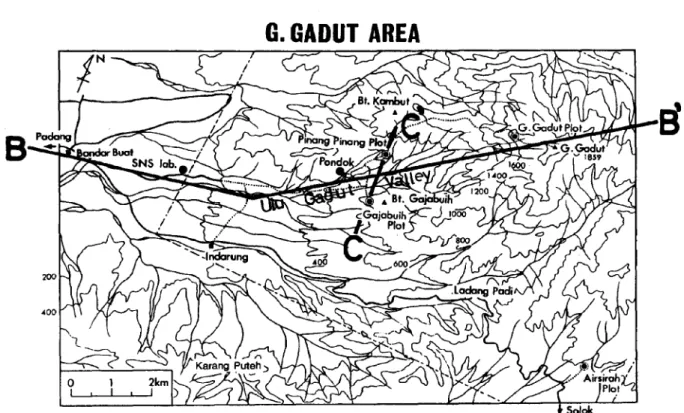
Fig. 3 is a map of the Gunung Gadut area showing the four plots by double circles and some important places. G. Gadut is located in the Barisan range some 17kIn northeast from the center of Padang (Fig. 1). The four plots lie at various altitudes along the Ulu Gadut valley, B-B' in
Fig. 3.
supply fresh, nutrient-rich parent materials, appear to be in a dynamic balance with intensive weathering and leaching, as a result of which relatively fertile soils fonn.
In the coastal plain the accumulated sedi-ments produce some young and fertile soils such as Aquepts, Aquents and Fluvents, but the stagnation of water results in reduced conditions and the widespread fonnation of poisonous and infertile Histosols. In addition, soils in this area often have pyritic minerals which produce very acidic conditions upon cultivation.
The central peneplain has old and very infertile soils such as Orthox, Udults and Humults. Soils formed on the stable topography have undergone intensive weathering and prolonged leaching. Furthermore, there is no addition of new parent materials, for this area has neither recent volcanic activity nor ade-quate erosion and sedimentation processes.
Coastal Plain SansonFbnge I I 2800 ,,"\--Mt.MaraPi m :~ 2400
! \
Central Peneplain J \ I !II+-:--GGadut ifi
.
I: , , I 1 II 1L I _Tropepts. Orthox, Udults, Humults Histosols, Aquepls,
Andepts Fl uven ts
Fig.2 Topography of the Cross Section from Padang along the Line A-A' inFig. 1
Soils in Sumatra: General Features of Soil Fertility
Sumatra stretches 1,650km from Banda Aceh in the northwest to Tanjungkarang in the southeast, is about 400km wide in the central part and has an area of about 435,000km2• Its backbone is fanned by the Barisan range which runs along the western side [Nishimura 1980].
Fig. 1 shows a generalized soil map of the central part of Sumatra, which was adopted from an FAO-Unesco soil map of the world [FAO-Unesco 1974] with some generalization and modification by the authors according to Soil Taxonomy [USDA Soil Management Sup-port Service 1983]. Fig. 2 shows the topogra-phy of the cross section from Padang along the line A-A' in Fig. 1. Major soil types are distributed in accordance with the three main geomorphic elements of Sumatra: the Barisan range, the central peneplain, and the coastal plain.
The Barisan range has relatively young and fertile soils such as Tropepts and Andepts. Volcanic activity and adequate erosion, which
G. GADUT AREA
Fig.3 Topographic map of the Gunung Gadut area showing the four pennanent plots (double circles) and some important places. The four plots are Pinang Pinang, Gajabuih, Airsirah and G. Gadut.
climatic data have not been measured at the four plots. However, the major variation in
temperature is related to the elevation above sea level. For example, the mean annual (monthly maximum-minimum) temperatures for some important places at various altitudes in
Sumatra are reported as follows [Oldeman et
al. 1979]: Padang at 7 m altitude, 26. 9°C (30.4-23.4°C); PematangSiantar at 400 m, 23.6°C (26.3-20.9°C); Bukittinggi at 920 m, 21.6°C (25.6-17.6°C); Seribu Dolok at 1,400 m, 18.2°C (21. 7-14. 6°C).
From these relationships, the temperature characteristics of the four plots are estimated
roughly as follows: the Gajabuih and the Pinang Pinang plots at 550 m, 23°C (27-19°C); Airsirah plot at 1,100 m, 19°C (22-15°C); G. Gadut plot at 1,600 m, 16°C (l9-13°C). The annual difference of monthly mean temperature rarely exceeds 2°C.
Rainfall: Table 1 gives the monthly rainfall data for Padang and Indarung in comparison with those of Singapore. The precipitation at Padang, located on the west coast, is veryhigh. The town of Indarung, 11 kmeast of Padang at 200 m altitude at the south foot of G. Gadut, has still more rainfall, nearly 6,000 mm. Indarung is situated at the mouth of the Ulu
Table 1 Monthly Rainfall in mm for Padang, Indarung and Singapore
Location Jan. Feb. Mar. Apr. May Jun. Jul. Aug. Sept. Oct. Nov. Dec. Annual
Indarung 499 368 480 521 450 349 293 425 536 656 715 622 5,914
Padang 361 252 355 409 340 289 250 350 459 573 581 545 4,764
Singapore 285 164 154 160 131 177 163 200 122 184 236 306 2,282
T. WAKATSUKI et al.: Soilsinthe Toposequence of the Gunung Gadut Tropical Rain Forest, West Sumatra
sirah plots are on mountains with moderate relief.
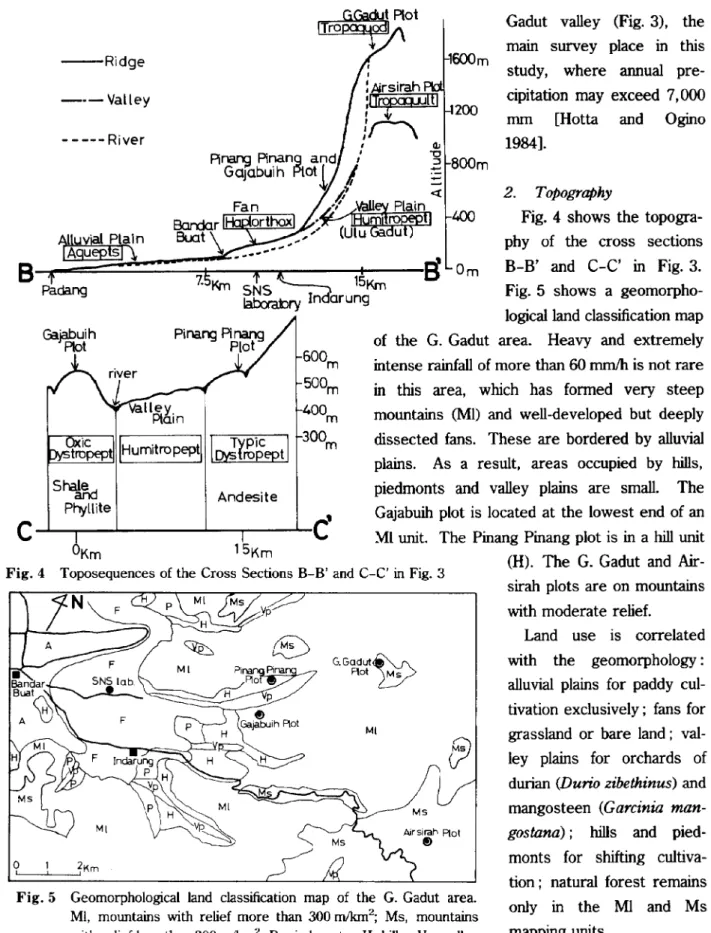
Land use is correlated with the geomorphology : alluvial plains for paddy cul-tivation exclusively; fans for grassland or bare land; val-ley plains for orchards of durian(Durio zibethinus) and mangosteen (Garcinia
man-gostana) ; hills and pied-monts for shifting cultiva-tion; natural forest remains only in the Ml and Ms mapping units.
Gadut valley (Fig. 3), the main survey place in this study, where annual pre-cipitation may exceed 7,000 mm [Hotta and Ogino 1984].
600m
Ms
Airsirah Plot f)
in this area, which has fonned very steep mountains (Ml) and well-developed but deeply dissected fans. These are bordered by alluvial plains. As a result, areas occupied by hills, piedmonts and valley plains are small. The Gajabuih plot is located at the lowest end of an Ml unit. The Pinang Pinang plot is in a hill unit (H). The G. Gadut and
Air-2. Topography
Fig. 4 shows the topogra-phy of the cross sections
B-B' and C-C' in Fig. 3. Fig. 5 shows a geomorpho-logica1land classification map of the G. Gadut area. Heavy and extremely intense rainfall of morethan60 mmIh is not rare
Ml G.GQdUI~ Plot ~ Andesite ,
,
;e~It,
12001/\
I <IJ A~ Pinang and,'-g
800m Gajabuih Plot~I
§
i'
~ Fa n ~/~ :v'all~PlainBardar orthox
'~1Hu~tl
400Suat \ ~_~_..',' (Ulu u
---
B
Omvalley
Plain
Geomorphological land classification map of the G. Gadut area. MI, mountains with relief more than 300m/km2; Ms, mountains with relief less than 300m/km2; P, piedmonts; H. hills; Vp, valley plain; F, fans; A, alluvial plain.
- - --- River - R i d g e ---Valley A
B
Padang icI '
II
TYPiCI
tropeptHumltropeptpystropept Sha.~ PhylliteC
...L.-~~-_----I._~_
...C'
Fig. 5 oI 0Km 15KmGeologic map of the G. Gadut area compiled from Kastowo and Leo [1973], Roshidi et alp [1976] and Silitonga and Kastowo [1975]. Qal, river alluvium; Qf, alluvial fans; Tmop, Painan formation consisting of volcanic rocks of Oligo-Miocene age; QTta, Quaternary andesite and tuff interbedded; Pckl, phyllite and shale member of the Kuantan formation of the late Middle Permian age; Pcks, limestone member of the Kuantan formation of the late Middle Permian age; TRtl, limestone member of the Thumur formation of the Triassic age; QTau, undifferentiated volcanic breccia consisting of tuff, laharand lava flows mostly of andesitic composition, of which the eruption centers have not been located but the eruption time is inferred to be early Quaternary.
Airsirah Aot
e
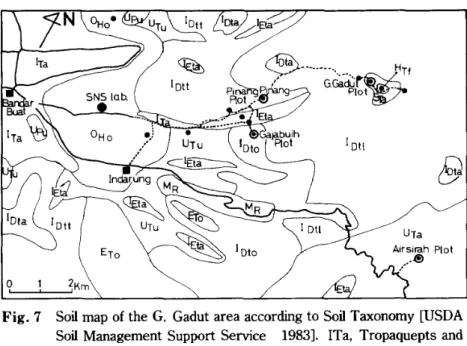
QTau G.Gadut Plol f.) QTau Pckscontour lines show extreme tonguing at the fans. This means that soils on the fans were subjected to strong weathering and leaching for relatively long periods. Once the fans must have been covered with forests. However, after long use for shifting cultivation, the old and infertile soils have corne to support only
alang-alang (lmperata cylindrica) vegetation. Piedmonts and hills with moderate relief have relatively leached soils, Tropudults (UTu unit), which are younger than the OHo soils. These soils are used for banana, coconut or irrigated paddy. Shifting cultivation is still observed on these soils.
Valley plains are very important for agricul-ture, having relatively fertile soils, Hurnitropepts
Tmop
a
IFig. 6
vey map of the G. Gadut area is shown in Fig. 7, which was compiled from the geologic map,
geomor-phological map and field observations. Soils were classified according to Soil Taxonomy [USDA Soil Management Support Service 1983]. In Fig. 7, solid circles show the sites of soil sampling and double circles show the four plots which were studiedin more detail.
The alluvial plain has Tropaquepts and some Plinthaquepts (ITa mapping unit), which are relatively fertile and good soils for paddy cultivation. Sediments and nutrient-rich riverwater make the soils fertile.
Alluvial fans, on the other hand, have developed highly leached soils, Haplorthox and Umbriorthox (OHo unit). Although the surface is rather flat and slightly undulating, the fans are highly dissected as shown in Fig. 3. The
3. Geology
A geologic map of the G. Gadut area is shown in Fig. 6, which was compiled from the data of Kastowo and Leo [1973], Roshidi et alp [1976] and Silitonga and Kastowo [1975]. Since the major parent materials of soils in this area are ande-sitic or limestone, relatively rich nutrient levels can be expected. However, soil fer-tility is strongly influenced by not only geology but also topographic conditions.
4. Distribution of Soils
A reconnaissance soil
T. WAKATSUKIet al.: Soilsinthe Toposequence of the Gunung Gadut Tropical Rain Forest, West Sumatra
Table 2
5. Soils in theG. Gadut Topo-sequence
G. Gadut Plot:
tremely infertile Tropaquods (STa unit) and Tropofibrists (HTf unit) because of the per-humid moisture regime and the relatively low temperature.
Limestone distributed a-round Indarung may form spe-cific soils including Rendolls (MR unit) or Troporthents and Lithic Rendolls (ETo unit). However, further fieldwork is needed to confirm the identity of these soils.
UTa
Airsirah Plot
••,@
..
(0.25Y4/2.6) which has mottling features like B2 and 2B2 horizons. Liquid volume percent-ages are extremely high, more than 70% throughout the profile. The pH values (H20 and
Ken
of the0
and A2 horizons are low with high exchange acidity (IN KCI extractable) as shown in Table 2. However, the horizons under these show only weak acidity.One of the most prominent characters of this soil is its extremely low content of nutrients such as Ca, Mg and K. As a result, the effec-summarizes the morphologi-cal, physical and chemical properties of the typical soils in each of the four plots along the DIu Gadut valley as shown
in
Figs. 3 and 4.The G. Gadut plot is in a mossy mountain oak forest on a relatively wide plateau near the top of G. Gadut, at about 1,600 m above sea level. The soil type is extremely infertile Tropaquod. A thick organic horizon (0) is underlain by a bleached A2 horizon of olive-brown color
lOti
~Km
Soil map of the G. Gadut area according to Soil Taxonomy [USDA Soil Management Support Service 1983]. ITa, Tropaquepts and Plinthaquepts; OHo, Haplorthox and Umbriorthox; UTu, Tropudults; UPu, Paleudults; lEta, Humitropepts; IDtt, Typic and Rhodic Dystropepts; IDto, Oxic and Typic Dystropepts; IDta, Aquic and Oxic Dystropepts; MR, Rendolls (?); ETo, Troporthents and Lithic Rendolls (?); UTa, Aquic Tropudults and Tropaquepts ; IDtl, Lithic and Typic Dystropepts; STa, Tropaquods; HTf, Tropofibrists.
o, Fig. 7
(lEta unit), which support durian and mango-steen orchards as well as paddy cultivation.
Andesitic steep mountains (QTta in Fig. 6 and MI in Fig. 5) have young soils: Typic and Rhodic Dystropepts (IDtt unit), the main types of the Pinang Pinang plot, are present at altitudes lower than 800 m, while Lithic and Typic Dystropepts (lDtl unit) occupy altitudes higher than 800-1,000 m.
The old phyllite and shale (Pcks unit in Fig. 6) mountains with precipitous relief (MI unit in Fig. 5) have Oxic Dystropepts, which may be the same as the soils of the Gajabuih plot.
Andesitic mountains with moderate relief have more developed soils such as Tropaquults and Aquic Tropudults, which are the soils of the Airsirah plot.
A wide, gently sloping relief at the top of G. Gadut has led to local development of
ex-g
Table 2 Properties of Typical Soils in the G. Gadut, Airsirah, Gajabuih and Pinang Pinang Plots
BD1) Liq.2) SoP) Tex- pH pH N Exchangeable Cations 6)
Remarks C/N AI·) Ca M K N CECSl BS
Soil Depth Horizon Color Structure
g/ee Vol% Vol% ture HzO KCl % g a /&
(me/l00 g soil) 0
G. Gadut 0-8em 0 1.6Y3.3/1.9 Saprie 0.39 73.5 19.4 SiC 3.8 3.4 0.43 21.6 8.7 1.6 0.66 0.37 0.10 12 23.9 Plot 25-50 A2 0.25Y4/2.6 W M Cr Mottle 0.49 73.3 24.5 SiC 4.5 4.1 0.12 43.0 8.0 0.1 0.01 0.06 0.03 8.1 1.8 50-60 B2 2.5Y3.9/2.3 Massive Mottle 0.55 78.1 21.9 CL 5.5 5.2 0.11 35.0 0.3 0.1 0.01 0.04 0.02 0.4 32.0 70-80 2B2 0.4Y5.0/4.2 Massive Mottle 0.67 75.0 24.8 CL 5.3 5.3 0.11 36.6 0.3 0.1 0.01 0.05 0.02 0.4 36.0 90-100 3C2 4. 6Y5. 2/2.8 Massive 0.64 76.2 23.8 C 5.2 4.5 1.9 0.1 0.01 0.16 0.11 2.3 16.7 Airsirah 0-4 em All 2.9Y2.9/1.9 M M Cr O. 28 77 . 7 12 .7 CL 3.9 3.7 0.52 14.2 9.0 8.5 0.78 0.40 0.14 19 52.3
Plot 20-35 B2lt 1.3Y4.4/4.7 M F Abl Cutan 0.78 62.0 30.0 C 4.7 3.9 0.07 18.0 7.3 0.1 0.01 0.02 0.10 7.5 2.4
•
50-65 B22t 9.5YR4.5/5.3 M F Abl Cutan 0.88 66.9 32.6 C 4.8 3.8 0.03 7.2 9.7 0.1 0.01 0.02 0.07 9.9 1.5 llI-"'II 80-100 Cl 8.9YR4.6/4.7 Massive Mottle 0.76 71.8 27.6 CL 4.6 3.8 0.03 12.9 12 0.1 0.01 0.01 0.06 12 1.1 ~:"'II Gajabuih 0-5 em A 9.0YR3.6/2.8 M C Gr 0.51 61.3 22.4 C 4.8 4.6 0.70 14.4 1.7 12 0.53 0.34 0.06 15 88.5 ~~ Plot 15-25 Bl 8.9YR4.2/4.2 M M Sabl 0.78 58.9 28.8 C 4.4 4.2 0.23 12.7 3.7 1.2 0.08 0.08 0.05 5.2 27.6 ['oJ
45-55 B21 8.9YR4.2/4.7 W M Sabl 0.91 57.0 33.4 C 4.6 4.0 0.11 12.9 3.4 0.4 0.03 0.03 0.04 3.9 12.1 ~~ 95-105 B22 1.6Y4.5/4.5 W M Sabl 1. 03 55.6 37.2 C 4.7 3.9 0.07 11.8 4.1 0.3 0.06 0.03 0.05 4.5 9.3 w <J\n Pinang 0-5em A 8.3YR4.3/4.6 M F Sabl - 0.53 60.4 22.1 C 4.4 4.3 0.72 13.5 4.4 9.6 1.5 0.42 0.09 16 72.6 Pinang 15-25 Bl 7.3YR4.9/5.7 M M Sabl - 0.97 53.5 35.4 CL 4.3 3.9 0.14 13.5 7.0 1.2 0.59 0.07 0.05 8.9 21.4 Plot 45-55 B2 5.0YR5.2/6.8 Massive 1.11 52.2 39.7 CL 4.8 4.0 0.06 13.7 6.6 0.8 0.57 0.04 0.08 8.1 18.4 95-105 C 5.1YR4.5/5.9 Single Gr 1.23 49.6 44.4 SCL 4.8 4.0 0.04 10.0 7.2 0.2 0.07 0.04 0.03 7.6 4.5 Valley 0-5 em All 9.5YR2.8/1.9 M M Gr - 0.40 65.5 18.1 C 6.0 6.0 0.3 40 3.35 1.21 0.03 45 99.3 Plain 15-25 AB 1.5Y3.9/3.3 W M Sabl Mottle 0.92 59.3 33.4 C 5.5 4.7 0.3 5.8 0.74 0.52 0.04 7.3 96.6 45-55 Bll 9.8YR3.9/3.2 Massive Mottle 1.15 53.6 41.4 C 5.5 4.0
- -
4.6 1.9 0.45 0.60 0.04 7.5 39.4 85-95 B12 0.68Y4.0/3.7 Massive Mottle 1.10 58.8 39.5 C 5.0 4.0 4.1 1.6 0.61 0.63 0.04 7.1 41.4 1) bulk density (glee); 2) liquid volume %; 3) solid volume %; 4) IN KCI extractable acidity (me/IOO g soil); 5) effective cationT. WAKATSUKIet al.: Soilsinthe Toposequence of the Gunung Gadut Tropical Rain Forest, WestSumatra
tive CEC (cation exchange capacity calculated as the sum of exchangeable cations) is low, especially in the horizons lower than 50 em. In addition, the CIN ratios are very high. This shows the retarded decomposition of organic matter, which is a common feature of the organic horizons of Spodosols and Histosols.
The X-ray diffractogram (XRD) in Fig. Sand transmission electron micrograph (TEM) in Plate 1 indicate that hydrated halloysite (lOA), gibbsite (4. SSA) and cristobalite (4. 1SA) are the major clay minerals in the A2 horizon, whereas allophane and/or imogolite are dominant in the
Fig. 8
lower horizons. Field observations suggest the presence of at least three layers of different parent materials which formed the B2, 2B2 and 3C2 horizons. These indicate that volcanic ashes were the parent materials of soils in the G. Gadut plot.
However, the formation of halloysite in the surface horizon and allophane/imogolite in the lower horizons is not a common profile sequence in volcanic ash soils [Wada 1977]. In addition, the sharp peak at 13. sA of 25-33 cm depth and the two broad peaks between 14-10A at 70-S0 em depth are not
charac-Airsirah. B22t. DBC X 75,000
Plate2 Transmission Electron Micrograph of Clay Fraction of Airsirah B22t Horizon at 50-65 cm Depth
G. Gadut. 2B2 x 50,000
Plate 1 Transmission Electron Micrograph of Clay Fraction of G. Gadut 2B2 Horizon at 70-80 cm Depth
moderately steep to undulating relief at about 550 m above sea level. Typical soil is Oxic Dystropept fonned from shale and phyllite member in the Pennian or older sedimentary rocks. However, ifan argillic horizon is proved to be present in this soil, it will be reclassified terized, and need further
study.
Airsirah Plot: The Airsirah plot is in ahill oak forest on a broad and undulating ridge of the Barisan range near the Airsirah pass. The altitude is about 1,100 m. Typical soil is highly leached and acid Tropudult of low fertility. A brown (9. 5YR4. 5/5.3) argillic horizon exists at 20-80 cm in the B21t and B22t horizons. Liquid percentages are 60-80%. Acidity is the strong-est among the four plots. Levels of nitrogen and changeable bases were ex-tremely low below the top 0-4 cm. The XRD and TEM observations in Fig. 8 and Plate 2 indicate the predomi-nant fonnation of spheroidal halloysites and metahal-loysite in the upper horizons and hydrated halloysite in the lower horizons. This sug-gests that volcanic ashes were the major parent mate-rials of the soil, because there is substantial evidence that halloysite fonns as u-nique spherules with
di-ameters of 0.1-0.5 ,urn from volcanic ashes of various compositions [ibid.; Dixon 1977].
Gajabuih Plot: The Gajabuih plot is in a multi-stratal typical tropical rain forest, abun-dantin species of foothill Dipterocarp forest, on a northwestern slope near the ridge with
T. WAKATSUKIet al.: Soilsinthe Toposequence of the Gunung Gadut TropicalRain Forest, West Sumatra as Typic Paleudults or Orthoxic Tropudults.
The effective CEC per 100 g of clay was lower than 24 me (milliequivalent). The XRD shows kaolin and gibbsite in the clay fractions, which are thought to have originated partly from the parent materials.
Katagiri surveyed tropical rain forests and analysed some Oxisols distributed in Jambi, Sumatra, and Sampit, Kalimantan.1) The
effective CEC, base saturation and exchange-able Ca in his samples were only 1.5 (50-110 cm depth) - 3.5 (0-5 cm depth) me/lOO g, 10% or so, and 0.05 (50-100 cm depth) -0.07 (0-5 cm depth) me/100 g respectively. Other reports on Oxisols in Brazil and Africa [Sakuma 1984; Van Wambekeetal. 1983] show similar chemical properties to those found by Katagiri.
Compared with the foregoing data, the Gajabuih soils have a far better chemical nature than Oxisols. Their chemical properties are comparable to those of BA, BB or Bc types of
brown and reddish or yellowish brown forest soils (Dystrochrepts and Oxic Dystrochrepts)in
Japan [Arimitsu 1983]; but their moisture status is comparable to or wetter than those of BE or BF types of the brown forest soils [ibid.].
Pinang Pinang Plot: The Pinang Pinang plot
is also in a foothill Dipterocarp forest on a gentle hill top with a partly narrow and partly broad ridge called Bukit Pinang Pinang at about 550 m above sea level. Typical soil is relatively young Typic Dystropept developed from andesitic parent materials. A prominent red color (5. OYR5. 2/6. 8), strong acidity, and ade-quate carbon, nitrogen and exchangeable base contents characterize this soil. The CEC per 100 g of clay was more than two times that of
1) Personal communication from S. Katagiri, 1983.
Gajabuih. The XRD in Fig. 8 shows AI-vermiculite and kaolin as major clay minerals. These results suggest that soils in the Pinang Pinang plot are younger and more fertile than those of Gajabuih.
ValleyPlain: Table 2 lists some data of a soil
in the valley plain. The soil was sampled at the foot of the Gajabuih plot near the river along the C-C' line in Figs. 3 and 4. The altitude is ca. 420 m. Although the soil has an aquic character (mottling), its chemical fertility is very high; the sum of exchangeable bases is higher than 3 me/100 g of soil throughout the profile.
6. Soil Fertility and Forest Profile In the
Four Plots
Hotta and Ogino [1984] have described forest profiles in the four plots. The Pinang Pinang plot has three strata of high trees, excluding trees smaller than 9 cm in diameter at breast height (DBH): the emergent tree stratum has a height of 52-59 m, the subprominent tree stratum is 20 m in average height. Emergent trees of Dipterocarpaceae have disappeared. But huge cut stumps scattered over the forest floor suggest that the vegetation was once dominated by species of Shorea (Dipterocar-paceae). The Gajabuih plot has a similar basic structure to the Pinang Pinang plot. The emergent tree stratum is 50-61 m in height. In the Airsirah plot, two strata were recognized. The upper stratum is 25-34 m in height. The stand structure of the G. Gadut plot is basically the same as that of the Airsirah plot, but the first stratum is only 20 min height.
Kira and Yamakura have induced an equation for the upper limit of tree height in tropical rain forest [Kira 1983] :
Fig.9-A Soil Map of the Pinang Pinang Plot
o
...jii;;;;;;;jL...O'
E
Soils in the Pinang Pinang and Gajabuih Plots
The upper limit of height in each plot is compared well with the height of the forest profile; actual maximum height of 59 m or higher compared to the H* of 119 m for the Pinang Pinang plot; 61 m vs. 109 m for the Gajabuih plot; 34m vs. 51 m for the Airsirah plot; and 20 m vs. 38 m for the G. Gadut plot.
The value of H*, and maybe the growth of forest, seems to be mainly determined by the soil chemical fertility, which could be described simply by the total calcium contents.
1. Soils in the Pinang Pinang Plot
Adetailed soil map and toposequences along the cross sections D-D' and E-E'are shown in Figs. 9-A and 9-B. Fig. 10 shows topographical maps of the four plots. Although the total area of the Pinang Pinang plot is only 1. 0 ha, three different soil subgroups were recognized, which were further subdivided into seven families, or series, according to their specific properties. The major subgroup was a Typic Dystropept, which was subdivided based on the differences of parent materials, texture, soil depth, degree
o
o temperature and
C is the total calcium content (ton per hec-tare).
The exchangeable calcium
in the four plots can be calculated based on the data in Table2 ;
1. 72 ton/ha for Pinang Pinang plot, 1.46 ton/ha for Gajabuih plot, 0.26 ton/ha for Airsirah plot and 0.12 tonlha for G. Gadut plot.
The ratio of the total calcium to exchangeable calcium varies depending on the type of soil. However, the range is normally 2-14 and the mean is 4.9 [Kawaguchi and Kyuma 1977; Tsutsumi 1973]. We can roughly estimate the total calcium contents in the four plots using the conversion factor of4.9; i. e.,
8.4 tonlha for Pinang Pinang plot, 7.2 tonlha for Gajabuih plot, 1.3 tonlha for Airsirah plot and 0.6 ton/ha for G. Gadut plot.
The upper limit of tree height in each plot can then be calculated as follows:
H*(m) of Pinang Pinang =60+50.6+ 70.6-62= 119, H*(m) of Gajabuih =60+50.6+60.5-62= 109, H*(m) of Airsirah =60+41.8+ 10.9-62=51 and H*(m) of G. Gadut =60 + 35. 2 + 5. 0- 62 = 38. Where H* is the upper
limit of tree height (m), P is the number of
months per year with rainfall higher than 100mm,
T is the mean annual
T. WAKATSUKIet al.: Soilsinthe Toposequence of the Gunung Gadut TropicalRainForest, West Sumatra .-.--TYPic Dystropept
I
~
rhodic clayEiy .: Q) >--;
/::. ~ /".
l"-"-~---r---""""'---';'''';''---r---''''''''Do
~m 100m l~m0
,
12m 30m Gajabuih, represent Pinang Pinang 10m GajabuihLithic Dystropept was found on the very steep ridge and Lithic Eutropept in the steep valley.
Om Om
Airsi rah G. Gadu t
Fig. 10 Topographical maps of the Pinang Pinang, Airsirah and G. Gadut plots. Contour lines intervals of 2 m of relative height.
20m Typic Dystropept aquic, xanthic 10m
Eo
so-E-'
mFig.9-B Toposequences along the Cross Sections0-0'andE-E' Lithic
EutlOpept
of erosion and/or color.
On the broad ridge, andesite fanned Typic Dystropept, fine loamy-clay, with relatively deep soil profile. On the concave slope, water and nutrients accwnulate fanning a Typic Dystropept of aquic and xanthic na-ture. On the ridge, erosion affects soil formation, and a Typic Dystropept with relatively shallow soil depth was fanned.
At the western corner of the plot are limestone pinnacles, shown by black spots in Fig. 10, which fanned heavy clay and deep red soil; Typic Dystropept, rhodic and clayey. On the broad concave valley, Typic Dystropept fanned which was aquic and clayey with mottling features.
N
~
Table 3 Summary of Soil Properties in the Gajabuih and Pinang Pinang Toposequences
c:l')
Color BD!) Liq.2) Sol.
3) Tex- pH pH A]4) Ca Mg K Na CECS) BS6)
Soil Depth
g/cc Vo]% Vol% ture Hl> KC] (me/100 g soil) %
Oxic-Typic 0-5cm 1.5Y3.9/3.1 0.54 60.8 25.5 C 4.4 4.3 1.5 10.8 0.31 0.44 0.05 13 88.6 Dystropept 15-25 8. 9YR4.2/4. 7 0.72 60.8 27.0 C 4.1 4.0 5.7 0.79 0.06 0.12 0.04 6.7 15.0 (ridge) 45-55 8.0YR4.1/5.5 0.96 54.7 34.9 C 4.4 3.9 5.3 0.09 0.01 0.02 0.05 5.5 3.1 95-105 8.0YR4.3/5.5 1.05 53.7 37.7 C 4.5 3.8 5.6 0.08 0.01 0.02 0.07 5.7 3.1 ... 0 Oxic 0-5cm 9.0YR3.6/2.8 0.52 60.1 22.2 C 4.8 4.6 2.1 11.3 0.42 0.28 0.07 14 85.3 ~ ..c:: Dystropept 15-25 8.9YR4.2/4.2 0.81 56.8 29.8 C 4.5 4.1 3.1 0.81 0.04 0.06 0.06 4.0 24.0 'S (slope) 45-55 8.9YR4.2/4.7 0.91 56.6 33.3 C 4.6 4.0 2.7 0.30 0.02 0.03 0.05 3.1 12.7 .n til "(? 95-105 1.6Y4.5/4.5 1.03 54.9 37.4 C 4.8 3.9 3.3 0.22 0.07 0.04 0.06 3.7 10.5 l? Oxic 0-5cm O.38Y3. 4/2.6 0.38 68.0 18.0 C 5.6 5.5 0.3 16.7 1.00 0.55 0.04 19 98.4 ~
Dystropept 15-25 1.1Y4.3/4.2 0.75 65.7 27.7 C 4.8 4.2 1.6 4.05 0.35 0.12 0.03 6.1 73.8 jij\-'-.J aquic, eutric 45-55 1.6Y4.2/4.5 0.83 64.0 30.8 C 4.7 4.0 3.0 1.28 0.10 0.05 0.02 4.5 32.3 ~~
(valley) 95-105 1.3Y4.6/4.7 0.96 62.6 34.9 C 5.0 4.0 4.9 0.96 0.11 0.03 0.02 6.1 18.5 '-.J ~ 0-5cm 9.6YR4.0/3.9 0.70 49.5 29.2 SCL 4.1 4.0 3.1 6.37 1.13 0.31 0.02 11 71.9 ~} Lithic Dystropept 15-25 8.0YR4.9/5.5 1.10 42.8 40.8 SCL 4.1 4.0 4.8 0.16 0.03 0.04 0.01 5.0 4.8 N~ ~ (narrow 40-50 7.6YR5.1/7.0 1. 35 33.0 42.0 SCL 4.4 4.0 6.9 0.05 0.02 0.03 0.01 7.0 1.6 w
ridge) 50-60 8.0YR4.8/5.5 1.25 47.8 43.8 SL 4.4 4.0 6.3 0.17 0.06 0.03 0.01 6.6 4.1 <JID
... Lithic 0-5cm 2.1Y3.7/2.3 0.50 65.7 20.8 L 5.5 5.3 0.3 14.8 3.32 0.58 0.02 19 98.4
0
Eutropept 15-25 1.1Y4.4/4.2 1.55 34.0 54.0 SCL 4.8 3.7 6.8 4.04 5.15 0.14 0.05 16 58.0
0:
~ (steep slope) 30-40 2.8Y4.5/3.7 1.50 36.3 53.6 SL 5.7 3.8 3.0 7.48 6.79 0.06 0.06 14 82.6
til
=
Typic 0-5cm 9.2YR4.5/4.6 0.52 56.9 21.6 C 4.4 4.2 5.9 8.50 0.94 0.34 0.10 16 62.8A::
~ Dystropept 15-25 8.0YR4.9/6.0 0.96 52.6 33.9 CL 4.1 3.9 8.4 0.66 0.14 0.08 0.06 9.3 10.1
til (broad ridge) 45-55 6.8YR5.0/6.5 1.15 50.9 41.8 CL 4.7 4.0 7.8 0.20 0.02 0.05 0.15 8.2 5.1
=
A:: 95-105 6.6YR4.7/5.8 1.31 45.9 46.7 SCL 4.8 4.0 7.9 0.17 0.06 0.06 0.04 8.2 4.0
Typic 0-5cm 7.8YR3.8/3.3 0.58 59.0 24.0 C 4.8 4.7 0.7 13.6 1.46 0.35 0.05 16 95.5
Dystropept 15-25 5.1YR4. 7/5.9 1.00 54.2 36.2 C 4.6 4.0 5.4 2.43 0.36 0.04 0.04 8.3 34.5
rhodic, clayey 45-55 4.6YR4.6/6.2 1.10 53.9 39.2 C 4.8 4.0 5.7 0.50 0.09 0.02 0.02 6.3 10.0
1) bulk density (g/ce); 2) liquid volume %; 3) solid volume %; 4) IN KCI extractable acidity (me/100 g soil); 5) effective cation exchange capacity=sum of exchangeable cations; 6) percentage of base saturation.
~ ~
~
c
~ ~ (J) g, rn :l' ~l
rn (1)~
@a
~ CJJ
CJ~
~
[ ::tlS·
~
~ ~ ~ (J)i
~ 54.9 2.4 2.7 5.0 86.4 51.3 14.7 8.9 46.7 4.3 3.4 5.0 18 8.4 8.2 10 19 8.9 6.6 6.6 14 7.9 7.0 6.4 0.18 0.08 0.12 0.05 0.18 0.09 0.08 0.05 0.05 0.02 0.02 0.02 (') (Jl ~ e:..~~t§
;l> Pol ... ()Q C/) r:t. ~ ~ S-fr
~,g
o . o . r o[In''
... ' "0 ~ ~ (D' ;i' (J) ::r~o 0. ~ '<: I (J)s:.
ro~~en~~ ~('t) (J)~ =:;~ (D 0 5' ("') ..f: '"1 ... (') r:t.3
~' ~S-('t)§~~ 0. (D ET ~ So: S- '"0 ('t) I ~ "tl ro (D"t:! ~o._ . - + § ~ ~ Er~ ~ PJ' ~ ro (D .-+ =' ... en C ::r ... @ ~ ~ 0.g
_ , (D ... ~ 0 Ul~ ( D : : 3 U l ::r .-+ :3. S' ~ (D ::r PJ -PJ ('t) Ui~~ :J. ~ 0'6' =' 0.55 0.06 0.04 0.02 0.52 0.11 0.04 0.03 0.47 0.07 0.02 0.03 1. 34 0.01 0.01 0.09 2.60 0.69 0.15 0.15 1.08 0.09 0.07 0.07 7.54 0.05 0.05 0.35 12.9 3.69 0.70 0.36 5.08 0.16 0.13 0.20 7.9 8.2 7.9 9.6 2.6 4.3 5.6 6.0 7.7 7.6 6.8 6.1 "0 S'Er
t::lEr ...,
l=:S-55
~('t),< ~~ ("')...,~a:
:3 0"q.
(=)'g
go
5' o ::l ""I 0...e:
('t) =' ('t)e: 0 "0 ::r t::l 5' ro l:!:. (J) PJCb('t)'--"()Q ;::r . PJ' 0 . -:=t- ...en~,~ro ~(')~ o q 0 ( ' t ) ( J ) O X S - 0 S - " " I &s'
~ ~ ('t) ~ Cb ro en PJ~""I't::la
o < 2 ' : ~~ - . (')(D(')~ .g~.-+ ::r - =:; >< 0 =:; ::r PJ<Cb(JlPJOQ ro ~PJC::~ ::3-I-i ... _ (=;=~ '-+PJ~ \oJ .-+ ('t) ::J. 0 2': 't::l S' ('t)'<:(') ("')2': 'PJ :t v, ~ =' 0" ~ ~'Jg
0 0... c:: PJ ::r~'t::l ~ '"0 .-+ ~. ~ (D en 0 (D ~' (') E =: f!!, @ =ss'
~("')'
::s,
~ r:t. ()Q '-' 0. 0 ""I ~'<: ::3()QE::3 (D"O3
(Jl Pol ('t) ... en (') -q-2"
v. •• 0g.
o '"' '"' Q g . ~ "0 ro 0 ~ 0s,
;:::;:('t)~ o.~ N 4.0 3.9 4.0 3.9 4.5 4.2 4.2 4.2 3.8 4.0 4.0 4.0 ~ 3.8 4.2 4.7 5.0 4.9 4.7 4.9 5.1 3.9 4.2 4.7 4.8 C C C C C C C C C CL SL SL 17.4 28.4 32.9 41.1 23.4 32.3 36.6 40.8 26.1 40.4 42.2 45.4 ::J CJ 0.: 'b ~, ...,~~~~~~
't::l5"
~(;)
~. ~55
C w §. "tl -, a.s.. PJ $: "'tg, ....
a
enSo:.g.
::3@'"O§~~ S' 0. S'3
.a
~.(')
~ ~c
enre
g. ()Q ~' ~ _, ("') 0 ro IoC:l ;::t ::r;;J ~en ~ ... ~ ' - + ; ; ; l::t::S--°
0' ~ en (i ~ 'g =' ()Q&
~
"tl CJ) ... . . . ro (Jl5
't::l ~ .0 "0 "0 '"' .... c:: " " 1 0 0 ~ ro 0 en 't::l V"l ::3§
ro ro '"t:l~
'.g
a,
_,
~ ro ro ;::t ~ ~ ::3 ene
::r ... (') ~ ro ro S' V"l ro S' ~ ~ ~ ~;::t 70.7 62.0 62.8 57.5 59.6 59.1 58.0 55.2 64.7 60.0 59.0 51. 4IJ
0.40 0.74 0.89 1.15 0.56 0.87 1. 02 1.12 0.48 0.83 0.98 1. 23/~
9. 4YR4.1/3. 9 7.9YR4.9/5.5 6.6YR5.1/6.6 4.6YR4.6/6.2 1.3Y5/6 10YR5/6 8.8YR5.0/5.4 8. 1YR5 .0/5. 5 0.9Y4.1/3.8 8. 7YR5.1/6. 5 8.1YR5.1/6.0 8.1YR4.9/5.6 0-5cm 15-25 45-55 95-105 0-5cm 15-25 45 55 95-105 0-5cm 15-25 45-55 95 105 Typic Dystropept aquic, clayey Typic Dystropept erodic OIJ C CIl c 0: ... o p::; OIJ , • @ 1yplC .5 Dystropept 0... aquic, xanthic "'!j ~. (fl o t=: 3: ~ o -.~
CJ ~. ~§:
"tlo
..
Table 4 Chemical Composition of Leaves. Bark and Earth-worm Feces Collected from the Pinang Pinang and Gajabuih Plots
N
% Ca/Mg
Ratio
Ca Mg K Na
(me/100 g dry matter)
123 29 33 0.039 4.2 134 7.5 15.6 0.026 18 46 7.9 0.83 0.14 5.8 1.6 133 16.7 22 0.41 8.0 183 6.7 9 0.26 27.3 39 2.5 0.78 0.04 15.6 1.2
The exchangeable CalMg ratios of the surface horizons in the Gajabuih plot were more than three times higher than those inthe Pinang Pinang plot. That in the Gajabuih plot was 17-35, mean 23, whereas that in the Pinang Pinang plot was 3-9.6, mean 6.0. The same difference appears in leaves, bark and earthworm feces as shown in Table 4. That in the Gajabuih plot was 8-27, whereas thatinthe Pinang Pinang plot was 4-18.
Bowen [1966; 1979] reported a total CalMg ratio of 2-9, mean 5.5, in terrestrial plants. Kawaguchi and Kyuma [1977] reported the mean ratio of exchangeable CalMg of paddy
Fig.l1-B Pinang Pinang Leaf (n=13) Bark (n= 14) Earthworm Feces (n=3) Earthworm Feces (n=3) Gajabuih Leaf (n= 18) Bark (n=18) of parent materials is also strong, with
redder color of the B horizons developing as follows: limestone>
andesite> shale. 1:
Cl
Bulk density(BD) shows a reverse
l
correlation with liquid volume per- III
'0m
•
.~ ,
centages. The BDs were generally 1ii ,,/
£
_.--lower than 1.0 glee, which indicates ---.----
+---r---...-"""
good physical structure. However,F
0the Lithic Dystropept and Eutropept in the Pinang Pinang plot have BD higher than 1. 3-1. 5 glee, which indi-cates physical conditions so poor as to prevent root growth.
There is a clear tendency for nutrients to be distributed deeper in the soil profiles in the valleys than on the ridges. As a result, pH values and base saturation increase.
One prominent feature of the soil profiles in both plots is nutrient accumulation in the surface horizons. This suggests intense and effective nutrient cycling through the forest ecosystems.
Table 4 shows the chemical composition of leaves, bark and earthworm feces collected from the Pinang Pinang and Gajabuih plots. The contents of calcium, magnesium and potassium
in leaves and bark were more than 10 times those in the
0-5
em horizons. Earthworms and other soil animals consume this plant litter and excrete very fertile fecal materials, as shown in Table 4, which can be termed natural ball fertilizers. The morphology and size of feces collected at the plots are shown in Fig. 12. Numbers 14 and 15 in Fig. 12 are the earthworm feces analysed in Table 4. The origins of the others were not identified.T. WAKATSUKIet at.: Soilsinthe Toposequence of the Gunung Gadut Tropical Rain Forest, West Sumatra
2 0 0 0 0 0
3 0 0 0 0 0
Soil Moisture Dynamics in the Pinang Pinang and Gajabuih Plots
Rainfall data shown in Table 1 demonstrate the extremely wet condition of the G. Gadut area throughout the year. Even in the driest month, rainfall in the plots should be higherthan in the month of highest rainfall in Singapore. Nieuwolt [1965] concluded that there was no water deficit in Singapore. But by calculating the water balance from monthly measurements over three years, Nieuwolt found that short periods of deficit occurred when the monthly rainfall was less than 150 mm [ibid. (cited from Whitmore [1975: 48])]. However, as shown in Table 1, even the lowest monthly rainfall should be higher than 300 mm in all the four plots. This suggests that there is also no water deficit in soils. This conclusion was confirmed by the direct measurement of seasonal changes of soil moisture status.
More than 50 gypsum block soil moisture sensors were buried at depths of 15 and 45 cm in the Gajabuih plot and another 50 were buried in the Pinang Pinang plot. Their locations are shown by white circles in Figs. 9-A and ll-A. Soil moisture measurements were carried out at intervals of 2-3 weeks.
The results are summarized in Fig. 13. The level of Mg.
This CalMg imbalance has, however, pro-duced no observable effect on the forest ecosystem. The reason for the imbalance is not clear. One possibility is an influx of calcium-rich dust from a concrete factory in the town of Indarung. As shown in Fig. 3, the Gajabuih plot is nearer to Indarung than the Pinang Pinang plot. 4 0 0 0 0 0 500000 (>00000 13
•
14
4
0
2cm
I I 15Scale
700000
8 0 0 0 0 0
~OOOOO
1000000
1100000
soils in tropical Asia to be 1. 9, while Arirnitsu [1983] reported a value of 4. 1 for brown forest soils in Japan. These data suggest that soils in the Gajabuih plot have an abnormally high CalMg ratio, probably as the result of a low
Fig. 12 Morphology and Size of Fecal Materials Collected from the Forest Floor at the Gajabuih and Pinang Pinang Plots
Pinang Pinang
Plot
+ + + 8 7 C 6 .::t:. cD 5 0 c::: Cll-
en 4 '(j) Q) 3 a: 2 + + + + 0 o 1\'.
,.
+ I ,1
0\ + :, ~o, , ' + + I ~ ~ o 0 + + + + + ++!
... \
+ 42 ++ + 0l
I~ + o ., 0 0 I " - 50 o 0°
~..o", 0 . " ",*'.'
.
•. "..----#-- •.$..+--- -'-.,/',,' "~ \ 0 _ 58 ----~+ + + + ~ + + + + 0 0 i... - 66 o~ooo 0 0 ° 0 0 0 0 + ~o 1983 1984Gajabuih
Plot
0 7 C 0 0~
6 fil 0 .::t:. + o + ~ cD 5 0 + + + -42~
0 + 0 + + c::: o !j1 + ~ 0 + o ~ ~+ !j1 CD 4 0 - 50 ~'..- ' en '(j) , < Q) 3~
- 58 Q. a: + 0 0 0 0 0 c::: t> + + fil 3 CD 2 + o o ° e - 66 0 + 0 '*-0 + 0 J F M A M J J A 5 0 N D J F M A 1983 1984+ 15em depth, minimum or maximum, # mean at 15 em depth.
o 45 em depth, minimum or maximum,
•
mean at 45 em depth,Fig. 13 Soil moisture dynamics inthe Pinang Pinang and Gajabuih plots. Gypsum soil moisture sensors were buried at depths of 15 and 45 cm at the locations shown by white circlesinFigs. 9-A and ll-A. The solid and broken lines are mean values at 45 and 15 em depth respectively. Resistances in kO are also converted to volume percentages.
solid and broken lines are mean values at 45 em and 15 cm depth respectively, and the wettest and driest readings at 15 cm (+) and 45 em
( 0) are also shown. The resistance readings are rougWy converted to soil water volume per-centages on the vertical axis.
260
The seasonal variations were small in both plots. Mean soil water percentages were higher than 50% by volume, which means that there was no water deficit throughout the year. February was the driest month, while the following months, March and April, were the
T. WAKATSUKIet al.: Soilsinthe Toposequence of the Gunung Gadut Tropical Rain Forest, West Sumatra
wettest. From July to September, readings at Gajabuih showed relatively dry conditions. These trends were in accord with the general monthly rainfall pattern, but absolute differ-ences were so small that no water deficit would be expected ineither plot.
Acknowledgment
We are grateful to have participated in the overseas scientific survey project organized by Prof. K. Ogino, Ehime University, and Prof. M. Hotta, Kyoto University. The project was supported by the Ministry of Education, Science and Culture of Japan (grants no. 57041029 and 58043028). We thank most sincerely the organizers of the Sumatra Nature Study (SNS) project, particularly Prof. S. Kawamura of Kyoto University, leader of the project, and Dr. Amsir Bakar of Andalas University, head of the Indonesian counterparts of SNS. We acknowledge with many thanks the assistance rendered by Dr. Y. Katayama, Prof. A.Aoki, Mr. N. Okada, and Mr. Y. Abe in chemical analyses by neutron activation at the research reactors of Rikkyo Univeristy and Kyoto University. We are grateful toMr. E. Muctar for his assistance in the field survey and soil moisture determinations, Mr. N. Okagawa for carbon and nitrogen analyses, Ms. M. Sugiyama for chemical and XRD determinations, and Mr. K. Nishio for chemical and TEM analyses. The transmission electron micrographs were obtained through the assistance of Prof. M. Nozu, and X-ray diffraction analysis was carried out by Drs. Y. Yamaguchi, T. Watanabe, and T. Suzuki, Shimane University.
References
Arimitsu, K. 1983. Rinya Dojyo no Shurui to Seishitsu [Classification and Properties of Forest Soils]. InNihon no Shinrin Dojyo [Forest Soils in
Japan], edited by the Members of Committee for the Nihon no Shinrin Dojyo, pp.41-62. Tokyo: Nihon Ringyo Gijyutsu Kyokai.
Baillie,I.
c.;
and Ashton, P. S. 1983. Some Soil Aspects of the Nutrient Cycle in Mixed Dipterocarp Forests in Sarawak. In Tropical Rain Forest: Ecology and Management, editedby S. L. Sutton, T. C. Whitmore and A. C. Chadwick, pp. 347-356. Oxford: Alden Press. Bowen, H. J, M. 1966. Trace E~ntsin
Biochemis-try. London: Academic Press.
- - - - , . 1979. Environmental Chemistry of the Elements. London: Academic Press.
Burnham, C. P. 1975. The Forest Environment-Soils. In Tropical Rain Forests of the Far East,
edited by T. C. Whitmore, pp. 103-120. Oxford: Clarendon Press.
Dixon, J, B. 1977. Kaolinite and Serpentine Group Minerals. In Minerals in Soil Environments,
edited by J, B. Dixon and S. B.Weed, pp. 357-403. Wisconsin: Soil Science Society of America.
FAO-Unesco. 1974. Soil Map of the World 1 :
50ססoo, Vol. IX, Southeast Asia. Paris: Unesco.
Hotta, M.; and Ogino, K. 1984. Forest Ecology and Flora of G. Gadut, West Sumatra. Kyoto: Sumatra Nature Study (Botany), Kyoto Uni-versity.
Kastowo; and Leo, G. W. 1973. GeologU Map of the Padang Quadrangle, Sumatra. Bandung:
Geo-logical Survey of Indonesia, Ministry of Mines. Kawaguchi, K. ; and Kyuma, K. 1977. Paddy Soils in
Tropical Asia, Their Material Nature and Fertility. Honolulu: University Press of Hawaii.
Kira, T. 1983. Nettairin no Seitai [Ecology of
Tropical Forest]. Kyoto: Jinbun Syoin Press. Nieuwolt, S. 1965. Evaporation and Water Balances
inMalaya.]. Trop. Geogr. 20: 34-53.
Nishimura, S. 1980. Physical Geology of Indonesian Island Arcs. Kyoto: Kyoto University.
Ogino, K. 1985. Nishisumatora deno Nettairin no Kosin Katei [Regeneration Process of Tropical Rainforest in Western Sumatra]. Nettai Ringyo
[Tropical Forestry] 4: 2-12.
Oldeman,L. R. ;Las, I. ;and Darwis, S. N. 1979. An Agroclimatic Map of Sumatra. Contr. Centro Res. Inst. Agric. Bogor 52: 1-35.
Rosidi, H. M. D. ; Tjokrosapoetro, S. ; and Pendowo, B. 1976. GeologU Map of the Painan and Northeastern Part of the Muarasiberut Quadran-gles, Sumatra. Bandung: Geological Survey of
Indonesia, Ministry of Mines.
Sakuma, T. 1984. Nettai Anettai niokeru Enkiyodatsu Dojyo no Bunpu to Sono Tokusei [Distribution and Properties of Highly Leached Soils in Tropics and Subtropics]. InSansei Dojyo to Sono
*m7~7M~ 24~3%
Nogyo Riyo [Acid Soils and Their Agricultural Use], edited byA. Tanaka, pp. 51-1()(). Tokyo: Hakuyusha Press.
Silitonga, P. H. ; and Kastowo. 1975. Geologic Map of the Solok Quadrangle, Sumatra. Bandung: Geo-logical Survey of Indonesia, Ministry of Mines. Tsutsumi, T. 1973. Sinrin to Bussitsu junkan
[Carbon and Mineral Cycling in the Forest Ecosystem]. Tokyo: Kyoritsu Press.
USDA Soil Management Support Service. 1983. Keys to Soil Taxonomy. New York: Agronomy Department, Cornell University. 244 pp.
262
Van Wambeke,A.; Eswaran, H.; HerbiUon, A.J. ; and Comenna,J. 1983. Oxisols. InPedogenesis and Soil Taxonomy, Vol. 2, The Soil Orders,
edited by L. P. Wilding, N. E. Smeck and G. F. Hall, pp. 325-354. Amsterdam: Elsevier. Wada,K. 1977. AUophane and hnogolite. InMinerals
in Soil Environments, edited by
J.
B. Dixon and S. B. Weed, pp.603-638. Wisconsin: Soil Sci-ence Society of America.Whitmore, T. C. 1975. Tropical Rain Forests ofthe