DOI: http://dx.doi.org/10.14947/psychono.34.2
Effects of sound marker durations on the perception of inter-onset time intervals:
A study with instrumental sounds
Emi Hasuo
a,b*, Yoshitaka Nakajima
c, Michiko Wakasugi
d, and Takuya Fujioka
daNeurological Institute, Kyushu University, bJapan Society for the Promotion of Science,
cDepartment of Human Science/Research Center for Applied Perceptual Science, Kyushu University,
dHuman Science Course, Graduate School of Design, Kyushu University
Previous studies have shown that the time interval marked by the onsets of two successive pure tone bursts is perceived to be longer when the second sound marker is lengthened. The present study examined whether this phe-nomenon appeared in a more natural setting in which the time interval was marked by instrumental sounds with complex temporal and spectral structures. Real piano sounds and synthesized sounds that simulated either just the temporal structure of the piano sound or both its harmonic and temporal structures were used as sound markers. Lengthening the second marker increased the perceived duration of the interval, as in previous studies, but only in limited cases, and this did not occur in an experiment in which only the synthesized piano sounds were used. Thus, the effect of sound durations was weakened with the new series of sounds. Characteristics of piano sounds that were not captured in the synthesized sounds seem to have played an important role in duration perception.
Keywords: time perception, inter-onset intervals, rhythm, musical instruments, piano, sound marker duration
1. Introduction
Time perception studies have shown that even when the physical durations of two time intervals are equal, their per-ceived lengths can differ depending on the stimuli that mark the time intervals (e.g., Grondin, Ivry, Franz, Perreault, & Metthe, 1996; Hasuo, Nakajima, Osawa, & Fujishima, 2012; Woodrow, 1928). For the duration of a silent “gap” marked between two successive sounds (i.e. an offset–onset interval), it has long been known that lengthening either of the two sounds increases the perceived length of the time interval (Woodrow, 1928), and a similar effect has been shown with in-termodal intervals (Grondin et al., 1996; see also Kuroda, Ha-suo, Labonté, Laflamme, & Grondin, 2014). Also, for time in-tervals marked by the onsets of two successive sounds (i.e. an
onset–onset interval), lengthening the second sound increased
the judged interval (Hasuo et al., 2012; see also Hasuo, Naka-jima, & Hirose, 2011), but lengthening the first sound did not have a stable effect. Although the effect of the first marker duration did not always appear, these studies suggest that the
durations of the marker stimuli can be one of the important factors in determining the perceived length of a time interval.
Lengthening the second marker stably increased the per-ceived length of the time interval for both offset–onset and onset–onset intervals (e.g., Hasuo et al., 2012; Woodrow, 1928). There are two possible explanations regarding the effect of the second marker duration. The first is that the moment of perceptual occurrence of a sound, i.e. the P-center (Morton, Marcus, & Frankish, 1976) of the sound marker, may have been delayed when the marker was lengthened (Howell, 1988; Marcus, 1981; Scott, 1998; Terhardt & Schütte, 1976; Vos, Mates, & van Kruysbergen, 1995). In this case, lengthening the second marker would delay its P-center, which would lengthen the interval between the P-centers of the first and the second marker, resulting in a longer perceived interval. The second is that the lengthening of the second marker may have delayed the processing of the time interval (Hasuo et al., 2012). This is based on the processing time hypothesis (Nakajima, 1987), which assumes that the perceptual processing of a time inter-val continues for about 80 ms after the detection of the second-marker onset, and that the time needed for this “additional processing” is included in the perceived duration of this time interval. In this case, lengthening the second Copyright 2015. The Japanese Psychonomic Society. All rights reserved. * Corresponding author. Neurological Institute, Kyushu
University, 3–1–1 Maidashi Higashi-ku, Fukuoka, 812– 8582, Japan. E-mail: [email protected]
marker might interfere with the additional processing, causing the time needed for the processing to increase, which would result in longer perceived length of the time interval. Both explanations suggest increase in the perceived length of the time interval as the second marker lengthens, and the two explanations are not mutually exclusive.
Hasuo et al. (2012) related the effects of stimulus durations to rhythm perception in everyday life, such as in speech and music. Their study was based on a general belief that rhythm is closely related to the time intervals between onsets of suc-cessive sounds (e.g., Handel, 1993; Patel, 2008), and that short time intervals up to a few hundred milliseconds appear fre-quently in music (Fraisse, 1982) and in speech (e.g., Greenberg & Arai, 2004; Kato, Tsuzaki, & Sagisaka, 2003). They thus uti-lized time intervals of 120–360 ms, marked by the onsets of successive sounds. Given that they employed the type of time intervals that frequently appears in speech and in music, it seemed plausible that the effects of marker durations as re-ported by Hasuo et al. (2012) would also appear in speech or musical patterns.
A critical difference between the experiments of Hasuo et al. (2012) and real speech or music was that the stimuli em-ployed in Hasuo et al. (2012) were artificial, i.e., physically simple: 1000-Hz pure tones, with smooth rise and fall parts and (if any) steady-state portions. The sounds we hear in our everyday life, however, have complex structures, both spectral-ly and temporalspectral-ly (e.g., Handel, 1989). It has been reported that the frequency or the spectral structure of sounds can in-fluence the perceived duration of the sounds (e.g., Fastl & Zwicker, 2007), and that the frequency of sounds can influence the perceived duration of offset–onset intervals (Lake, LaBar, & Meck, 2014) as well as that of onset–onset intervals (Pfeuty & Peretz, 2010). Moreover, changing the duration of a sound that has a complex temporal envelope might be less effective than changing the duration of a steady-state sound: if there was not much sound energy in the part in which the duration changed, increasing the duration could have less influence on the P-center location (e.g., Howell, 1988) or have less interfer-ence on the additional processing of the time interval (e.g., Hasuo et al., 2012), compared to steady-state sounds with more sound energy in the part of the duration change. Given this, it was not yet clear whether the effects of marker dura-tions found in Hasuo et al. (2012) could be directly applied to rhythm perception as in speech and music. It seemed neces-sary to examine whether the effects of marker durations could
be observed with sounds with complex spectral and temporal structures.
The aim of the present study was to examine whether the effects of sound durations found with physically simple labo-ratory sounds can be applied to time perception with natural sound markers that have complex spectral and temporal struc-tures. We chose piano sounds as common instrumental sounds to mark time intervals. Piano sounds can change in a large temporal range (e.g., Palmer & Brown, 1991; Seashore, 1938), and they have the temporal characteristic to reach max-imum amplitude in a short time from the onset, and to decay gradually after that (e.g., Repp & Marcus, 2010; Seashore, 1938).
To fill the gap between the physically simple sounds utilized in Hasuo et al. (2012) and the real piano sounds, we employed three types of sounds: (1) recorded piano sounds, (2) sounds synthesized to imitate the recorded piano sounds, and (3) pure tones with temporal envelopes as in the recorded piano sounds. In three experiments,1 we examined whether and how
the durations of the first and the second sound influenced the perceived length between their onsets. Using three different types of sounds would allow us to see whether the spectral structure or some other features specific to real piano sounds played important roles to determine the perceived lengths of the time intervals.
2. Experiment 1
The aim of Experiment 1 was to examine whether varia-tions in piano sound duravaria-tions marking a time interval affect-ed the perceivaffect-ed length of that interval. We usaffect-ed three types of sounds: real piano sounds (P), synthesized sounds with 7 fre-quency components (S7), and synthesized sounds with 1
fre-quency component (S1). The two types of synthesized sounds
(S7 and S1) were shaped using the temporal envelope of the
waveform of each real piano sound (Figure 1).
The design and the procedure of the experiment were simi-lar to those in Hasuo et al. (2012). Since the loudness of the sounds of different spectral structures could be different, we conducted a loudness-matching session before the main ex-periment.
1 All experiments in this study were a part of a research
project approved by the research ethics committee of the Faculty of Design, Kyushu University, and were conducted as declared.
2.1. Method
2.1.1. Participants
Ten students (5 females and 5 males, aged 22–46) with nor-mal hearing participated. Five had received basic training in music at the School of Design, Kyushu University, two had re-ceived professional training in music, and the remaining three had received music education only in the compulsory educa-tion in Japan.
2.1.2. Stimuli and Apparatus
As the real piano sound P, we used the C6 (high C) sound, which was the 64th key in the standard modern 88-key piano. This key was chosen for the present study because its funda-mental frequency was close to 1000 Hz, which was used in our previous studies (Hasuo et al., 2011, 2012). The key was played with the right middle finger, from the initial hand-position where the finger was touching the key (thus, not too strongly and not too softly), and the key was kept pressed until the sound completely decayed. Four pianos, i.e. Steinway & Sons
(B571223 and O578208), Yamaha (C6), and Kawai (SK-3), were used for the recording, and the sound of Kawai (SK-3) was selected for the experiment, because its waveform and temporal envelope were relatively clear and seemed most suit-able for the present experiment. The piano sounds were re-corded in a quiet booth with ambient noise under 40 dBA, and a digital recorder with built-in microphones (Edirol R-09) was used; it was located close to the C6 strings.
The synthesized sound S7 had 7 sinusoidal components whose frequencies and relative levels imitated those of the real Figure 1. Waveforms and spectrograms of the sounds used in Experiment 1: The duration of the sounds was 40 (a–c), 100
(d–f), or 180 (g–i) ms. Note that the time range of the x axis is different for each duration. There were three types of sounds: The sound cut out from a recorded piano sound, P (a, d, g), the synthesized sound with seven frequency components, S7 (b,
e, h), and the synthesized sound with one frequency component, S1 (c, f, i). In each section, the upper panel shows the
wave-form, and the lower the spectrogram.
2 We also measured the frequencies of the seven
com-ponents using two other FFT sizes (1024 and 2048) and at 7 other time points (centered at 20, 40, 80, 100, 120, 140, and 160 ms from the sound onset), but the measured frequencies did not differ much from those shown in Table 1. The onset of the recorded piano sound was determined as the time point where the amplitude of the extracted temporal envelope reached 0 for the first time, going back from the point of the peak amplitude.
piano sound (P). The sound was given a temporal envelope which was extracted from the waveform of the real piano sound (P). The frequencies and the relative levels of the com-ponents were determined by analyzing the recorded piano sound using a Hanning window with an FFT size of 4,096 (sampling frequency was 44,100 Hz) centered at 60 ms from the sound onset.2 The measured frequencies and levels of the
first to the seventh frequency component are shown in Table 1. Note that 0 dB in the table corresponds to the maximum amplitude possible without causing clipping. The measured frequencies of the components in the real piano sound were not strictly the same as the harmonic frequencies of the
funda-mental frequency (Figure 2), as had been reported in the liter-ature (e.g., Schuck & Young, 1943). The temporal envelope of the recorded piano sound was obtained by squaring the ampli-tude of the recorded piano sound at each sample point, smoothing these values with a moving Gaussian window (σ = 1 ms), and calculating their square roots. Thus, each si-nusoidal component of the synthesized stimulus had the same temporal envelope, and its relative level against the other com-ponents was fixed following a reference spectrum of the real piano sound at the 60-ms point.
The synthesized sound S1 was made by applying the same
temporal envelope as above to a 1044-Hz pure tone. This fre-quency was the fundamental frefre-quency of the recorded piano sound (Table 1).
The duration of the three types of sounds was 40, 100, or 180 ms. These duration values were chosen from our previous study (Hasuo et al., 2012), which employed markers of 20 to
Figure 2. Theoretical frequencies of the harmonics of a 1044-Hz complex tone and measured frequencies of the first seven frequency components (the fundamen-tal and the first six overtones) of the recorded piano sound.
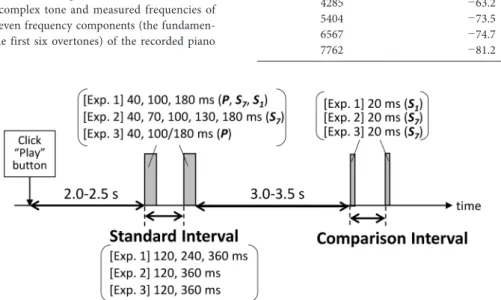
Figure 3. Time chart of the stimulus pattern. The grey rectangles represent sounds. In the experiments, participants adjusted the comparison interval to make its subjective duration equal to that of the standard interval. Note that standard and com-parison “interval” refers to the duration between the onsets of successive sounds.
Table 1.
Frequencies and levels of the seven frequency components of the recorded piano sound. The sound pressure levels show the relative levels between components, and 0 dB corresponds to the maximum amplitude possible without causing clipping.
Frequency (Hz) Sound pressure level (dB)
1044 −16.6 2110 −40.4 3176 −61.3 4285 −63.2 5404 −73.5 6567 −74.7 7762 −81.2
340 ms and showed clear effects of the second marker dura-tion when it was changed in the range of 20 to 100 ms. The 20-ms duration was omitted because it was not a realistic dura-tion for piano sounds: The attack pordura-tion at the beginning of the sound, which cannot be shortened even when played at staccato, already took about 20 ms (Figure 1). Since it was very difficult to play the piano with these exact durations, we re-corded the piano sound until it completely decayed, and at the last step of stimulus generation, the sounds were cut at desig-nated durations with a fall time of 5 ms.
In the main part of the experiment, each presentation con-sisted of a standard interval and a comparison interval, in this temporal order (Figure 3). The standard interval was 120, 240, or 360 ms. The three types of sounds (P, S7, and S1) were used
to mark the standard interval, and for each sound type, the durations of the first (beginning) marker and the second (end) marker were varied independently. All possible combinations of the three durations (40, 100, or 180 ms) were used for the first and the second marker of the standard interval, except when the standard interval was 120 ms, in which case the 180-ms sound was not used as the beginning marker; this was to avoid temporal overlap between the first and the second mark-er. The comparison interval was marked by two pure tone bursts of 1044 Hz with a duration of 20 ms, divided into a rise and a fall time of 10 ms. The same sounds were also used to mark the standard interval in the control condition. Note that the standard and the comparison intervals were from the on-set of the first marker to the onon-set of the second marker (i.e., an inter-onset interval, IOI).
Thus, for the standard interval of 120 ms, there were 18 stimulus conditions (2 (first marker durations)×3 (second marker durations)×3 (sound types)). For the standard inter-vals of 240 and 360 ms, there were 27 stimulus conditions each (3 (first marker durations)×3 (second marker durations)×3 (sound types)). With the 3 stimulus conditions for the control condition (1 (first marker duration)×1 (second marker dura-tion)×3 (standard intervals)), there were 75 stimulus condi-tions in total (18 (for standard interval of 120 ms)+27 (for standard interval of 240 ms)+27 (for standard interval of 360 ms)+3 (for the control condition)).
The piano sounds were recorded and analyzed, and the stimuli were generated digitally (16 bits; a sampling frequency of 44100 Hz) on a personal computer (Dell Precision M60). During the experiment, stimuli were controlled by another personal computer (Frontier KZFM71/N) with an audio card
(E-MU 0404), and were presented diotically to the participant via a digital-to-analogue converter (Onkyo SE-U55GX), an ac-tive low-pass filter (NF DV8FL, 15 kHz), a graphic equalizer (Roland RDQ-2031), an amplifier (Stax SRM-212), and head-phones (Stax SR-202). The levels of the sounds were measured with a sound level meter (Node 2075) and an artificial ear (Brüel & Kjær 4153), and the waveforms were observed with an oscilloscope (Agilent Technologies DSO 6012A) and an acoustic measurement system (Brüel & Kjær Pulse). The ex-periment was carried out in a soundproof booth.
2.1.3. Procedure
The procedure was the same as in Experiments 2–4 of Ha-suo et al. (2012). For each presentation, the standard interval began 2.0–2.5 s after the participant clicked a “Play” button on the computer screen, and the comparison interval began 3.0–3.5 s after the last sound marker of the standard interval ended (Figure 3). The durations of these silences were ran-domized in a range of 0.5 s for each presentation in order to prevent the participants from anticipating the beginning of each interval too accurately. The task for the participants was to adjust the comparison interval until it was perceived as equal to the standard interval. Details about the adjustment device are described in Hasuo et al. (2012). The participants could listen to the stimulus pattern and adjust the comparison interval as many times as they wanted, and the final duration of the comparison interval in each trial was recorded as the point of subjective equality (PSE). For each standard interval, there was an ascending series and a descending series, and the PSE for each participant was calculated by averaging the ad-justed values obtained from both (Kuroda & Hasuo, 2014).
The total number of trials was 150 (75 stimulus conditions ×2 series (ascending/descending)). These trials were ran-domized and divided into 10 blocks, which consisted of 17 tri-als (2 warm-up tritri-als+15 experimental tritri-als). The first two trials in a block, which were the warm-up trials, had the same stimulus conditions as the last two trials in that block, but the participants were not informed of this nor of the fact that the first two trials were going to be treated as warm-up trials. In addition to the 10 blocks, a practice block of 10 trials was con-ducted. The practice trials were basically the same as the ex-perimental trials, but the stimulus conditions were limited; they were chosen so that all marker duration combinations (con-trol condition+all 9 possible combinations of the 40, 100, and 180-ms markers) appeared in random order. The results of the practice block and the warm-up trials were not used for analysis.
Before all these blocks, a preliminary experiment was con-ducted to determine the presentation levels of the markers, be-cause the different spectra and durations of the stimulus sounds could cause their perceived loudness to differ (e.g., Fastl & Zwicker, 2007; Scharf, 1978; Small, Brandt, & Cox, 1962). The participants listened to the 10 types of sounds (control sound (20 ms), P-40 ms, P-100 ms, P-180 ms, S7
-40 ms, S7-100 ms, S7-180 ms, S1-40 ms, S1-100 ms, and S1
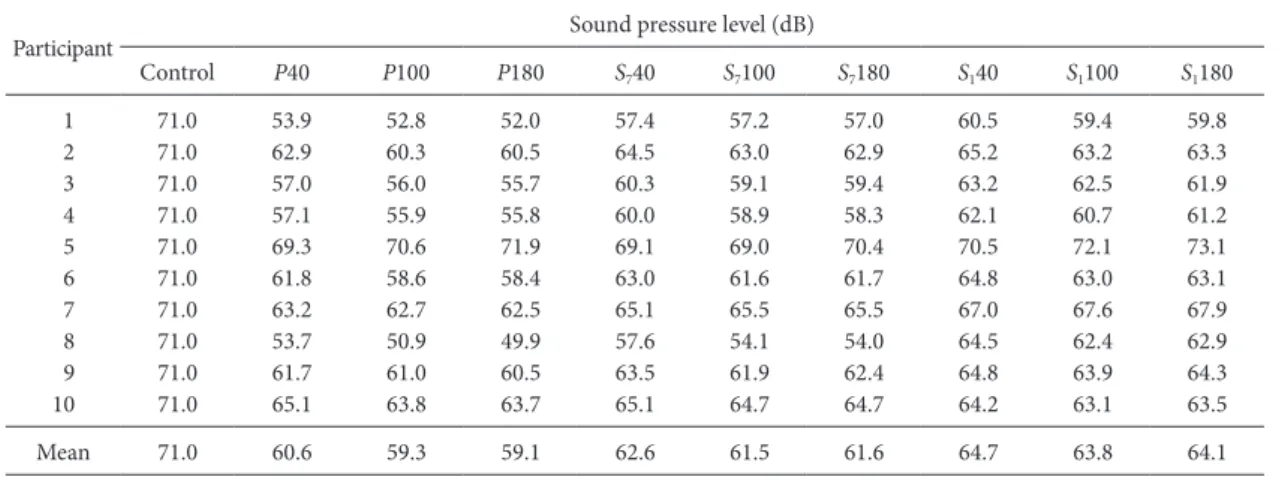
-180 ms) in isolation, and adjusted the intensities of these sounds using an “increase” and a “decrease” button for each sound on the computer screen until all 10 sounds had equal loudness. When the level (in decibels) of one sound was in-creased, the levels of the other nine sounds decreased by 1/9 of that increase (and when the level of one sound was decreased, the levels of the other sounds increased by 1/9 of that de-crease). This kept the mean of the peak sound pressure levels (dB) of the 10 sounds constant, but the participants were not informed of this. There were 2 trials in one block, and each participant performed 5 blocks. In each block, there was an as-cending series and a desas-cending series for each sound, and the order of these series was randomized for each block. We con-sidered the first block as practice, and averaged the adjusted levels in the second to the fifth block to determine the relative presentation levels of each sound for each participant. For all participants, the 20-ms sound (for the control condition and the comparison interval) was presented at 71 dBA, measured as the level of a continuous sound with the same amplitude. Table 2 shows the presentation levels of the other sounds. Note
that “71” in this table would mean that the peak amplitude of the sound was the same as that of the 20-ms sound.
The main experiment took about 20 minutes per block (17 trials). Each participant completed the whole experiment over a period of 3 to 4 days, including one day for the preliminary experiment (loudness adjustment).
2.2. Results and Discussion
Figures 4 and 5 show the mean PSEs plotted as a function of the first marker duration and the second marker duration for each standard interval. The same data are plotted in two ways: with the second marker duration fixed to observe the effects of the first marker duration (Figure 4) and with the first marker duration fixed to observe the effects of the second marker du-ration (Figure 5).
A three-way (sound type×first marker duration×second marker duration) ANOVA was conducted for each standard interval. For the 120-ms standard interval, significant main ef-fects of the sound type and the second marker duration ap-peared, F(2, 18)=5.80, p<.05, ηp2=.39 and F(2, 18)=4.19,
p<.05, ηp2=.32, respectively.3 The PSEs were smaller for S
7
than for S1 and for P, and lengthening the second marker
in-creased the PSE (Figure 5). As for the main effect of the sound type, Ryan’s post-hoc test showed that the difference between S7 and S1 was significant (p<.05), as well as the difference
be-tween S7 and P (p<.05). As for the main effect of the second
marker duration, Ryan’s post-hoc test showed that the differ-ence between 40 ms and 180 ms was significant (p<.05). The Table 2.
Presentation level of each sound for each participant in Experiment 1 determined by the preliminary experiment (loudness adjustment).
Participant Sound pressure level (dB)
Control P40 P100 P180 S740 S7100 S7180 S140 S1100 S1180 1 71.0 53.9 52.8 52.0 57.4 57.2 57.0 60.5 59.4 59.8 2 71.0 62.9 60.3 60.5 64.5 63.0 62.9 65.2 63.2 63.3 3 71.0 57.0 56.0 55.7 60.3 59.1 59.4 63.2 62.5 61.9 4 71.0 57.1 55.9 55.8 60.0 58.9 58.3 62.1 60.7 61.2 5 71.0 69.3 70.6 71.9 69.1 69.0 70.4 70.5 72.1 73.1 6 71.0 61.8 58.6 58.4 63.0 61.6 61.7 64.8 63.0 63.1 7 71.0 63.2 62.7 62.5 65.1 65.5 65.5 67.0 67.6 67.9 8 71.0 53.7 50.9 49.9 57.6 54.1 54.0 64.5 62.4 62.9 9 71.0 61.7 61.0 60.5 63.5 61.9 62.4 64.8 63.9 64.3 10 71.0 65.1 63.8 63.7 65.1 64.7 64.7 64.2 63.1 63.5 Mean 71.0 60.6 59.3 59.1 62.6 61.5 61.6 64.7 63.8 64.1
Figure 4. Effects of the first marker duration in Experiment 1: Mean PSEs of the 10 participants are plotted as a function of the first marker duration and the second marker duration for the real piano sound (P) (a, d, g), the synthesized sound with 7 frequency components (S7) (b, e, h), and the synthesized sound with 1 frequency component (S1) (c, f, i). The thick lines
show the averages across all second marker durations. The numbers inside the rectangles indicate the lengths of the stan-dard interval. Error bars show the stanstan-dard errors.
Figure 5. Effects of the second marker duration in Experiment 1: Mean PSEs of the 10 participants are plotted as a function of the first marker duration and the second marker duration for the real piano sound (P) (a, d, g), the synthesized sound with 7 fre-quency components (S7) (b, e, h), and the synthesized sound with 1 frequency component (S1) (c, f, i). Note that Figure 5 shows
the same data as in Figure 4 plotted with different horizontal axes. The thick lines show the averages across all first marker dura-tions. The numbers inside the rectangles indicate the lengths of the standard interval. Error bars show the standard errors.
interaction between the first marker duration and the second marker duration was also significant,4 F(2, 18)=4.67, p<.05,
ηp2=.34. A following simple main effect test revealed that the
effect of the first marker duration was significant when the second marker was 180 ms (p<.05), and that the effect of the second marker duration was significant when the first marker was 100 ms (p<.005); for this interaction, the effect of marker duration appeared as an increase in the PSE as the marker lengthened. For the 240-ms standard interval, the three-way ANOVA showed that the interaction between the sound type and the first marker duration was significant, F(4, 36)=2.79,
p<.05, ηp2=.24, but this interaction was not significant in the
Greenhouse–Geisser and the Huynh–Feldt results, p=.095 and p=.080, respectively, which were consulted because sphe-ricity could not be assumed for this interaction; the violation of sphericity suggests that the variances of the differences be-tween all combinations of groups were not equal. For the 360-ms standard interval, none of the main effects and the interac-tions was significant (p>.05).
The results showed that the PSEs increased as the second
marker lengthened only in limited cases; when the standard interval was 120 ms, and when the first marker was 100 ms. The effect of the second marker duration seemed weaker than that reported in Hasuo et al. (2012), where lengthening the second marker always significantly increased the subjective length of the time interval. Nevertheless, the direction of the effect of the second marker duration was the same as that in our previous studies (Hasuo et al., 2011, 2012), and the pres-ent experimpres-ent suggested that this tendency could appear even when sounds of complex spectral and temporal struc-tures, such as piano sounds, were used.
The next experiment was conducted to test the robustness of the second marker’s effect for sounds with multiple fre-quency components.
3. Experiment 2
In Experiment 1, lengthening the second marker increased the perceived length of the time interval, but only in limited cases. One of the reasons for the unstable effect of the second marker duration in Experiment 1, compared to Hasuo et al. (2012), could have been the dissimilarity in the sound types between the standard markers and the comparison markers: the comparison markers were always pure tone bursts while the standard markers were piano tones (P), synthesized piano tones (S7), or pure tones (S1). When the standard markers were
piano tones or complex tones, the dissimilarity between the standard markers and the comparison markers could have made the temporal judgment more difficult, causing a less sta-ble marker duration effect. Although this seemed unlikely, giv-en that the effect of marker duration was not clear evgiv-en whgiv-en pure tones were used (Figure 5), we nevertheless changed the comparison markers to complex tone bursts (as in S7) in
Ex-periment 2, and examined the effect of marker durations using S7 sounds as standard markers. It was also generally preferable
to keep the comparison stimuli as similar as possible to the standard stimuli, if there was no particular reason.
In Hasuo et al. (2012), lengthening the second marker in the range of 20–100 ms increased the subjective length of the time interval, but this effect was not clear for durations beyond 100 ms. This could be related to the “additional processing” time for the perception of empty intervals being about 80 ms (Nakajima, 1987); lengthening the second marker far beyond this range may not interfere with the processing as much, leading to less effect of the second marker duration. In the present Exper-iment 1, however, there was no clear boundary for the occurrence
3 To examine the effects of marker durations without
repeating the three-way ANOVA for each standard interval, we also conducted a four-way (standard interval ×sound type×first marker duration×second marker duration) ANOVA using only the marker-duration conditions that were used for all standard intervals (i.e., 40 and 100 ms for the first marker duration, and 40, 100, and 180 ms for the second marker duration). The results showed a significant main effect of the second marker duration, F(2, 18)=4.25, p<.05, ηp2=.32 (The main effect
of the standard interval was also significant, F(2, 18)= 1705.05, p<.001, ηp2=.995, but this was trivial since it is
natural that the PSEs change when the standard interval is changed), and Ryan’s post-hoc test for the effect of the second marker duration showed that the difference between 40 and 180 ms was significant (p<.05).
4 To examine this interaction more closely, a two-way (first
marker duration×second marker duration) ANOVA was conducted for each sound type separately. For P, the main effects were not significant, but the interaction was significant, F(2, 18)=5.11, p<.05, ηp2=.36. The simple
main effect test revealed that the effect of the first marker duration was significant when the second marker was 180 ms (p<.05), and that the effect of the second marker duration was significant when the first marker was 100 ms (p<.005). Ryan’s post-hoc test revealed that when the first marker was 100 ms, the differences between 40 and 180 ms (p=.001) and between 100 and 180 ms (p=.012) were significant. For S7 and S1, neither the main effects nor
of the second marker duration effect (Figure 5), possibly because there were only 3 steps of durations. It seemed important to ex-amine whether there was such a boundary for complex sounds. In Experiment 2, we focused on synthesized piano sounds, S7,
and varied the two markers’ durations in smaller steps.
3.1. Method
3.1.1. Participants
Eleven students (5 females and 6 males, aged 22–46) with normal hearing participated. Six had received basic training in music at the School of Design, Kyushu University, two had re-ceived professional training in music, and the remaining three had received music education only in the compulsory educa-tion in Japan. Out of these eleven participants, 10 had partici-pated in Experiment 1.
3.1.2. Stimuli and Apparatus
The standard interval was marked by S7 as used in Experi-ment 1. Marker duration was 40, 70, 100, 130, or 180 ms (Fig-ure 6). For the markers of the comparison interval, 20-ms sounds (divided into a rise and a fall time of 10 ms) based on the same frequency spectrum as that of S7 were used.
The standard interval was 120 or 360 ms. All possible com-binations of the five durations (40, 70, 100, 130, or 180 ms) were used as the first and the second marker of the standard interval, except when the standard interval was 120 ms, in which case the 130- and 180-ms sounds were not used as the
beginning marker; this was to avoid temporal overlap between the first and the second marker. The 20-ms sound for the comparison interval was also used to mark the standard inter-val in the control condition.
Thus, for the standard interval of 120 ms, there were 15 stimulus conditions (3 (first marker durations)×5 (second marker durations)). For the standard interval of 360 ms, there were 25 stimulus conditions each (5 (first marker durations)× 5 (second marker durations)). With the 2 stimulus conditions for the control condition (1 (first marker duration)×1 (sec-ond marker duration)×2 (standard intervals)), there were 42 stimulus conditions in total (15 (for standard interval of 120 ms)+25 (for standard interval of 360 ms)+2 (for the control condition)).
This time, instead of having the participants adjust the pre-sentation levels of the markers to obtain approximately equal loudness in isolation, we made the total sound energy of each marker constant (e.g., Buus et al., 1997; Fastl & Zwicker, 2007; Scharf, 1978). This method was the same as in Experiments 2 and 4 of Hasuo et al. (2012), and it was possible to apply it to the present experiment because only one sound type was used. In addition to reducing the time needed for the experiment, it allowed us to present physically identical markers to all partic-ipants.
The apparatus was the same as in Experiment 1, except for the sound level meter (Node 2071).
Figure 6. Waveforms and spectrograms of the sounds used in Experiment 2: The duration of the sounds was 40 (a), 70 (b), 100 (c), 130 (d), or 180 (e) ms. Note that the time range of the x axis is different for each duration. All sounds were synthe-sized from seven frequency components (S7). In each section, the upper panel shows the waveform, and the lower the
3.1.3. Procedure
The adjustment procedure was the same as in Experiment 1 ex-cept for the total number of trials and the division of these trials.
The total number of trials was 84 (42 stimulus conditions× 2 series (ascending/descending)). These trials were random-ized and divided into 6 blocks, which each consisted of 16 tri-als (2 warm-up tritri-als+14 experimental tritri-als). In addition, a practice block of 16 trials was conducted. The stimulus condi-tions in the practice block were chosen so that all marker du-rations appeared as both the first and the second marker,5 and
were presented in random order. Each experimental block (16 trials) took about 20 minutes, and each participant completed the whole experiment over a period of 2 days.
3.2. Results and Discussion
The mean PSEs are plotted as a function of the first marker duration and the second marker duration for each standard interval (Figure 7). As in Experiment 1, the same data are plot-ted in two ways: with the second marker duration fixed to ob-serve the effects of the first marker duration (a, c) and with the first marker duration fixed to observe the effects of the second marker duration (b, d).
A two-way (first marker duration×second marker dura-tion) ANOVA was conducted for each standard interval. For both standard intervals (120 and 360 ms), none of the main effects and the interaction was significant (p>.05).
The effect of the second marker duration did not appear significantly in this experiment. It seemed that the weaker ef-fect of the second marker observed in Experiment 1 compared to the results of Hasuo et al. (2012) was not due to the dissimi-larity in the sound type between the standard markers and the comparison markers. In view of the results of Experiment 1, however, it still seemed difficult to completely deny the effects of the second marker duration when sounds with multiple fre-Figure 7. Results of Experiment 2 for the synthesized sound with 7 frequency components (S7): Mean PSEs of the 11
partici-pants are plotted as a function of the first marker duration and the second marker duration to show the effects of the first marker duration (a, c) and the second marker duration (b, d). Note that panels (a) and (c) and panels (b) and (d) show the same data plotted with different horizontal axes. The thick lines show the averages across all second marker durations in (a) and (c) and across all first marker durations in (b) and (d). The numbers inside the rectangles indicate the lengths of the standard interval. Error bars show the standard errors.
5 For markers of 40, 70, 100, 130, and 180 ms, all conditions
in which the first and the second marker had the same duration were included in the practice block. In addition, conditions in which the first and the second marker had different durations were included at least once for each first marker duration. The same was done for each second marker duration. Also, the control condition was always included in the practice.
quency components were used. Because our main purpose was to see whether the effects of sound marker durations found with physically simple sounds (Hasuo et al., 2012) could be applied to more complex and natural sounds we hear in our everyday life, it now seemed necessary to check the effects again with real piano sounds in the same experimental situa-tion as in Experiment 2, i.e. using markers having 7 frequency components, as in S7, as the comparison markers.
4. Experiment 3
The standard interval was marked by real piano sounds (i.e., the P sounds as used in Experiment 1), and the comparison interval was marked by brief synthesized sounds with 7 fre-quency components as the ones used in Experiment 2.
Figure 8. Waveforms and spectrograms of the sounds used in Experiment 3: The duration of the sounds was 40 (a), 100 (b), or 180 (c) ms. Note that the time range of the x axis is different for each duration. All sounds were real piano sounds (P). In each section, the upper panel shows the waveform, and the lower the spectrogram.
Figure 9. Results of Experiment 3 for the real piano sound (P): Mean PSEs of the 11 participants are plotted as a function of the first marker duration and the second marker duration to show the effects of the first marker duration (a, c) and the sec-ond marker duration (b, d). Note that panels (a) and (c) and panels (b) and (d) show the same data plotted with different horizontal axes. The thick lines show the averages across all second marker durations in (a) and (c) and across all first mark-er durations in (b) and (d). The numbmark-ers inside the rectangles indicate the lengths of the standard intmark-erval. Error bars show the standard errors.
4.1. Method
4.1.1. Participants
The eleven students who had participated in Experiment 2 participated.
4.1.2. Stimuli and Apparatus
The sound markers for the standard intervals were the P sounds as in Experiment 1 (Figure 8). Their duration was 40 or 100 ms for the first marker, and 40 or 180 ms for the second marker. For the markers of the comparison interval, 20-ms sounds (divided into a rise and a fall time of 10 ms) based on the same frequency spectrum as that of S7 were used, as in
Ex-periment 2.
The standard interval was 120 or 360 ms. All possible com-binations of the first marker duration (40 or 100 ms) and the second marker duration (40 or 180 ms) were used to mark the standard interval. The 20-ms sound for the comparison inter-val was also used to mark the standard interinter-val in the control condition.
Thus, there were 4 stimulus conditions (2 (first marker du-rations)×2 (second marker durations)) for each standard in-terval (120 and 360 ms). With the 2 stimulus conditions for the control condition (1 (first marker duration)×1 (second marker duration)×2 (standard intervals)), there were 10 stim-ulus conditions in total (4 (for standard interval of 120 ms)+4 (for standard interval of 360 ms)+2 (control condition)).
To make the markers have approximately equal loudness in isolation, we made the total energy of each P-sound marker constant, as in Experiment 2. To match the loudness of these P sounds with that of the synthesized sounds used for the com-parison interval and the control condition, we diminished the levels of the P sounds by 2 dBs, which was the difference in the presentation levels between the P sound and the S7 sound
av-eraged across all participants in Experiment 1 (Table 2). The same apparatus as in Experiment 2 was used.
4.1.3. Procedure
The adjustment procedure was the same as in Experiments 1 and 2 except for the total number of trials and the division of these trials.
The total number of trials was 20 (10 stimulus conditions× 2 series (ascending/descending)). These trials were random-ized and presented in one block. In addition, a practice block of 5 trials was conducted. The stimulus conditions in the prac-tice block were chosen so that all marker duration tions (control condition+all 4 marker-duration combina-tions) appeared in random order. The experimental block (20
trials) took about 20 minutes, and each participant completed the experiment in 1 day.
4.2. Results and Discussion
The mean PSEs are plotted as a function of the first marker duration and the second marker duration for each standard interval (Figure 9). As in Experiments 1 and 2, the same data are plotted in two ways: with the second marker duration fixed to observe the effects of the first marker duration (a, c) and with the first marker duration fixed to observe the effects of the second marker duration (b, d).
A two-way (first marker duration×second marker dura-tion) ANOVA was conducted for each standard interval. For the 120-ms standard interval, none of the main effects and the interaction was significant (p>.05). For the 360-ms interval, a significant main effect of the second marker duration ap-peared, F(1, 10)=8.05, p<.05, ηp2=.45. Lengthening the
sec-ond marker increased the PSE (Figure 9b).
This time, lengthening the second marker influenced the perceived duration of the time interval, when the interval was 360 ms. The PSEs increased when the second marker was lengthened, which was similar to the results of Experiment 1 and of Hasuo et al. (2011, 2012). The effect of the second marker duration was not significant for the 360-ms interval in Experiment 1, but when focusing only on the marker duration conditions used in Experiment 3, it seemed that a similar ten-dency had appeared also in Experiment 1, except when the first marker was 40 ms (for the first marker of 40 ms, compare the open circles in Figure 5a and Figure 9b; for the first mark-er of 100 ms, the open squares in the same figures).
The marker durations were changed in only two steps in Experiment 3, while they were changed in five steps in Experi-ment 2. To compare the results more fairly, we analyzed the re-sults of Experiments 2 and 3 using only the conditions that were used in both experiments (i.e., 40 and 100 ms for the first marker, and 40 and 180 ms for the second marker). A three-way (Experiment×first marker duration×second marker du-ration) ANOVA was performed for each standard interval.6
For the standard interval of 360 ms, the interaction between Experiment and second marker duration was significant,
F(1, 10)=8.98, p<.05, ηp2=.47. The simple main effect test
re-vealed that the effect of the Experiment was significant when the second marker was 40 ms (p<.05), and that the effect of the second marker duration was significant only for Experi-ment 3 (p<.005). This interaction agreed with the absence of
a significant second marker duration effect in Experiment 2.7
For the 120-ms standard interval, none of the main effects and the interaction was significant (p>.05).
The results of Experiment 3 showed that, when real piano sounds are used to mark the standard time interval of 360 ms, the duration of the second sound influences the perceived du-ration of the standard interval (when the comparison markers have 7 frequency components). The absence of the marker du-ration effect in Experiment 2 in contrast with its appearance in Experiment 3 thus seemed to be related to some difference be-tween a real piano sound and a synthesized sound.
5. General Discussion
The present experiments showed that, when real piano sounds are used as interval markers, lengthening the second sound can increase the perceived duration of the time interval, but in limited cases; the effect did not appear significantly for some standard intervals, and seemed unstable compared to the results of Hasuo et al. (2012). When the effect appeared, however, its direction was the same in Experiments 1 and 3: lengthening the second marker increased, and did not de-crease, the perceived duration of the time interval. This was in line with our previous studies (Hasuo et al., 2011, 2012).
Hasuo et al. (2012) explained the effect of the second mark-er duration by assuming that, when the second markmark-er is lengthened, the continuation of the second marker (after the termination of the time interval marked by its onset) interferes with the perceptual process necessary for duration perception, thus increasing the time needed for the temporal processing. This idea was based on the “processing-time hypothesis” (Na-kajima, 1987). This hypothesis assumes that the time needed for the temporal processing is included in the perceived tion of the time interval. The effect of the second marker dura-tion in our present experiments was consistent with this expla-nation.
Another possible explanation for the second marker effect is that lengthening a marker can delay the perceptual detec-tion (or posidetec-tioning) of the marker onset, or P-centers (e.g., Howell, 1988; Marcus, 1981; Scott, 1998; Terhardt & Schütte, 1976; Vos, Mates, & van Kruysbergen, 1995). It is important to note that this delay in the P-center can also be applied to the perception of the first marker. If the marker duration effect in the present study was caused by the delayed positioning of the P-centers, lengthening the second sound indeed should have lengthened the judged length of the standard, but lengthening the first sound should have shortened the judged length of the standard interval. This was not supported by our results: lengthening the first marker did not shorten the subjective length of the standard interval in any of the present experi-ments, and in Experiment 1, even an opposite tendency was observed for the 120-ms standard interval when the second marker was 180 ms.
The effect of the second marker duration in the present ex-periments seemed to be weaker than in Hasuo et al. (2012): the effect did not appear in some cases in the present experi-ments, while it always appeared in a stable manner for all
stan-6 As in Experiment 1, to examine the effects of marker
durations in Experiments 2 and 3 without repeating the three-way ANOVA for each standard interval, we also conducted a single four-way (Experiment×standard interval×first marker duration×second marker duration) ANOVA for the results of Experiments 2 and 3. Also in this case, the interaction between Experiment and second marker duration was significant, F(1, 10)=6.82, p<.05, ηp2=.41, and the following simple main effect test revealed
that the effect of the Experiment was significant when the second marker was 40 ms (p<.05), and that the effect of the second marker duration was significant only for Experiment 3 (p<.05). The interaction between Experiment, standard interval, and the second marker duration was also significant, F(1, 10)=6.41, p<.05, ηp2=.39, and the following simple-simple main effect test
showed that the effect of Experiment was significant only when the standard interval was 360 ms and the second marker was 40 ms (p<.005), that the effect of the standard interval was significant for all combinations of the Experiment and the second marker duration (p<.001), and that the effect of the second marker duration was significant only for Experiment 3 when the standard interval was 360 ms. In this ANOVA, the main effect of the standard interval was also significant, F(1, 10)= 1404.65, p<.001, ηp2=.993, but this was trivial since it is
natural that the PSEs change when the standard interval is changed. The results of the present four-way ANOVA seemed to match the results observed in the three-way (Experiment×first marker duration×second marker duration) ANOVAs reported in the main text.
7 We also conducted a two-way ANOVA for the results of
Experiment 2 using only the conditions with the same marker durations as those in Experiment 3 (i.e., 40 and 100 ms for the first marker, and 40 and 180 ms for the second marker). For both standard intervals (120 and 360 ms), none of the main effects and the interaction was significant (p>.05). The absence of significant marker duration effect in Experiment 2 seemed to be confirmed.
dard intervals in Hasuo et al. (2012). The weakening of the ef-fect could have been caused by the temporal envelope of the present sounds. Our synthesized sound with one frequency component (S1) had a frequency of 1044 Hz, which was close
to 1000 Hz used in Hasuo et al. (2012), but the S1 sounds reached maximum amplitude at about 21 ms from the sound onset, and then decayed gradually (Figure 1). This means that lengthening the sounds from 40 to 180 ms in the present study changed only the parts where the sound intensity was decay-ing, which could have made the lengthening of the second marker less effective than in Hasuo et al. (2012), in which steady-state sounds were used. It is possible that, compared to steady-state sounds, the decaying markers interfered less with the perceptual processing of the time interval, as appeared in Nakajima’s (1987) hypothesis, due to the decreased peripheral excitation, resulting in less increase in the time needed for this processing.
In Experiment 2, where only the synthesized sounds with 7 frequency components (S7) were used, the effect of the second
marker duration did not appear, while it appeared in Experi-ment 3 with real piano sounds (P) under the same experimen-tal paradigm. This suggests that the effect of lengthening the second marker is more likely to appear with real piano sounds than with synthesized sounds.
There were mainly two differences between the real piano sounds and the synthesized sounds. One is that the real piano sounds included noise-like parts especially at the beginning, in addition to the discrete spectral peaks corresponding to the fundamental and the overtones (compare Figures 1g and 1h). The synthesized sound with 7 frequency components (S7)
in-cluded only the discrete peaks in the frequency spectrum of the real piano sound, and it seemed possible that the spectral aspects that were not captured in the S7 sound influenced the
perceived duration of the time intervals. For example, the in-tensities of these discrete components should have been lower at the very beginning of the real piano sounds (P), and this may have increased the perceptual influence of the later parts. The other difference is that the temporal fluctuation patterns of all sinusoidal components in the S7 sounds were the same,
whereas their counterparts in the real piano sounds (P) had different temporal fluctuation patterns (Figure 1). This was due to the way we applied the temporal envelope to make the S7 sounds: the temporal envelope extracted from the whole
waveform of the real piano sound was applied to all sinusoidal components of S7, instead of extracting the temporal envelope
from each spectral component of the real piano sound. It is possible that the complex temporal fluctuations across fre-quency components in the real piano sound (P) captured more attention compared to the synthesized complex sound (S7), resulting in greater effect of second marker duration with
real piano sounds (P). These possibilities warrant further in-vestigation to clarify the perceptual effects of piano sounds.
The present study showed that, although the effect was not very stable, the second marker duration can influence the per-ceived length of the time intervals also when piano sounds are used as markers. This suggests that the effect, which was origi-nally found with physically simple artificial sounds (Hasuo et al., 2012), can be applied to more natural situations as in mu-sic perception. Indeed, there was a study which reported ef-fects of sound durations on perceived rhythm using a part of a real musical piece (Schubert & Fabian, 2001). Their results could be explained in line with our results, i.e. by assuming that shortening the sound which marked the end of a time in-terval, as the second marker in the present experiments, caused the perceived duration of that time interval to decrease (see also Hasuo et al., 2011). Although the sound pattern used in the present study was very elementary (i.e. a single time in-terval marked by two successive sounds), our findings could be an informative first step to relate the perceptual phenome-non found with simple artificial sounds with the perception of rhythm in real music, which involves more complexly struc-tured sounds (e.g., Handel, 1989).
Acknowledgments
We are grateful to Shozo Tobimatsu for his valuable advice and encouragement. We would also like to express our appre-ciation to Gerard B. Remijn and the three anonymous review-ers for their careful comments on the previous vreview-ersion of this manuscript. This work was supported by the Japan Society for the Promotion of Science (Grants-in-Aid for Scientific Re-search S (19103003) and A (25242002) to YN, and a Grant-in-Aid for JSPS Fellows (25-6091) to EH).
References
Buus, S., Florentine, M., & Poulsen, T. (1997). Temporal inte-gration of loudness, loudness discrimination, and the form of the loudness function. Journal of the Acoustical Society of
America, 101, 669–680.
Fastl, H., & Zwicker, E. (2007). Psychoacoustics: Facts and
models. Berlin: Springer.
The psychology of music. New York: Academic Press, pp.
149–180.
Greenberg, S., & Arai, T. (2004). What are the essential cues for understanding spoken language? IEICE Transactions on
Information and Systems, E87-D, 1059–1070.
Grondin, S., Ivry, R. B., Franz, E., Perreault, L., & Metthe, L. (1996). Markers’ influence on the duration discrimination of intermodal intervals. Perception & Psychophysics, 58, 424–433.
Handel, S. (1989). Listening: An introduction to the perception
of auditory events. Cambridge, MA: MIT Press.
Handel, S. (1993). The effect of tempo and tone duration on rhythm discrimination. Perception & Psychophysics, 54, 370–382.
Hasuo, E., Nakajima, Y., & Hirose, Y. (2011). Effects of sound marker durations on rhythm perception. Perception, 40, 220–242.
Hasuo, E., Nakajima, Y., Osawa, S., & Fujishima, H. (2012). Ef-fects of temporal shapes of sound markers on the percep-tion of interonset time intervals. Attenpercep-tion, Perceppercep-tion, &
Psychophysics, 74, 430–445.
Howell, P. (1988). Prediction of P-center location from the dis-tribution of energy in the amplitude envelope: I. Perception
& Psychophysics, 43, 90–93.
Kato, H., Tsuzaki, M., & Sagisaka, Y. (2003). Functional differ-ences between vowel onsets and offsets in temporal percep-tion of speech: Local-change detecpercep-tion and speaking-rate discrimination. Journal of the Acoustical Society of America,
113, 3379–3389.
Kuroda, T., & Hasuo, E. (2014). The very first step to start psy-chophysical experiments. Acoustical Science & Technology,
35, 1–9.
Kuroda, T., Hasuo, E., Labonté, K., Laflamme, V., & Grondin, S. (2014). Discrimination of two neighboring intra- and in-termodal empty time intervals marked by three successive stimuli. Acta Psychologica, 149, 134–141.
Lake, J. I., LaBar, K. S., & Meck, W. H. (2014). Hear it playing low and slow: How pitch level differentially influences time perception. Acta Psychologica, 149, 169–177.
Marcus, S. M. (1981). Acoustic determinants of perceptual center (P-center) location. Perception & Psychophysics, 30, 247–256.
Morton, J., Marcus, S. M., & Frankish, C. (1976). Perceptual
centers (p-centers). Psychological Review, 83, 405–408. Nakajima, Y. (1987). A model of empty duration perception.
Perception, 16, 485–520.
Palmer, C., & Brown, J. C. (1991). Investigations in the ampli-tude of sounded piano tones. Journal of the Acoustical
Soci-ety of America, 90, 60–66.
Patel, A. D. (2008). Music, language, and the brain. New York: Oxford University Press.
Pfeuty, M., & Peretz, I. (2010). Abnormal pitch–time interfer-ence in congenital amusia: Evidinterfer-ence from an implicit test.
Attention, Perception, & Psychophysics, 72, 763–774.
Repp, B. H., & Marcus, R. J. (2010). No sustained sound illu-sion in rhythmic sequences. Music Perception, 28, 121–133. Scharf, B. (1978). Loudness. In E. C. Carterette, & M. P.
Fried-man (Eds.), Handbook of perception (Hearing, Vol. IV). New York: Academic Press, pp. 204–209.
Schubert, E., & Fabian, D. (2001). Perception and preference of dotted 6/8 patterns by experienced and less experienced baroque music listeners. Journal of Music Perception and
Cognition, 7, 113–132.
Schuck, O. H., & Young, R. W. (1943). Observations on the vi-brations of piano strings. Journal of the Acoustical Society of
America, 15, 1–11.
Scott, S. K. (1998). The point of P-centres. Psychological
Re-search, 61, 4–11.
Small, Jr., A. M., Brandt, J. F., & Cox, P. G. (1962). Loudness as a function of signal duration. Journal of the Acoustical
Soci-ety of America, 34, 513–514.
Seashore, C. E. (1938). Psychology of music. New York: Mc-Graw-Hill.
Terhardt, E., & Schütte, H. (1976). Akustische Rhythmus- Wahrnehmung: Subjektive Gleichmässigkeit. Acustica, 35, 122–126.
Vos, P. G., Mates, J., & van Kruysbergen, N. W. (1995). The perceptual centre of a stimulus as the cue for synchroniza-tion to a metronome: Evidence from asynchronies.
Quarter-ly Journal of Experimental Psychology, 48A, 1024–1040.
Woodrow, H. (1928). Behavior with respect to short temporal stimulus forms. Journal of Experimental Psychology, 11, 167–193.