Effect of Hydrophilic Additives on Mesophase Regions of Aqueous Nonionic Surfactant Mixture
Tohru I
noue1), Tomomi T
akasago1), and Tadayoshi u
shIfusa1)(Received November 30, 2012)
Abstract
The effect of hydrophilic additives on the L
αand H
1phase regions in aqueous C
12E
7mixture was investigated. The hydrophilic additives examined are sucrose, trehalose, sorbitol, glycerol, and urea. Sugars and glycerol shrink both mesophase regions toward lower temperature. The maximum temperatures of H
1and L
αphase regions decrease monotonously with the increase in the additive concentration. On the other hand, urea expands H
1region toward higher temperature, while its effect on L
αphase is weak. A statistical thermodynamic model was proposed to describe the phase behavior of aqueous C
12E
7mixture in the presence of these additives. According to this model, the additive effect is governed by the balance of the three interaction energies, i.e.,
surfactant-water, surfactant-additive, and water-additive interactions. This is quite simplifiedmodel; nevertheless, it seems that the response of the mesophase-to-liquid phase transition to the
addition of hydrophilic non-ionic compounds can be well described at least as a first approximation.Keywords: nonionic surfactants, aqueous phase behavior, additive effect, mesophase-to-liquid
transition, statistical thermodynamic model, differential scanning calorimetry (DSC).
1. Introduction
It is well known that the aqueous mixture of amphiphilic compounds such as surfactants form a variety of mesophases depending on the composition and temperature [1, 2]. For instance, the temperature-composition (T-X) phase diagram for aqueous mixture of heptaethylene glycol dodecyl ether (C12E7), a typical nonionic surfactant, is shown in Fig. 1 [3]. As is demonstrated in this phase diagram, there appear three mesophases, lamellar (Lα), hexagonal (H1), and bicontinuous cubic (V1) phases. These mesophases formed in mixtures of amphiphiles and water are essentially lyotropic liquid crystalline in nature, and they have attracted great interests in their applications as a template to prepare the controlled-porosity ceramic materials [4-11] and as a carrier of drug delivery system [12-18].
It would be preferable for such applications if these mesophase regions in the phase diagram can be freely controlled. For polyoxyethylene (POE)-type nonionic surfactants, the mesophase regions in the T-X phase diagram can be controlled by adjusting the lengths of the hydrophilic POE chain and the hydrophobic alkyl chain [1, 2, 19-21]. Alternatively, the mesophase regions can be modified by additives. We have reported on the effect of inorganic salts on the mesophase regions of C12E7/H2O mixture [22]. The way of manifestation of the additive
1) Department of Chemistry, Faculty of Science, Fukuoka University, 8-19-1 Nanakuma, Jonan-ku, Fukuoka, 814-0180, Japan
effect is expected to depend on the type of additives. In the present work, we planned to investigate the effect of hydrophilic small molecules on the mesophase regions in aqueous mixture of POE-type nonionic surfactant stressing their influence on Lα and H1 phases. The system composed of C12E7 is suitable for this purpose, since the maximum temperatures of the two phases are comparable and in convenient temperature ranges under additive- free condition as shown in Fig. 1, which makes it easy to compare the additive effect on the two phases with each other. In this paper, we report the experimental results on the behavior of the maximum temperatures of mesophases in aqueous C12E7 mixture as a function of the concentration of hydrophilic additives, and also, propose a simple thermodynamic model to describe the additive effect on the mesophase regions.
2. Experimental
2.1. Materials
Heptaethylene glycol dodecyl ether (C12E7) with a homogeneous chain length distribution was purchased from Nikko Chemicals (Tokyo, Japan) and used without further purification. The compounds used as hydrophilic additives are sucrose, trehalose, sorbitol, glycerol, and urea. The first three compounds are classified into sugar, and the forth one into polyol, and they exhibit high solubility in water due to the presence of several hydroxyl groups in the molecules. Urea is readily soluble in water because of its strong ability for hydrogen-bond formation.
Guaranteed grade reagents of these five compounds were obtained from Wako Pure Chemicals (Tokyo, Japan) and used as received. Water was purified by deionization followed by distillation twice, and the purified water was used to prepare the additive solutions.
2.2. Methods
Differential scanning calorimetry (DSC) was used to determine the phase boundary between mesophase and liquid phase in the T-X phase diagram of aqueous C12E7 mixture in the presence of additives at various concentrations. The DSC measurements were carried out using a Seiko Denshi Model Exstar 6000 (Tokyo, Japan). The samples for DSC experiments were prepared by weighing the surfactant and the additive solution directly into an aluminum sample pan to give a desired composition. The amount of the sample was mostly in the range from 10 to 20 mg. The pan containing the mixture was sealed, and was held at about 70°C for 30 min in the oven of the DSC apparatus in order to facilitate the homogeneous mixing of the surfactants and additive solution. Then, cooling/heating cycles were repeated at least twice in the temperature range of approximately 30 to 70°C at the rate of 0.5°C/min for heating and 2 - 3°C/min for cooling. A good reproducibility was found for the DSC thermograms obtained by the repeated scan. The top temperature of the endothermic peak due to the mesophase-to-liquid phase transition in the DSC curve obtained by a heating scan was taken as a phase boundary between the mesophase and liquid phase.
3. Results and Discussion
3.1 DSC curves obtained for the mixtures of C12E7 and sucrose solution
Typical DSC curves observed for the mixtures of C12E7 and sucrose solution are shown in Fig. 2, which demonstrates the influence of sucrose on the mesophase-to-liquid phase transition temperature, or in other words, the stability of the mesophases formed in aqueous C12E7 mixture. Figure 2(a) corresponds to the DSC curves
Fig. 1 Temperature-composition phase diagram of binary mixture of C12E7 and H2O [3].
obtained with the mixtures containing water or sucrose solution at the amount of approximately 27 % by weight, and at this composition, the endothermic peaks are ascribed to the phase transition from a lamellar (Lα) phase to a liquid phase (see Fig. 1). It can be seen that the Lα-to- liquid phase transition shifts toward lower temperature with the increase in the sucrose concentration, i.e., Lα phase is destabilized by the addition of sucrose. Figure 2(b) is the results obtained with the mixtures containing approximately 50 wt% water or sucrose solution, and at this composition, the peaks in the DSC curves are attributed to the phase transition from a hexagonal (H1) phase to a liquid phase (see Fig.
1). As can be seen in this figure, the H1-to-liquid phase transition temperature also decreases with the increase in the sucrose concentration, i.e., H1
phase is also destabilized by the addition of sucrose.
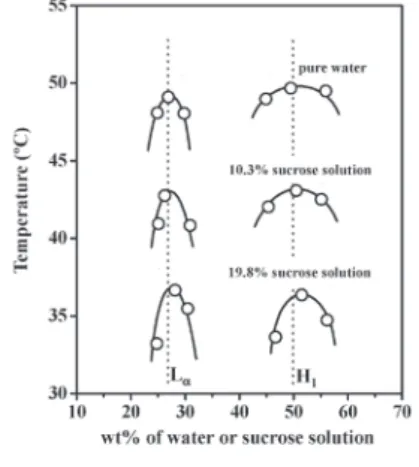
3.2 Phase boundaries around maximum temperatures of Lα phase and H1 phase
Figure 3 shows the phase boundaries around the maximum temperatures of Lα phase and H1 phase obtained for the mixtures of C12E7 and sucrose solution with different concentration. The temperatures corresponding to the phase boundaries were determined from the peak top temperatures in DSC curves. It can be seen that the addition of sucrose causes shrinkage of the mesophase regions toward lower temperature side for both Lα and H1
phases, but the compositions corresponding to the maximum temperatures of the mesophase regions are kept rather constant at about 27 wt% for Lα phase and at about 50 wt% for H1 phase. For other additives, the mesophase regions shrunk toward lower temperature or expanded toward higher temperature depending on the additive species. However, the composition providing the maximum temperature of each mesophase region was kept almost constant regardless of the additive concentration and additive species. Thus, we focused our attention on the dependence of the maximum temperatures of mesophases on the additive concentration in order to estimate the effectiveness of each additive to affect the stability of the mesophases formed in aqueous C12E7 mixture.
3.3 Variation of the maximum temperatures of Lα and H1 phases with additive concentration
The results obtained for the concentration dependence of the maximum temperatures of mesophase regions are summarized in Fig. 4 for all additive species, where the concentration is expressed in terms of wt% of additives in the solution. Figs. 4(a) and 4(b) refer to Lα phase and H1 phase, respectively, and the plots in these figures are peak top temperatures in DSC curves obtained with the mixtures containing each additive solution at the amount of approximately 27 wt% and 50 wt%, respectively.
It is seen in Fig. 4 that sugars, i.e., sucrose, trehalose, and sorbitol, decrease the maximum temperatures for Fig. 2 DSC curves obtained for the mixtures of C12E7 and sucrose solution. The amounts of sucrose solution added are around 27 wt% (a) and 50 wt%. (b). Top curves in both (a) and (b) are DSC curves for the mixtures of the surfactant and water. The concentration of sucrose solution mixed with C12E7 is indicated near each curve. The sample weight is normalized to 10.00 mg.
Fig. 3 Phase boundaries around maximum temperatures of Lα phase and H1 phase for the mixture of C12E7 and sucrose solution.
both Lα and H1 phases, and the concentration dependence of the effect is similar to each other. Glycerol also decreases the maximum temperature of the two phases, but the effect is somewhat weaker than the case of sugars.
Contrary to the cases of sugars and glycerol, urea increases the maximum temperature of H1 phase, while its effect on Lα phase is rather weak.
As demonstrated in Fig. 4, the hydrophilic additives except for urea cause the shrinkage of the mesophase regions toward lower temperature side in aqueous C12E7 mixture.
This means that the mesophses are destabilized by the presence of these additives.
On the other hand, urea expands the H1 region toward higher temperature side, while it
brings about no significant effect on Lα region. This means that H1 phase is stabilized, but Lα phase is unaffected by the presence of urea. Such an influence of additives on the stability of mesophases must be governed by the difference in the interaction energies among surfactant, water, and additive molecules between mesophase and liquid phase, which should determine the free energy difference between the two phases. Here, we try to interpret the experimentally observed additive effect in terms of a statistical thermodynamic model taking into account the interaction among the three species, surfactant, water, and additive molecules.
3.4 Statistical thermodynamic model of mesophase-to-liquid phase trnansition
Basic idea of the present treatment is as follows. At the maximum temperature of a mesophase, the mesophase and a liquid phase coexist in equilibrium, and the two phases have the same composition, because the maximum temperature corresponds to an azeotropic-like point. According to the condition of phase equilibrium, the free energies of the two phases must be equal to each other. The free energies of the two phases should be determined by the interaction among surfactant, water, and additive molecules in each phase, and hence, should depend on the composition of the mixture. Thus, an expression for the transition temperature as a function of composition may be obtained from this relation. Then, the problem is to find the expression of the free energies of the two phases. We adopted a lattice model to describe the system, and applied the statistical thermodynamic method to obtain the expression of the free energies following the procedure described by Suezaki et al. [23], and have obtained the following approximate equation which expresses the maximum temperature of mesophase region, Tt , as a function of additive concentration (for detail of the derivation of this equation, see Appendix).
[1]
where Δh0 and Δs0 are the enthalpy and entropy changes associated with the mesophase-to-liquid phase transition for additive-free system, wij represents the interaction energy parameter between the lattice occupied by i species and that by j species being defined by
[2]
in which uij is the pair interaction energies for i-j lattice pairs and N is the coordination number, i.e., the number of nearest neighbor lattice, and the subscripts 1, 2, and 3 in Eq. 1 refer to surfactant, water, and additive, respectively. A positive w means that the contact of different species is energetically unfavorable compared with Fig. 4 Variation of the maximum temperatures of Lα phase (a) and H1 phase (b) regions with additive concentration.
The correspondence of symbols to additive species is shown in the figure. The curves were calculated according to Eq. 1 using the wij values noted in the text.
those of the same species, and in this case, the mixing of the two species increases the free energy of the system.
On the other hand, a negative w corresponds to the case where the contact of different species is energetically favorable, and hence, their mixing decreases the free energy. Finally, fi(x)s in Eq. 1 are functions of the volume fraction of the additive in its aqueous solution, x, defined by
[3]
[4]
[5]
where φ1 is the volume fraction of surfactant in the mixture.
3.5 Comparison of a model calculation with experimental results
Equation 1 describes the behavior of maximum temperature of mesophase region with respect to the additive concentration. Many parameters are included in this equation, and some of their values are known, but others are unknown. Thus, we have to adopt appropriate assumptions and approximations. The values of the maximum temperature of a mesophase and the heat of mesophase-to-liquid transition in the absence of additive, T0 and Δh0, can be obtained from the DSC experiment for the additive-free system, and hence, Δs0, can be estimated according to the following relation.
The values determined for aqueous C12E7 system are
Δh0 = 143 J/mol of lattice (Lα phase) and 393 J/mol of lattice (H1 phase) Δs0 = 0.44 J/K·mol of lattice (Lα phase) and 1.22 J/K·mol of lattice (H1 phase) The volume fraction was approximated by the weight fraction, i.e.,
φ1 = 0.73 for Lα phase and φ1 = 0.50 for H1 phase
The values of w are unknown, but we can infer their signs. That is, the surfactant-water interaction, w12, must be positive since surfactants tend to separate to form molecular aggregates in aqueous medium, and the surfactant- additive interaction, w13, must be also positive for hydrophilic additives. On the other hand, the water-additive interaction, w23, must be zero or negative since the hydrophilic additives mix freely with water.
The solid lines in Fig. 4 were calculated from Eq. 1 using the following parameter values, w12 = 800 J/mol, w13
= 500 J/mol, and w23 = -400 J/mol; the curves reproduce rather well the behavior of maximum temperatures in the presence of sugars for both Lα and H1 phases. The effect of glycerol on the maximum temperatures of Lα and H1 regions is well reproduced by the dashed lines in Fig. 4, which was calculated by the use of parameter values, w12 = 800 J/mol, w13 = 300 J/mol, w23 = -600 J/mol. It should be noted that the behavior of calculated curve is determined by a combination of the three wij parameters, and different combinations provide rather similar curves. For example, a curve similar to solid line was obtained by using w12 = 600 or 1000 J/mol with appropriately adjusted values of w13 and w23, whereas, for w12 smaller than 600 or larger than 1000 J/mol, the reproducibility became poor. Thus, the reliability of these interaction energy parameter values may be estimated to be within 200 J/mol.
The effect of urea on the maximum temperatures of H1 phase and Lα phases can not be reproduced simultaneously by any combination of w parameters. The situation for urea must be different from sugars and glycerol. The urea effect may be explained by considering the modification of the critical packing parameter of the surfactant molecule caused by the binding of the additive molecule to the surfactant head group. It is likely that urea binds to the POE chain of the surfactant, because urea is a strong hydrogen-bond donor. The urea binding would result in the increase in the effective head group size. This is in favor of H1 phase formation, while is in disfavor of Lα phase formation. Or in other words, this lowers the free energy of H1 phase, while elevates the
free energy of Lα phase. Then, the value of Δh0 itself would become different from the case where no direct interaction takes place between surfactant and additive molecules in mesophases. This effect caused by urea binding would be proportional to the additive concentration, and hence, Δh0 would be modified to include an additional term, i.e.,
where K is a kind of binding constant of urea to the surfactant POE chain and Δhsat is the correction needed for the heat of transition when the POE chains are saturated by urea binding. This additional term is positive for the case of stabilization, that is H1 phase, while is negative for destabilization, that is, Lα phase. Taking into account the possible effect of urea on the critical packing parameter, the dotted lines in Fig. 4 were calculated by the use of the following parameter values; w12 = 800 J/mol, w13 = 700 J/mol, w23 = -500 J/mol, KΔhsat = -50 J/mol (Lα) and KΔhsat = 140 J/mol (H1). The calculated curves describe well the variations of maximum temperatures of Lα and H1 regions as a function of urea concentration.
4. Summary
In the present work, we investigated the effect of hydrophilic additives on the Lα and H1 phase regions in aqueous C12E7 mixture. It was found experimentally that sugars and glycerol shrink both mesophase regions toward lower temperature. The maximum temperatures of Lα and H1 regions decrease monotonously with the increase in the additive concentration. On the other hand, urea expands H1 region toward higher temperature, while its effect on Lα phase is weak. A statistical thermodynamic model was proposed to describe the phase behavior of aqueous C12E7 mixture in the presence of these additives. This model treats the mesophase as being composed of the surfactant molecular assemblies and intervening additive solution, while the liquid phase as a mixture of the three components, i.e., surfactant, water, and additive molecules. The free energies of each phase are evaluated as a function of temperature and additive concentration assuming that the mixtures are regular solution. At the phase transition temperature, the free energies should be equal to each other, from which the relation expressing the transition temperature as a function of the additive concentration is derived. According to this expression, the additive effect is governed by the balance of the three regular solution parameters, i.e., surfactant-water, surfactant-additive, and water-additive interaction energies. This model might be too simplified, nevertheless, it seems that the response of the mesophase-to-liquid phase transition to the addition of hydrophilic non-ionic compounds can be described rather well, at least, as a first approximation.
Appendix
Statistical thermodynamic model for mesophase-to-liquid phase transition
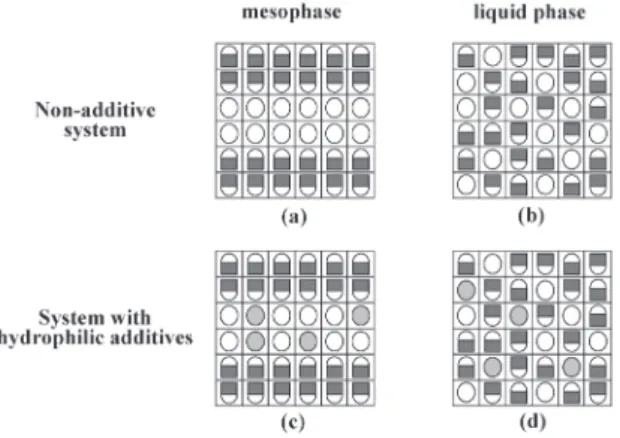
We describe the system using a lattice model, and make an assumption that a lattice is occupied by a single surfactant molecule, or by several water molecules, or by several additive molecules. This assumption was introduced to take into account the difference in molecular size among the three species, and this means that those water molecules and additive molecules behave altogether as a unit. This assumption looks far from a real situation. However, in order to simplify the treatment, we adopt this assumption. At first, we consider the non- additive system.
Non-additive system
In this case, we regard a mesophase as being composed of the surfactant molecular assemblies and intervening water among them as is shown schematically in Fig. A1(a). On the other hand, a liquid phase is regarded as a mixture of the lattices occupied by surfactant and by water (Fig. A1(b)), and we assume that the mixture is a regular solution. Let the numbers of the lattices occupied by surfactant and by water be n1 and n2, respectively, and let the volume of the lattice be V.
According to the above conditions, the partition function for mesophase is written as
[A1]
where Zsm and Zwm are partition functions of surfactant and water in mesophase, respectively, and are given by [A2]
[A3]
where hsm and ssm, and hwm and swm, are the enthalpy and entropy of surfactant and water molecules in a mesophase, respectively, and k is the Boltzmann constant. Then, the free energy of mesophase is expressed as
[A4]
where Fsm and Fwm are given by
[A5]
[A6]
The partition function for liquid phase is written as
[A7]
where Zsl and Zwl are partition functions of surfactant and water in liquid phase, respectively, and are given by
[A8]
[A9]
In the above equations, hsl and ssl, and hwl and swl, are the enthalpy and entropy of surfactant and water molecules in a liquid phase, respectively, and w12 is the interaction energy parameter between surfactant and water
Fig. A1 Schematic representation of mesophase (a) and liquid phase (b) for additive free system, and of mesophase (c) and liquid phase (d) for the system with hydrophilic additives.
molecules, which is defined by
[A10]
where u11, u22, and u12 are the pair interaction energies for surfactant-surfactant, water-water, and surfactant- water lattice pairs, respectively, and N is the coordination number, i.e., the number of nearest neighbor lattice.
The free energy of liquid phase is written as
[A11]
where Fsl and Fwl are given by
[A12]
[A13]
Let T0 the maximum temperature of the mesophase-to-liquid phase transition for non-additive system.
According to the condition of phase equilibrium, Fm = Fl at T = T0. This leads to the following expression for T0.
[A14]
where Δhs, Δhw, Δss, and Δsw are defined by
Here, we introduce the volume fraction of the components in the mixture, which are expressed as
volume fraction of surfactant: ; volume fraction of water:
Then, T0 can be expressed in terms of the volume fraction of surfactant in the mixture as follows.
[A15]
The numerator and denominator of Eq. A15 correspond to the heat and entropy change associated with the phase transition in non-additive system, respectively, i.e.
[A16]
[A17]
Eq. A16 shows that the heat of transition of the surfactant/water mixture is composed of the weighted average of the heat of transition for surfactant and that for water and the heat of mixing which arises from a homogeneous mixing in a liquid phase. Similarly, Eq. A17 shows that the entropy change associated with the phase transition is composed of the weighted average of the entropy change for surfactant and that for water and the entropy of mixing of the two components. These are reasonable picture for the present phase transition.
T0 can be expressed simply in terms of Δh0 and Δs0 as follows.
[A18]
T0 and Δh0 can be determined by the DSC experiments for additive-free system, and hence, Δs0 is calculated from Eq. A18.
System with hydrophilic additives
For the case of hydrophilic (water soluble) additives, it may be reasonable to assume that in a mesophase, the additives are mixed with water but not with surfactant (see Fig. A1(c)). In addition, we assume this mixture is a regular solution as well as a liquid phase. Following the same procedure as the case of non-additive system, we write the partition functions, and then, derive the free energies for both phases. Let the number of lattices occupied by surfactant, water, and additive be n1, n2, and n3, respectively.
The partition function for mesophase is
[A19]
where ZsmA, ZwmA, and ZamA are partition functions of surfactant, water, and additive in a mesophase, respectively, and are written as
[A20]
[A21]
[A22]
In the above equations, ham and sam are the enthalpy and the entropy of the additive in a mesophase, and w23 is the interaction energy parameter between water and additive molecules in a mesphase, which is defined similarly to Eq. A10. Then, the free energy of mesophase is given by
[A23]
The expressions for FsmA and so on are as follows.
[A24]
[A25]
[A26]
The partition function for liquid phase is expressed as
[A27]
where ZslA, ZwlA, and ZalA are partition functions of surfactant, water, and additive in a liquid phase, respectively, and are written as
[A28]
[A29]
[A30]
where hal and sal are the enthalpy and the entropy of additives in a liquid phase, and w12, w13, and w23 are the interaction energy parameters between surfactant and water molecules, between surfactant and additive molecules, and between water and additive molecules in a liquid phase, respectively. Here, we assumed that w23
in a liquid phase is the same as that in a mesophase. This assumption looks reasonable, because water and additive molecules retain a nature as a liquid even in a mesophase. Then, the free energy of a liquid phase is expressed as
[A31]
Each term in right hand side of the above equation is given by
[A32]
[A33]
[A34]
Let Tt be the maximum temperature of the mesophase-to-liquid phase transition in the presence of additives. The condition of phase equilibrium, FmA = FlA at T = Tt, results in the following relation.
[A35]
where the following replacement is made for the differences in enthalpy and entropy between liquid phase and mesophase,
and the volume fractions of each species are introduced, which are defined by
As mentioned in the text, the concentration of surfactant corresponding to the maximum transition temperature, φ1', obtained with hydrophilic additives is almost the same as that in non-additive system, φ1. Thus, one can replace φ1' in Eq. A35 with φ1. It is convenient to introduce the volume fraction of additives, x, in an aqueous solution of the additives, which is defined by
Then, φ3' and φ2' are expressed in terms of x as follows.
[A36]
Substituting Eq. A36 and φ1'=φ1 into Eq. A35, and rearranging appropriately, one can obtain the following expression for Tt as a function of x.
[A37]
where Δhwa and Δswa correspond to the following quantities,
and f(x)s are functions of x defined by
[A38]
[A39]
[A40]
Eq. A37 demonstrates that the variation of Tt with the additive concentration is governed by three interaction energy parameters, w12, w13, and w23, and the differences in the heat and entropy of transition between additive and water molecules, Δhwa and Δswa . It is expected that Δhwa and Δswa are negligibly small, because the transition enthalpy and entropy themselves would be close to zero for water and additive molecules due to rather similar environments of liquid phase and aqueous layer in mesophases. Under this approximation, Eq. A37 is reduced to
[A41]
This is Eq. 1 in the text.
References
[1] J. Sjöblom, P. Stenius, I. Danielsson, in: M. J. Schick (Ed.), Nonionic Surfactants, Marcel Dekker, New York, 1987, p. 369.
[2] R. G. Laughlin, The Aqueous Phase Behavior of Surfactants, Academic Press, London, 1994.
[3] T. Inoue, M. Matsuda, Y. Nibu, Y. Misono, M. Suzuki, Langmuir 17 (2001) 1833.
[4] J. S. Beck, J. C. Vartuli, W. J. Roth, M. E. Leonowicz, C. T. Kresge, K. D. Schmitt, C. T-W. Chu, D. H. Olson, E. W. Sheppard, S. B. McCullen, J. B. Higgins, J. L. Schlenker, J. Am. Chem. Soc. 114 (1992) 10834.
[5] Y. Lu, R. Gangull, C. A. Drewlen, M. T. Anderson, C. J. Brinker, W. Gong, Y. Guo, H. Soyez, B. Dunn, M. H.
Huang, J. I. Zink, Nature 389 (1997) 364.
[6] G. S. Attard, P. N. Bartlett, N. R. B. Coleman, J. M. Elliott, J. R. Owen, J. H. Wang, Science 278 (1997) 838.
[7] G. S. Attard, P. N. Bartlett, N. R. B. Coleman, J. M. Elliott, J. R. Owen, Langmuir 14 (1998) 7340.
[8] M. Green, P. O’Brien, Chem. Comm. (1998) 2459.
[9] J. Y. Ying, C. P. Mehnert, M. S. Wong, Angew. Chem. Int. Ed. 38 (1999) 56.
[10] E. Leontidis, Curr. Opin. colloid Interface Sci. 7 (2002) 81.
[11] S. E. Rankin, in: M. T. Lynch, P. T. Spicer (Eds.), Bicontinuous Liquid Crystals, Surfactant Science Series, Vol. 127, CRC Press, Boca Raton, 2005, p. 243.
[12] R. Burrows, J. H. Collett, D. Attwood, Int. J. Pharm. 111 (1994) 283.
[13] C-M. Chang, R. Bodmeier, J. Controlled Release 46 (1997) 215.
[14] C-M. Chang, R. Bodmeier, Int. J. Pharm. 173 (1998) 51.
[15] C. J. Drummond, C. Fong, Curr. Opin. colloid Interface Sci. 4 (1999) 449.
[16] F. Caboi, G. S. Amico, P. Pitzalis, M. Monduzzi, T. Nylander, K. Larsson, Chem. Phys. Lipids 109 (2001) 47.
[17] J. C. Shar, Y. Sadhale, D. M. Chilukuri, Adv. Drug Deliv. Rev. 47 (2001) 229.
[18] B. J. Boyd, in: M. T. Lynch, P. T. Spicer (Eds.), Bicontinuous Liquid Crystals, Surfactant Science Series,
Vol. 127, CRC Press, Boca Raton, 2005, p. 285.
[19] D. J. Mitchell, G. J. T. Tiddy, L. Waring, T. Bostock, M. P. McDonald, J. Chem. Soc., Faraday Trans. 179 (1983) 975.
[20] L. Q. Zheng, M. Suzuki, T. Inoue, B. Lindman, Langmuir 18 (2002) 9204.
[21] L. Q. Zheng, H. Minamikawa, K. Harada, T. Inoue, G. G. Chernik, Langmuir 19 (2003) 10487.
[22] T. Inoue, Y. Yokoyama, L. Q. Zheng, J. Collod Interface Sci. 274 (2004) 349.
[23] Y. Suezaki, H. Kamaya, I. Ueda, Biochim. Biophys. Acta 818 (1985) 31.
![Fig. 1 Temperature-composition phase diagram of binary mixture of C 12 E 7 and H 2 O [3].](https://thumb-ap.123doks.com/thumbv2/123deta/6405750.2138204/2.892.526.736.125.390/fig-temperature-composition-phase-diagram-binary-mixture-c.webp)