Diagnosing Communicative Ability in the Classroom : A holistic approach
journal or
publication title
Journal of Chikushi Jogakuen University and Junior College
number 1
page range 105‑116
year 2006‑01‑31
URL http://id.nii.ac.jp/1219/00000252/
Diagnosing Communicative Ability in the Classroom
― A holistic approach
Jan STEWART
1. Introduction
2. Method
The Communicative Diagnostic Tests (CDT 01 05) are the conceptual progeny of the English Diagnostic Test (see Stewart 1999; 2000; 2001). Whereas the English Diagnostic Test remained unchanged throughout its three-year life span, these second-generation communicative tests have changed every year since their inception. Although they retain certain aspects of their progenitor, namely, sections which test structure and reading comprehension, the Communicative Diagnostic Tests offer innovation in that they test purely communicative skills that focus on meaning, not form. Most significantly, in the case of CDT-05, a test of speaking skills was added.
In this paper I will present the results of the CDT-05, comparing students’ average scores in structure, reading, listening, speaking, and communication skills. These results will be analyzed according to performances by 1st-, 2nd-, 3rd-, 4th- and 5th-year students. Items proving to be most difficult will then be analyzed. The Diagnostic Test itself will be examined in light of item facility, item discrimination, and reliability, in order to determine its strengths and weaknesses, and to decide whether it has accurately described the sample of students in question.
The Communicative Diagnostic Test (CDT-05) consists of five parts: Structure, Communication, Reading, Listening and Speaking. Part 1 has 15 multiple-choice structure questions (1 correct answer and 3 distractors). Part 2 has three sets of communicative matching questions. Part 3 has a reading passage and 5 multiple-choice questions (two points each). Part 4 has 5 listening questions (1 correct answer and 2 distractors). Part 5 consists of a speaking test, scored at 5 points. The Test therefore has a total of 50 points, which are doubled to arrive at a total score of 100%.
The CDT-05 was administered on the first day of class, Spring Semester, 2005. Out of 93 respondents, 30 (32.3%) scored lower than 60% (compared to 18.1% of students who had failed the EDT). The average score on the CDT-05 was 65.57%, with scores ranging from 28% to 97%.
Each item was analyzed according to the number of students who answered correctly. This is known as Twelve items were answered incorrectly by more than 40% of the sample.
−
1
Item Facility.
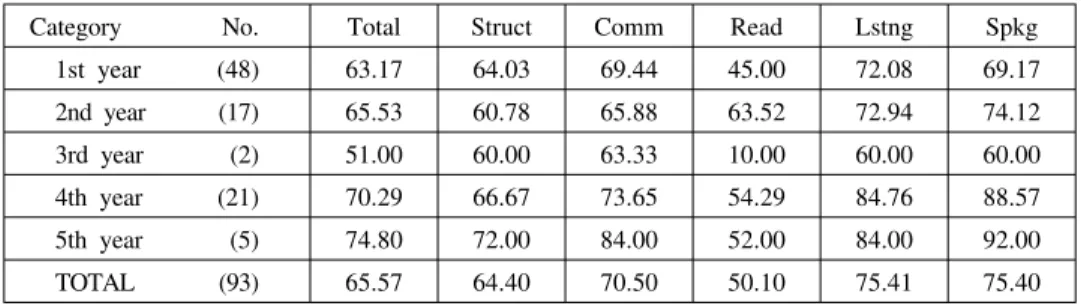
Table 1. Mean Scores (%): Total, and Section by Section
Structure
Category No. Total Struct Comm Read Lstng Spkg
1st year (48) 63.17 64.03 69.44 45.00 72.08 69.17
2nd year (17) 65.53 60.78 65.88 63.52 72.94 74.12
3rd year (2) 51.00 60.00 63.33 10.00 60.00 60.00
4th year (21) 70.29 66.67 73.65 54.29 84.76 88.57
5th year (5) 74.80 72.00 84.00 52.00 84.00 92.00
TOTAL (93) 65.57 64.40 70.50 50.10 75.41 75.40
A statistical measurement known as was used to compare students who did well on the entire test with those who did poorly (Brown, 1996). First the students were divided into three groups the top 27%, the bottom 27%, and the middle 46% (in this study 27% of 93 respondents came out to 27 students in the upper group and 25 students in the lower group). Then the percentage of correct answers of the bottom 27% was subtracted from that of the top 27%. The remainder was expressed as a decimal figure. These figures were compared to Ebel’s (1979) Item Discrimination scale to determine the strengths of individual test items.
Finally, the reliability of the test was evaluated. A split-half reliability measurement, which compared students’ answers on the odd-numbered items with their answers on the even-numbered items, was applied. An initial reliability estimate was made using the
based on the correlation between the two halves of the test (Brown, 1996). Two further measures of internal consistency, based on the standard deviation, the mean of the test scores, the Item Facility and the Item Difficulty, known as and were used to give additional estimates of the reliability of the test (Kuder and Richardson, 1937). Finally, these results were verified using Brennan’s (1984) phi-coefficient measure for test consistency.
In Part 1 (Structure), four items were answered correctly by fewer than 60% of the sample. In Part 2 (Communication) also, four items showed poor results. In Part 3 (Reading), all five items were remarkably poor. In Part 4 (Listening), 2 items scored rather poorly. Table 1 gives the general results of the test, in terms of average scores:
Four structure questions were answered correctly by fewer than 60% of the students. These questions are detailed below, along with their analyses, shown in Tables 2 5.
Item Discrimination
Spearman-Brown Prophecy formula,
K-R 20 K-R 21,
―
3. Result
−
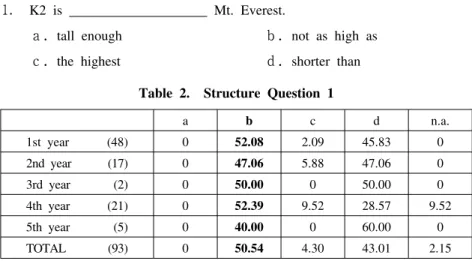
Table 2. Structure Question 1
Table 3. Structure Question 6
Table 4. Structure Question 7
a c d n.a.
1st year (48) 0 2.09 45.83 0
2nd year (17) 0 5.88 47.06 0
3rd year (2) 0 0 50.00 0
4th year (21) 0 9.52 28.57 9.52
5th year (5) 0 0 60.00 0
TOTAL (93) 0 4.30 43.01 2.15
(Percentage of students who answered each option)
a b c n.a.
1st year (48) 25.00 6.25 52.08 0
2nd year (17) 35.29 11.76 23.54 0
3rd year (2) 0 0 50.00 0
4th year (21) 9.52 4.76 19.05 0
5th year (5) 20.00 0 0 0
TOTAL (93) 22.58 6.45 36.56
(Percentage of students who answered each option)
b c d n.a.
1st year (48) 39.59 8.33 18.75 0
2nd year (17) 35.29 23.54 35.29 0
3rd year (2) 100 0 0 0
4th year (21) 33.33 0 23.81 4.76
5th year (5) 80.00 0 0 0
TOTAL (93) 40.86 8.60 21.51 1.07
(Percentage of students who answered each option) b 52.08 47.06 50.00 52.39 40.00 50.54
d 16.67 29.41 50.00 66.67 80.00 34.41
a 33.33
5.88 0 38.10 20.00 27.96
0 1.
6.
7.
K2 is Mt. Everest.
not as high as tall enough
shorter than the highest
: What’s this funny design on my computer screen?
: Be careful. It a virus.
will be perhaps maybe could be
go to class now.
He hasn’t to I’ve got to
They aren’t We’ve got not to
b a
d c
A B
a b c d
b a
d c
.
.
.
.
. . . .
.
.
.
.
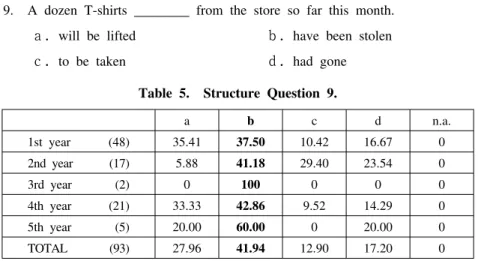
Table 5. Structure Question 9.
Table 6. Communication Question 3.
Communication
I’m afraid we’re full.
b
a c d n.a.
1st year (48) 35.41 10.42 16.67 0
2nd year (17) 5.88 29.40 23.54 0
3rd year (2) 0 0 0 0
4th year (21) 33.33 9.52 14.29 0
5th year (5) 20.00 0 20.00 0
TOTAL (93) 27.96 12.90 17.20 0
(Percentage of students who answered each option)
a c d e n.a.
1st year (48) 16.67 8.33 4.17 18.75 0
2nd year (17) 17.65 5.88 0 35.29 0
3rd year (2) 0 0 0 50.00 0
4th year (21) 4.76 0 0 19.05 4.76
5th year (5) 0 20.00 0 20.00 0
TOTAL (93) 12.90 6.45 2.15 22.58 1.08
(Percentage of students who answered each option) b 37.50 41.18 100 42.86 60.00 41.94
b 52.08 41.18 50.00 71.43 60.00 54.84
9. A dozen T-shirts from the store so far this month.
have been stolen will be lifted
had gone to be taken
Three sets of matching questions, adapted from and
(Oxford University Press), were used to evaluate students’ communicative abilities.
Details are shown in Tables 6 9. One question, from reads:
I’ll think about it.
3. Do you have a room for tonight?
Sunny side up.
Anything else?
Single or return?
Another question, from reads:
Could I speak to Ms. Ito, then?
10. There’s something wrong with my bill.
Could you fax me the report?
I’m sorry about that.
b a
d c
a
c d e
a b c
.
.
.
.
−
.
.
.
.
.
.
.
.
Passport To New Places, Passport To Work, Passport Plus
Passport To New Places,
Passport to Work,
2
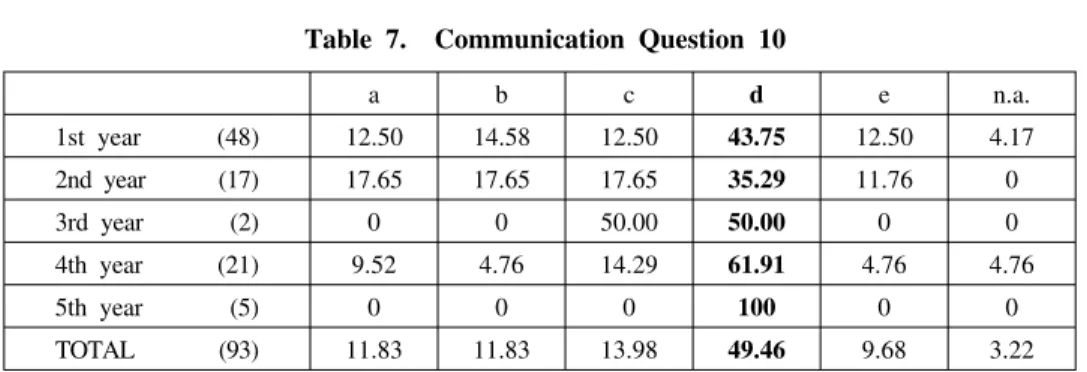
Table 7. Communication Question 10
Table 8. Communication Question 12.
Table 9. Communication Question 15
That’s a charge for room service d
a b c e n.a.
1st year (48) 12.50 14.58 12.50 12.50 4.17
2nd year (17) 17.65 17.65 17.65 11.76 0
3rd year (2) 0 0 50.00 0 0
4th year (21) 9.52 4.76 14.29 4.76 4.76
5th year (5) 0 0 0 0 0
TOTAL (93) 11.83 11.83 13.98 9.68 3.22
(Percentage of students who answered each option)
b c d e n.a.
1st year (48) 41.67 4.17 2.08 2.08 2.08
2nd year (17) 35.29 5.88 5.88 0 0
3rd year (2) 50.00 0 0 0 0
4th year (21) 42.86 0 0 0 9.52
5th year (5) 0 20.0 0 0 0
TOTAL (93) 38.71 4.30 2.15 1.07 3.23
(Percentage of students who answered each option)
a c d e n.a.
1st year (48) 45.83 2.08 4.18 0 2.08
2nd year (17) 47.06 5.88 0 0 0
3rd year (2) 50.00 0 0 0 0
4th year (21) 38.10 0 0 4.76 9.52
5th year (5) 20.00 0 0 0 0
TOTAL (93) 43.01 2.15 2.15 1.07 3.23
(Percentage of students who answered each option)
d 43.75 35.29 50.00 61.91 100 49.46
a 47.92 52.95 50.00 47.62 80.00 50.54
b 45.83 47.06 50.00 47.62 80.00 48.39
.
.
.
.
.
.
. e
a b c d e
I’m going to do it tomorrow.
Two additional questions, from read:
I can’t make it to the meeting.
12. And what’s the message?
It went very well.
15. What did you think of the meeting?.
There’s one every hour.
I know where there’s a sale.
About an hour.
Passport Plus,
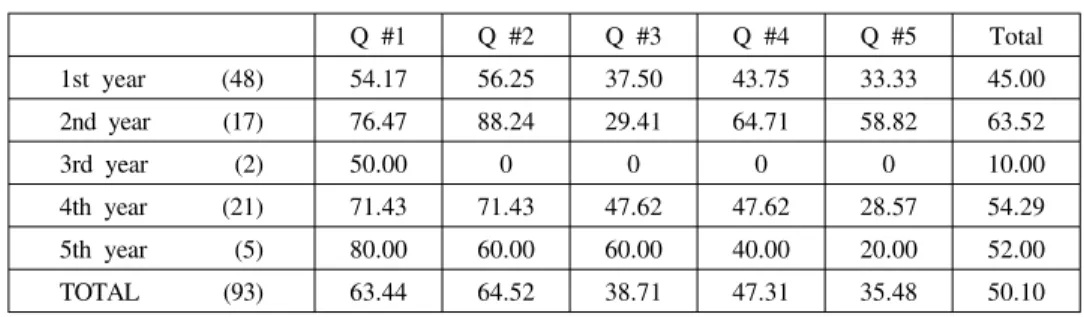
Table 10. Reading (%): Question by Question Reading
Listening
Q #1 Q #2 Q #3 Q #4 Q #5 Total
1st year (48) 54.17 56.25 37.50 43.75 33.33 45.00
2nd year (17) 76.47 88.24 29.41 64.71 58.82 63.52
3rd year (2) 50.00 0 0 0 0 10.00
4th year (21) 71.43 71.43 47.62 47.62 28.57 54.29
5th year (5) 80.00 60.00 60.00 40.00 20.00 52.00
TOTAL (93) 63.44 64.52 38.71 47.31 35.48 50.10
(Percentage of students who answered each question correctly)
The Reading section consists of a 1-page passage (430 words) about a popular baseball player.
The text includes information about his offensive and defensive performances, awards received, records broken, his career history, and some personal details. The questions concerned reading for information (#1), finding the main idea (#2), inferencing (#3), determining cause and effect (#4), and drawing conclusions (#5). Questions 1 and 2 were answered by about 64% of the students. Questions 3, 4 and 5 were answered correctly by 39%, 47%, and 35%, respectively. The low scores in this section indicate that critical thinking skills are a particular weakness among the sample tested (see Stewart, 2003).
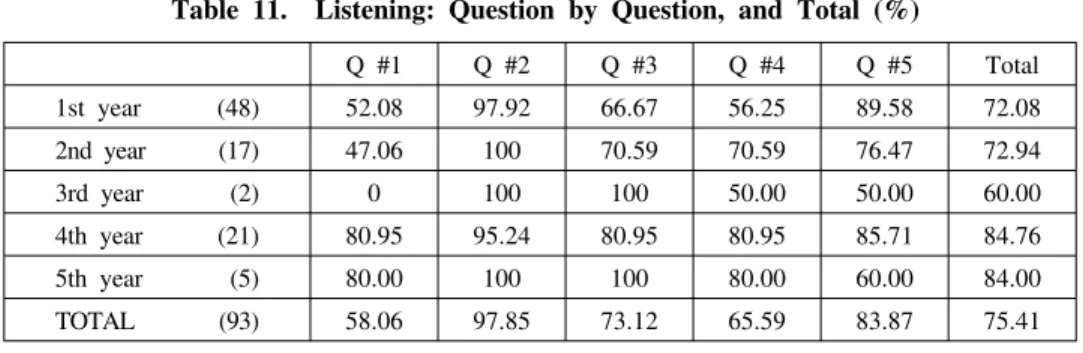
The Listening section was based on a script, adapted from
(Hokuseido Press, 2005). It was about a lady who went into an ice cream shop and ordered a vanilla cone. While waiting, she noticed that a famous actor was also there, but she tried to act nonchalant in front of him. Outside the shop, she realized that she had forgotten her ice cream cone.
She went back, but the actor told her she had put the cone into her purse along with her change.
The questions follow:
1 What did the lady order in the ice cream shop?
2 Whom did the lady see there?
3 What did the lady do inside the shop?
4 What did she do outside the shop?
5 What happened in the end?
Systematic Listening for the TOEIC Test
.
.
.
.
.
Table 11. Listening: Question by Question, and Total (%)
Speaking
Q #1 Q #2 Q #3 Q #4 Q #5 Total
1st year (48) 52.08 97.92 66.67 56.25 89.58 72.08
2nd year (17) 47.06 100 70.59 70.59 76.47 72.94
3rd year (2) 0 100 100 50.00 50.00 60.00
4th year (21) 80.95 95.24 80.95 80.95 85.71 84.76
5th year (5) 80.00 100 100 80.00 60.00 84.00
TOTAL (93) 58.06 97.85 73.12 65.59 83.87 75.41
(Percentage of students who answered correctly)
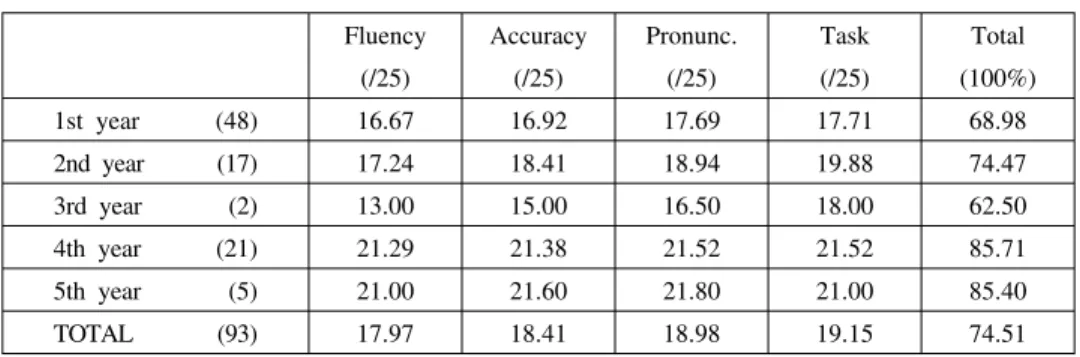
The Speaking section of the test consisted of an oral interview, in which students were called to the front of the room in pairs (or by threes) and interviewed by the examiner.
The oral interview took the form of a question-and-answer session. First the examiner asked each student questions. Then the students asked questions of each other, and answered them. Content was based on a set of eight illustrations: 1) a brief narrative, 2) an office scene, 3) a number of people telling what they would bring to a picnic, 4) a family meeting their homestay guest at the airport, 5) another office scene, 6) a teacher standing in front of her class, 7) a map of a city, and 8) a man and a woman in various locations, including a restaurant, a library, a bank, and at home in the kitchen.
The illustrations lent themselves easily to testing communicative functions such as describing people, asking and telling the time, asking and giving information about routines and habits, what someone is doing at the moment, simple narratives, reporting what people say, future plans or inten- tions, signs and notices, giving directions, information about places, comparisons, expressing cause and result, making / granting / refusing simple requests, and expressing ability in the past or present.
Scoring of the oral interview was done in accordance with the criteria set by the Cambridge Examination Board for the (P.E.T.). The criteria included Fluency, Accuracy, Pronunciation, and the degree to which the students accomplished the Task at hand. These criteria were awarded a total of 25 points each, for a total of 100 points (%) on the Speaking Section (although this counted as only 10% of the entire score of the CDT-05). The results are shown in Table 12.
3
Preliminary English Test
Table 12. Speaking: Section by Section (25 points each), and Total (%)
a. Item Facility
b. Item Discrimination
Fluency (/25)
Accuracy (/25)
Pronunc.
(/25)
Task (/25)
Total (100%)
1st year (48) 16.67 16.92 17.69 17.71 68.98
2nd year (17) 17.24 18.41 18.94 19.88 74.47
3rd year (2) 13.00 15.00 16.50 18.00 62.50
4th year (21) 21.29 21.38 21.52 21.52 85.71
5th year (5) 21.00 21.60 21.80 21.00 85.40
TOTAL (93) 17.97 18.41 18.98 19.15 74.51
4. Discussion
Item Facility analysis is important because it tells us, at a glance, how many students answered each question correctly (Brown, 1996, 64-66). In CDT-05, Item Facility ranges from about 28% of students on some items to over 97% on other items. Those questions that were answered by more than 60% of the respondents are considered to have been adequately learned by the sample in general.
Questions that were answered by lower percentages, however, indicate that remedial instruction is necessary.
There is always the possibility that individual test items render low Item Facility scores for reasons low student proficiency levels. Test items that contain internal flaws may mislead students. One way to determine whether a test question is good or bad is to conduct an
analysis.
Item Discrimination compares students who did well on the entire test with those who did poorly (Brown, 1996, 66-69). First we divide the students into three groups: the top 27%, the bottom 27%, and the middle 46%. Then we subtract the number of correct answers of the bottom 27% from those of the top 27%. The remainder gives us the Item Discrimination score, expressed as a decimal figure. Usually, an item which falls within a range of .30 .70 is considered a good test item.
Ebel (1979, 267) proposed the following guidelines for evaluating test items:
Very good .40 and above
Good, but may need improvement .30 to .39
Needs improvement .20 to .29
Reject .19
other than
Item Discrimination
≦
−
Items with low Item Frequency and high Item Discrimination may be considered effective indicators of poor student performance. Examples on the CDT-05 include Structure questions #1 (I.F. = 50.53, I.D. = 0.46), #6 (I.F. = 34.41, I.D. = 0.43); Communication questions #3 (I.F. = 54.84, I.D. = 0.56),
#10 (I.F. = 49.46, I.D. = 0.66), #12 (I.F. = 50.54, I.D. = 0.46), #15 (I.F. = 48.39, I.D. = 0.54);
Reading questions #4 (I.F. = 47.31, I.D. = 0.54), #5 (I.F. = 35.48, I.D. = 0.48); Listening question
#1 (I.F. = 58.06, I.D. = 0.57).
The of a test tells us to what extent the results obtained on one occasion will be consistent with the results obtained if the test is given on another occasion (Brown, 1996, 185). For several reasons, however, giving the test on a different occasion presents insurmountable difficulties.
The most obvious is that this particular test was given on the first day of class. Students’ expecta- tions are high, and the element of surprise cannot be reproduced at a later date. Even if students are to be given exactly the same test later, there is always the possibility that by that time they will have something, either as a result of attending lectures, or possibly as a result of having taken the test the first time. Moreover, it is difficult to ensure consistent attendance, not to mention the possibility of illness or other personal circumstances that may tend to affect performance on a second test.
Therefore it is necessary to the second test. In order to do this, one single test can be divided into two halves, one half consisting of the odd-numbered questions, the other half consisting of the even-numbered questions (Brown, 1996, 194-6). Using the
the CDT-05 yielded a reliability estimate of 0.80, with a Standard Error of Measurement of 2.57.
The Cronbach alpha score, based on the standard deviation of each half, rendered a reliability estimate of 0.81, with a Standard Error of Measurement of 2.50.
However, the split-half method itself may not be the most reliable instrument for evaluating reliability, inasmuch as a random re-ordering of test items would not consistently produce the same odd-even combination. Theoretically, if all the high-facility test items were aligned in the odd-numbered positions, and all the low-facility items in the even-numbered positions (or vice versa), a quite different set of figures would emerge for the reliability estimates obtained using this method.
Whereas the Spearman-Brown Prophecy formula and the Cronbach alpha use the split-half method, Kuder and Richardson (1937) devised a method which divides the test into two halves: Item Facility (percent correct) vs. Item Difficulty (1 I.F.). Calculations using these halves, combined with the standard deviation, produce more reliable results than the split-half (odd-even) method (Brown, 1996, 197-203).
c. Reliability reliability
learned
simulate
Spearman-Brown Prophecy formula,
different
−
Kuder-Richardson formula 21 underestimate K-R 21, K-R 20,
phi consistency
phi
tends to the reliability of a test. Using the CDT-05 had a reliability estimate of 0.75, with a 2.87 Standard Error of Measurement. a much more accurate measure of reliability (based on the Item Variance), gave the CTD-05 a reliability estimate of 0.78, with a 2.69 Standard Error of Measurement.
The above calculations apply to criterion-referenced interpretations. While the CDT-05 is a criterion-referenced test, it must be pointed out that there is a difference between tests in which items are sampled from specific course objectives, and those in which items are sampled from a general but well-defined domain of behaviors. The results on a domain-referenced test can describe a student’s status relative to that domain of behaviors, rather than subtests of specific course objectives. Analysis of the consistency of domain-referenced tests, however, is also appropriate for analyzing objectives- referenced tests (Brown, 1996, 218-19).
Brennan (1984, 315 316), reported a general-purpose estimate of the dependability of a domain- referenced test based on the proportion scores (the percentage of correct answers on the actual number of test items, not weighted). He demonstrated that for any given test, K-R 21 < < K-R 20. The Communicative Diagnostic Test, therefore, should have a test of between .75 and .78. This was borne out in calculations, which gave the CDT-05 a coefficient of 0.756616.
In general, the Communicative Diagnostic Test 2005 proved to be more difficult than the English Diagnostic Test 1998-1999 (having average scores of 65.6% and 72.2%, respectively). This imbalance was offset somewhat by the higher scores in the Speaking and Listening sections of the CDT-05, but it was exacerbated by much lower scores in the Reading section. Scores in the newly added Communication section were about five percentage points higher than the whole-test average.
Five out of fifteen Structure items on the CDT-05 had Item Discrimination values over 0.40; nine out of fifteen items on the Communication section were also rated very good. Three items in the Reading section were rated very good, while the other two items were rated good, but may need improvement. Two items in the Listening section scored over 0.40, but the other three items scored very poorly in terms of Item Discrimination.
One of the most significant innovations of the CDT-05 was the addition of an oral interview, which strengthens the focus on communication in testing. Average scores on the Oral Interview were nearly 10 points higher than the whole-test total average score, yet (interestingly) nearly equal to the average scores on the Listening section.
The CDT-05 is a potentially reliable instrument, yet students’ performances on a test will vary for a number of reasons. The components of language competence that may affect meaningful
−
5. Conclusion
4
variance on tests include Grammatical Competence, such as vocabulary, morphology, syntax, phonology;
Textual Competence, such as cohesion and rhetorical organization; Illocutionary Competence, such as ideational, manipulative, heuristic, and imaginative functions; Sociological Competence, such as sensitivity to dialect, register, naturalness, and the ability to interpret cultural references and figures of speech (Bachman, 1990). The reliability (or lack of reliability) of the Communicative Diagnostic Test may result from a combination of these and other factors.
A diagnostic test can be useful in two ways. Teachers can use it to determine whether students have been properly placed, in programs where placement occurs, or they can use it to determine students’ strengths and weaknesses once instruction begins. Diagnostic tests eliminate redundancy, allowing teachers to focus on areas that need the most attention.
As such the diagnostic test forms part of an overall testing program, which progresses in four stages. The first stage consists of the initial screening procedures (entrance exams). The second stage entails placement of students. The third stage involves diagnosis. The fourth stage concerns achievement. In all stages of testing, teachers or program planners may gather information that helps them improve the curriculum.
A systems approach to language curriculum planning includes needs analysis, setting goals and objectives, materials development, teaching methods, testing, and program evaluation. Needs include not only the needs of the students; there are many other factors involved. Teachers, administrators, employers, institutions, societies, even nations may have a stake in what transpires in the classroom.
Program goals are statements of what must be accomplished to satisfy students’ needs. Objectives, on the other hand, are statements of the exact skills that students must possess in order to achieve these goals. Materials may be developed or selected according to decisions made concerning the above factors. Testing, including a diagnostic test, affords us the opportunity to analyze the appropriateness of the course objectives for students’ abilities. When all relevant information has been systematically collected, we are able to evaluate the effectiveness of the language program, and promote the improvement of the curriculum. These six factors, needs analysis, goals and objectives, materials, methods, testing, and evaluation, interact with one another to form a dynamic, ongoing process of curriculum development. In programs that emphasize a Communicative Diagnostic Test plays an important role in that process.
communication,
Notes
References
1 The years were determined by Student Identification Numbers, which reflect the date students entered the university. Some, due to their participation in study abroad programs (or other reasons) found themselves in their fifth year of undergraduate study at the time of testing.
2 Distractor (a) is ruled out, being the only correct answer for item # 3: Mr. Parker is in a meeting.
3 A complete list of functions appears in the Examiner’s Manual for the Cambridge (P.E.T.).
4 Underhill (1987) writes, When a learner says something that is relevant and true (for himself at least), to someone else who is interested and has not heard it before (from that speaker, at least), then that act of speech is communicative (p.8). However each part of this statement may be contested. Interest and relevance may be important in learning and retention, but they have no major impact on communica- tion. Too, is a lie any less communicative than the truth? Of course the truth is more desirable, but both transmit meaning from one person to another. Finally, repetition of a statement does not necessarily negate its communicative qualities.
Bachman, L. (1990). Oxford: Oxford University Press.
Brennan, R. (1984). Estimating the dependability of the scores. In R. Berk (Ed.), Baltimore: Johns Hopkins University Press.
Brown, J.D. (1996). Upper Saddle River, New Jersey: Prentice Hall Regents.
Ebel, R. (1979). (3rd ed.). Englewood Cliffs, New Jersey: Prentice-
Hall.
Kuder, G., and M. Richardson (1937). The theory of estimation of test reliability. 2, 151 160.
Stewart, J. (1999). Diagnosis of students’ English needs in three universities, 1998 1999. Paper presented at the JACET Kyushu-Okinawa Chapter 15th Annual Conference at Miyazaki, November 27, 1999.
(2000). Item facility, item discrimination, and reliability of the English Diagnostic Test. JACET
Kyushu-Okinawa Chapter, No.5, 65-83.
(2001). Increasing instructional efficiency from day one The English Diagnostic Test. Chikushi Jogakuen University No.13, 205-226.
(2003). Using critical and creative thinking skills to transcend the grammar barrier Convergent
questioning. Chikushi Jogakuen University &
Junior College, No.15, 13-25.
Underhill, N. (1987). Cambridge: Cambridge
University Press.
Preliminary English Test
Fundamental considerations in language testing.
A guide to criterion- referenced test construction.
Testing in language programs.
Essentials of educational measurement
Psychometrika,
Annual Review of English Teaching and Learning,
Bulletin,
Bulletin of the International Cultural Research Institute,
Testing spoken language: A handbook of oral testing techniques.
−
−
−
−