Inhibitory effects of Boui-derived alkaloids on human T cells
and their synergic effects on steroid pharmacodynamics
防已由来アルカロイドのヒト T 細胞制御作用
とステロイドの薬効増強作用
許 文成
TABLE OF CONTENTS
ABBREVIATIONS ... 1
INTRODUCTION ... 3
Chapter 1 Tetrandrine and cepharanthine induce apoptosis through caspase cascade regulation, cell cycle arrest, MAPK activation and PI3K/Akt/mTOR signal modification in steroid resistant human leukemia Jurkat T cells 1.1 INTRODUCTION ... 7
1.2 MATERIALS AND METHODS ... 8
1.2.1 Drugs and reagents ... 8
1.2.2 Cell culture ... 9
1.2.3 Cell viability measured by WST-8 assay ... 9
1.2.4 Hoechst 33342 fluorescent staining ... 9
1.2.5 Assessment of apoptosis ... 10
1.2.6 Cell cycle analysis ... 10
1.2.7 Western blot analysis ... 10
1.2.8 Statistical analysis ... 11
1.3 RESULTS ... 11
1.3.1 TET and CEP inhibit the proliferation of Jurkat T cells and change the cell morphology ... 11
1.3.2 TET and CEP induce apoptosis in Jurkat T cells ... 13
1.3.3 TET and CEP regulate the expression of proteins related to caspase cascades ... 14
1.3.4 TET and CEP trigger the cell cycle arrest in Jurkat T cells ... 18
1.3.6 TET and CEP activate MAPK ... 19
1.3.7 TET and CEP modify PI3K/Akt/mTOR signaling pathway... 19
1.3.8 Synergic effect of steroid combined with TET or CEP on Jurkat T cell proliferation ... 22
1.4 DISCUSSION ... 23
1.5 CONCLUSION ... 29
Chapter 2 Tetrandrine potentiates the steroid pharmacodynamics in mitogen-activated peripheral blood mononuclear cells of healthy subjects 2.1 INTRODUCTION ... 30
2.2 MATERIALS AND METHODS ... 30
2.2.1 Drugs and reagents ... 30
2.2.2 Subjects ... 31
2.2.3 Isolation of PBMCs and evaluation of drug effects in vitro ... 31
2.2.4 Functional assays for P-glycoprotein ... 32
2.2.5 Quantification of human cytokines ... 33
2.2.6 CD4+ CD25+ Foxp3+ T cell analysis ... 33
2.2.7 Assessment of phosphorylation of MAPK isoforms ... 34
2.2.8 MOLT-4 and MOLT-4/DNR cell culture ... 34
2.2.9 Western blot analysis ... 35
2.2.10 Statistical analysis ... 35
2.3 RESULTS ... 36
2.3.3 Effects of MP combined with TET on cytokine production from mitogen-activated
PBMCs ... 38
2.3.4 Effects of MP combined with TET on the frequency of CD4+ CD25+ Foxp3+ T cells in mitogen-activated PBMCs ... 39
2.3.5 Effect of MP combined with TET on phosphorylation of MAPK isoforms in mitogen-activated PBMCs ... 40
2.3.6 Effect of MP combined with TET on the translocation of GR ... 41
2.4 DISCUSSION ... 43
2.5 CONCLUSION ... 46
Chapter 3 Immunosuppressive efficacy of tetrandrine combined with methylprednisolone against mitogen-activated peripheral blood mononuclear cells of hemodialysis patients 3.1 INTRODUCTION ... 48
3.2 MATERIALS AND METHODS ... 48
3.2.1 Drugs and reagents ... 48
3.2.2 Subjects ... 49
3.2.3 Preparation of PBMCs ... 49
3.2.4 Evaluation of drug pharmacodynamics in vitro ... 51
3.2.5 Quantification of human cytokines ... 51
3.2.6 Statistical analysis ... 51
3.3 RESULTS ... 52
3.3.2 Effects of TET on mitogen-activated PBMC proliferation of hemodialysis patients
... 53
3.3.3 Effects of combination of MP and TET on mitogen-activated proliferation of PBMCs obtained from hemodialysis patients ... 54
3.3.4 Relationship between immunosuppressive potencies of the drug and clinical parameters of hemodialysis patients ... 56
3.3.5 Effects of TET in the presence or absence of MP on IL-6 production from mitogen-activated PBMCs of hemodialysis patients ... 56
3.4 DISCUSSION ... 58
3.5 CONCLUSION ... 61
Chapter 4 Plant-derived alkaloid sinomenine potentiates steroid pharmacodynamics in mitogen-activated human peripheral blood mononuclear cells by regulating the translocation of glucocorticoid receptor 4.1 INTRODUCTION ... 62
4.2 MATERIALS AND METHODS ... 63
4.2.1 Drugs and reagents ... 63
4.2.2 Subjects ... 63
4.2.3 Isolation and culture of PBMCs, and evaluation of drug effects in vitro ... 64
4.2.4 Functional assays for P-glycoprotein in PBMCs ... 64
4.2.5 Jurkat cell culture ... 64
4.2.6 Western blot analysis ... 65
4.2.7 Immunofluorescence ... 65
4.2.8 Statistical analysis ... 66
4.3.1 Effects of SN in the presence or absence of MP on mitogen-activated proliferation
of PBMCs ... 66
4.3.2 Effects of SN in the presence or absence of MP on P-glycoprotein function of PBMCs ... 67
4.3.3 Effects of SN in the presence of MP on GR expression level and GR subcellular localization of Jurkat cells ... 68
4.3.4 Effects of SN alone on GR expression level and GR subcellular localization of Jurkat cells ... 70
4.3.5 Effects of SN in the presence or absence of MP on GR subcellular compartmentalization in Jurkat cells ... 71
4.3.6 Effects of SN in the presence or absence of MP on GR expression level and GR subcellular localization in PBMCs ... 72
4.4 DISCUSSION ... 73
4.5 CONCLUSION ... 75
GENERAL DISCUSSION AND CONCLUSION ... 76
ACKNOWLEDGMENTS ... 79
ABBREVIATIONS
Bax Bcl-2 CEP Con A CPT DMSO DNR FBS GC GR MAPK MP mTOR NF-κB PBMC PBS T-ALL TBST TET PI PI3K RIPA Rh123 S.D. S.E.M. Bcl-2-associated X protein B-cell lymphoma 2 cepharanthine concanavalin A camptothecin dimethyl sulfoxide daunorubicin fetal bovine serum glucocorticoidglucocorticoid receptor
mitogen-activated protein kinases methylprednisolone
mammalian target of rapamycin
nuclear factor kappa light chain enhancer of activated B cells human peripheral blood mononuclear cell
phosphate buffered saline
T-cell acute lymphoblastic leukemia Tris buffered saline with Tween tetrandrine
propidium iodide
phosphatidylinositol 3-kinase
radioimmunoprecipitation assay buffer Rhodamine 123
standard deviation
INTRODUCTION
T cells are a key component of the adaptive immune system, which act as both coordinators and effectors of immunity. As such, T cells are instrumental in protecting the host from invading pathogens and malignancies. The different stages of T cell activation, expansion and contraction are integrated with systemic inflammation and the control of microbial or cancer cell growth. However, when activated inappropriately due to cell-intrinsic or cell-extrinsic factors, T cells contribute to a wide spectrum of diseases such as T-cell acute lymphoblastic leukemia (T-ALL), autoimmune disorders, or organ transplant rejection [1].
Glucocorticoid receptor (GR), combined with glucocorticoid (GC), represses cytokine and interleukin gene transcription and triggers programmed cell death (apoptosis) in T cells. The GC-induced apoptosis may help to eliminate developing T cells or thymocytes that are differentiating improperly [2]. Therefore, GCs are used as first choice drugs in the treatment of patients with ALL or several autoimmune diseases as still essential components of treatment [3]. However, lots of patients show poor response to monotherapy with prednisone [4].
long-term side effects, especially for pediatric T-ALL [7]. Faced with these clinical challenges, it is urgent to develop more effective and less toxic therapy strategy for T-ALL.
GC therapy combined with immunosuppressive drugs is effective to suppress acute allograft rejection in organ transplantations. However, approximately 30% of the patients receiving kidney transplantation show no or an inadequate response to the GC therapy, which is an important risk factor for inferior renal allograft outcome [8]. Other immunosuppressive drugs such as basiliximab, calcineurin inhibitors, mTOR inhibitors and purine-synthesis inhibitors are alternative strategy for prevention of acute allograft rejection [9, 10]. Regardless of therapeutic drug monitoring based therapy, large individual variation in clinical efficacy of calcineurin inhibitors has been observed. Such individual variation in clinical efficacy of immunosuppressive drugs might also be observed in many cases of organ transplant recipients in not only pharmacokinetic but also pharmacodynamic basis [11]. Taking together with the above clinical problems, it is worthy to develop new therapeutic approaches, which can decrease the doses, and therefore adverse effects, of GCs and other immunosuppressive drugs for organ transplant recipients.
T lymphocyte subsets and GC response in myasthenia gravis patients [13]. Activation of mitogen-activated protein kinase (MAPK) pathways by certain cytokines in the cytoplasm also impeded the GR translocation, thus decreasing the pharmacodynamics of GCs [14]. In addition to these points, abnormal GR expression also contributes to GC resistance. A decreased number of GR or increased expression of GR β was observed in GC resistant patients of several diseases, including asthma, rheumatoid arthritis and inflammatory bowel disease [14, 15]. Moreover, genetic factors also determine GC responsiveness because GC resistant asthma is often related with families [14]. In my study, I focused on P-glycoprotein and MAPK mediated GC resistance, since these molecular mechanisms have been suggested to be implicated with GC resistance in several autoimmune diseases and lymphocytic leukemia [2, 14, 15]. Blocking these negative factors is a possible strategy to overcome the GC resistance.
Tetrandrine (TET), derived from a medicinal plant Stephania tetrandra S. Moore (中国 産防已), is a bisbenzylisoquinoline alkaloid, and was approved for treating patients with silicosis and rheumatoid arthritis in China since 1981. Our previous study revealed that TET enhanced the cytotoxicity of anticancer drugs by reversing P-glycoprotein-mediated daunorubicin resistance in multidrug-resistant human T lymphoblastoid leukemia MOLT-4 cells [16]. Meanwhile, TET alone at concentrations of μM showed suppressive effect on proliferation of T cells stimulated with phorbol 12-myristate 13-acetate and anti CD28 antibody [17, 18]. Recent investigations also firmly supported that TET would be a potential candidate for cancer chemotherapy [19, 20]. TET upregulated the caspase cascade protein (cleaved PARP, cleaved caspase-3 and cleaved caspase-9) and inhibited the phosphorylation of Akt/mTOR, resulted in apoptosis induction on human gastric cancer cells [21]. From these points of view, I was encouraged to investigate inhibitory effects of TET on human T cells and its synergic efficacy on GC pharmacodynamics.
Caulis Sinomenii is collected as the herb of Boui in Japanese Pharmacopeia (17th edition). Sinomenine (SN) is the main active alkaloid of herbal plant Sinomenium acutum (Thunb.) (日 本産防已). Lots of studies also indicated that SN showed anti-rheumatoid arthritis efficacy by inhibiting the proliferation of lymphocytes [22, 23]. Moreover, SN was reported to down-regulate P-glycoprotein expression and inhibit the efflux function of P-glycoprotein in multidrug resistant bladder cancer cell model 253J/DOX [24]. Hence, in the present study, I also evaluated the potential additive effect of SN on GC pharmacodynamics in vitro to suppress the proliferation of human T lymphocytes.
Chapter 1
Tetrandrine and cepharanthine induce apoptosis through caspase cascade
regulation, cell cycle arrest, MAPK activation and PI3K/Akt/mTOR signal
modification in steroid resistant human leukemia Jurkat T cells
1.1 INTRODUCTION
Acute lymphoblastic leukemia (ALL) is a heterogeneous hematologic disease characterized by the proliferation of immature lymphoid cells in the bone marrow, peripheral blood, and other organs [25]. Approximately 75 to 80% of ALL develop in children [26]. Optimal use of antileukemic drugs and improved supportive care in contemporary clinical trials has improved the 5-year survival rate of childhood ALL above 85% in developed countries [27]. However, the majority (~ 80%) of relapses occurs within 2 years of diagnosis in T cell ALL (T-ALL), and the prognosis after relapse is dismal, with a 5-year survival of less than 10% [28].
Since poor response to GC is one of the strongest predictors of adverse outcome for the treatment of childhood T-ALL [4], GC-resistant human leukemia Jurkat T cell line [31], a well-established T-ALL tumor line from the peripheral blood of a 14-year-old boy [32], was used in the present study to examine potential efficacy of TET and CEP and their underlying action mechanisms focusing on caspase cascade, cell cycle, MAPK and PI3K/Akt/mTOR signaling pathway.
1.2 MATERIALS AND METHODS 1.2.1 Drugs and reagents
1:400, #NBP2-32840) and Akt1 p Ser473 (dilution 1:250, #NB100-56749) were purchased from Novus Biologicals, LLC. ERK (0.2 μg/mL, #AF1576), p-ERK(0.1 μg/mL, #AF1018), JNK(0.2 μg/mL, #AF1387), p-JNK(0.5 μg/mL, #AF1205), p38(0.5 μg/mL, #AF8691) and p-p38(1 μg/mL, #MAB8691) were provided by R&D Systems, Inc. All other reagents were of the highest quality available from commercial vendors.
1.2.2 Cell culture
Human leukemic Jurkat T-cells were purchased from ATCC and cultured in RPMI 1640 medium containing 10% FBS, 100,000 IU/L penicillin G sodium salt and 100 mg/L streptomycin sulfate, and maintained as cell suspension at 37℃ in a humidified atmosphere of 5% CO2.
1.2.3 Cell viability measured by WST-8 assay
Jurkat T-cells (1.5×10⁵ cells/mL) per well were seeded into 96-cell plates, and TET or CEP was subsequently added into the corresponding wells to adjust the final concentrations of 3, 5, 10 and 15 μM, respectively. The cells were incubated with ethanol or DMSO as a control. After 48 h incubation, 10 μL of WST-8 solution was added to each well, followed by additional incubation for 3 h at 37℃. The optical density value was measured at 450 nm absorbance (ref. 650 nm). The cell viability rate was calculated by (Test-Blank)/(Control-Blank)×100%.
1.2.4 Hoechst 33342 fluorescent staining
alteration-related apoptosis were captured with a fluorescence microscope (Biozero BZ-8000 Series, Keyence, Japan).
1.2.5 Assessment of apoptosis
Jurkat cells were seeded in 24-well plates and treated with serial concentrations of TET or CEP (0.3, 3, 5, 10 and 15 μM). Wells containing cell suspension treated by 10 nM of CPT were set up as positive control for apoptotic cells. After 48 h incubation at 37℃, cells were harvested and washed by PBS twice. Apoptotic rates were evaluated by using FITC Annexin V Apoptosis Detection Kit (BD PharmingenTM). The cells were subsequently classified into four groups, viable (Annexin V-/PI-), early apoptotic (Annexin V+/PI-), late apoptotic (Annexin V+/PI+) and necrotic (Annexin V-/PI+) cells, respectively, by using a flow cytometer (FACSCanto™ II, BD Biosciences, CA, US).
1.2.6 Cell cycle analysis
Jurkat T cells were seeded in 6-well plates and incubated in RPMI 1640 medium containing blank solvent, CPT (10 nM), CEP (5, 10 and 15 μM) and TET (5, 10 and 15 μM) for 48 h, respectively. Then, the cells were harvested and washed with PBS, and subsequently fixed in 70% ethanol at 4℃ for 1 h, and stained with propidium iodide (PI, 50 μg/mL, #P4864, Sigma Chemical Co.) in the presence of RNase A (0.25 mg/mL, #R5500, Sigma Chemical Co.). DNA content of cells was determined by flow cytometry (FACSCanto™ II, BD Biosciences, CA, US). Data were analyzed by ModFit LTTM
(Version 3.1, Verity Software House, Topsham, ME, USA) 1.2.7 Western blot analysis
Assay Kit (Thermo Scientific). The cell extracts were subsequently separated by SDS-polyacrylamide gel electrophoresis and then electrotransferred to hydrophobic polyvinylidene fluoride membrane (Immobilon-P; Merck Millipore, Darmstadt, Germany). The membranes were blocked with 5% skimmed milk for 1 h, and subsequently washed with Tris-buffered saline/0.1% Tween-20 (TBST). Then, the membranes were incubated with primary antibodies against individual proteins overnight at 4℃. After triple washing with TBST, the membranes were continued to incubate with secondary antibody (Anti-mouse IgG, HRP-linked, #7076, Cell Signaling Technology, Inc.) at a dilution of 1:1000 at room temperature for 1 h. After triple washing with TBST, the signals were detected with an ECL or ECL Prime Western Blotting detection kit (#RPN2109 and RPN2232, GE Healthcare) in a luminescent image analyzer (Fujifilm; LAS-3000; Fujifilm, Tokyo, Japan). The images were then quantitatively analyzed by ImageJ software (version 1.52e, National Institutes of Health, USA; http://imagej.nih.gov/ij).
1.2.8 Statistical analysis
Differences in the percentages of viable cells, early or late apoptotic cells, and cells in cell-cycle phases were analyzed with Bonferroni Multiple Comparison Tests. Statistical analyses for the expression of several proteins were performed using Dunnett's Multiple Comparison Test. These analyses were processed using GraphPad PRISM 5.0 (GraphPad Software Inc., San Diego, CA). In each case, two-sided P values <0.05 were considered to be significant.
1.3 RESULTS
1.3.1 TET and CEP inhibit the proliferation of Jurkat T cells and change the cell morphology
Camptothecin (CPT) (D)
Fig. 1-1 Effects of tetrandrine (TET) and cepharanthine (CEP) on the viability of Jurkat T cells. (A) Chemical structures of TET and CEP. (B) Jurkat T cells were treated with various concentrations (3, 5, 10, 15 μM) of TET (left) or CEP (right) for 24 h (○), 48 h (□) and 72 h (△), respectively, and the cell viability was assessed by WST-8 assay. All of the data were expressed as the mean ± S.E.M. (n=3). Asterisks indicate significant differences between the control and the drug treatment groups (*P<0.05, **P<0.01 and
***
P<0.001). (C) Morphologic change of nuclei in drug-treated Jurkat T cells. Cells were incubated with drugs for 48 h followed by Hoechst 33342 staining. Camptothecin (CPT) group was set up as a positive control. Representative result of three independent experiments was shown. Abnormal nuclei were indicated by red arrows. (D) Chemical structure of CPT.
1.3.2 TET and CEP induce apoptosis in Jurkat T cells
Fig. 1-2 Tetrandrine (TET) and cepharanthine (CEP) induce apoptosis of Jurkat T cells. (A) A dot-plot analysis of Jurkat T cells treated with TET or CEP. Cells were treated with TET or CEP and stained with Annexin V/PI, followed with detection by flow cytometer. Camptothecin (CPT) group was set up as a positive control. Cells were classified into four groups based on different quadrants: viable cells (Q3-1), early apoptotic cells (Q4-1), late apoptotic cells (Q2-1) and necrotic cells (Q1-1). (B) Viable cells decreased by treatment with TET or CEP in a dose-dependent manner. Early apoptosis (C) and late apoptosis (D) were induced by CPT, TET or CEP significantly (*P<0.05, **P<0.01 and ***P<0.001). Data represented the mean ± S.E.M. of three independent experiments.
Comparing with control group, the percentage of viable cells treated by 10 nM CPT was 42.1 ± 4.4% (mean ± SD, P<0.05, Fig. 1-2B). Both TET and CEP inhibited the cell growth dose-dependently. 15 μM of TET and CEP showed the strongest cytotoxic effects, and the mean ± SD values of viable cells were 8.4 ± 6.9 and 7.4 ± 2.4%, respectively (P<0.001, Fig. 1-2B). Consequently, the percentages of the early and the late apoptotic cells increased significantly after treating with 10 nM CPT or higher doses of TET and CEP (Fig. 1-2C-D). 1.3.3 TET and CEP regulate the expression of proteins related to caspase cascades
To furtherly investigate the mechanism underlying the TET or CEP-induced apoptosis, the expressions of proteins related to caspase cascades were examined. Complicated regulation networks were divided into apoptotic markers and anti-apoptotic factors.
μM of CEP also downregulated the expression of full length PARP significantly (P<0.05), but the cleavage type was not observed (Fig. 1-3F). Whereas, the effects of TET on full length PARP were not statistically significant (Fig. 1-3F). As shown in Fig. 3G and I, Lamin A-C and Bax were influenced by the treatment of TET or CEP, and 10 μM of TET maximally increased the expression levels of these two pro-apoptotic proteins significantly (P<0.05, Fig. 1-3G and I). Furthermore, CEP treatment stimulated the expression of p53 in a dose-dependent manner, and 15 μM of CEP significantly increased the amount of p53 (P<0.05, Fig. 1-3H). TET at 5-15 μM tended to stimulate the expression of p53, though the effects were not statistically significantly (Fig. 1-3H).
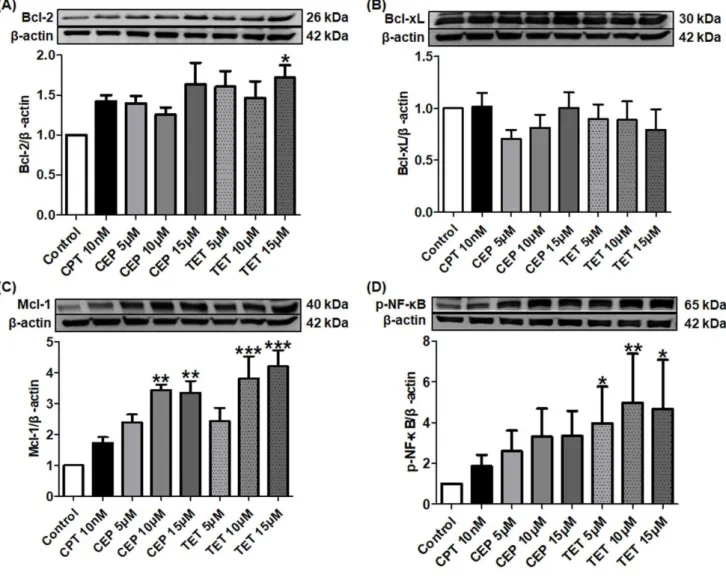
Fig. 1-3 Effects of tetrandrine (TET) and cepharanthine (CEP) on the expression levels of pro-apoptotic proteins in caspase cascades. Jurkat T cells were treated with different concentrations of TET or CEP (5, 10 and 15 μM) and camptothecin (CPT, 10 nM) for 72 h. The cell lysates were examined by Western blot. More than three independent experiments were carried out and representative results were shown. β-actin was used as internal control. Asterisks indicate significant differences between the control and the drug treatment groups. (*P<0.05 and **P<0.01)
Fig. 1-5 Tetrandrine (TET) and cepharanthine (CEP) triggers cell cycle in Jurkat T cells.
(A) Cells were treated with serial concentration of TET and CEP (5, 10 and 15 μM) for 48 h,
respectively. 10 nM of
camptothecin (CPT) was used as a positive control. The peaks marked in the figure represent G0/G1, S and G2/M phases in the cell cycle, respectively.
(B) Percentages of cell numbers in the cell cycle after 48 h of the agent treatment. All data were expressed as the mean ± S.E.M. of three independent experiments.
Asterisks indicate significant differences between the control and the drug treatment groups. (*P<0.05,
**
P<0.01 and ***P<0.001) 1.3.4 TET and CEP trigger the cell cycle arrest in Jurkat T cells
To evaluate whether TET or CEP mediated inhibition of cell growth correlated with cell cycle arrest, Jurkat T cells were treated with serial concentrations of TET or CEP (5, 10 and 15 μM). As shown in Fig. 1-5A-B, 10 nM of CPT as a positive control, largely increased cell population at S phase (P<0.001), followed with a significant decrease of cell population at G0/G1 phase (P<0.001). Interestingly, TET or CEP showed similar results that they
triggered cell cycle arrest and leaded the cell growth to stop at S phase in a dose-dependent manner, and thus decreasing the percentage of cells at G0/G1 phase. None of these three
1.3.5 TET and CEP regulate the expression of cell cycle-related proteins
We continued to examine the influences of TET and CEP on cell cycle-related proteins. As shown in Fig. 1-6B, 10 nM of CPT significantly increased the expression level of cyclin B1 (P<0.01), and TET or CEP showed the similar regulation effect in a dose-dependent manner. All of these three drugs enhanced the expression of cyclin A2, and 15 μM of TET showed the strongest efficacy (P<0.05, Fig. 1-6A). In contrast, cyclin D1 protein expression was effectively downregulated by TET or CEP (Fig. 1-6C).
1.3.6 TET and CEP activate MAPK
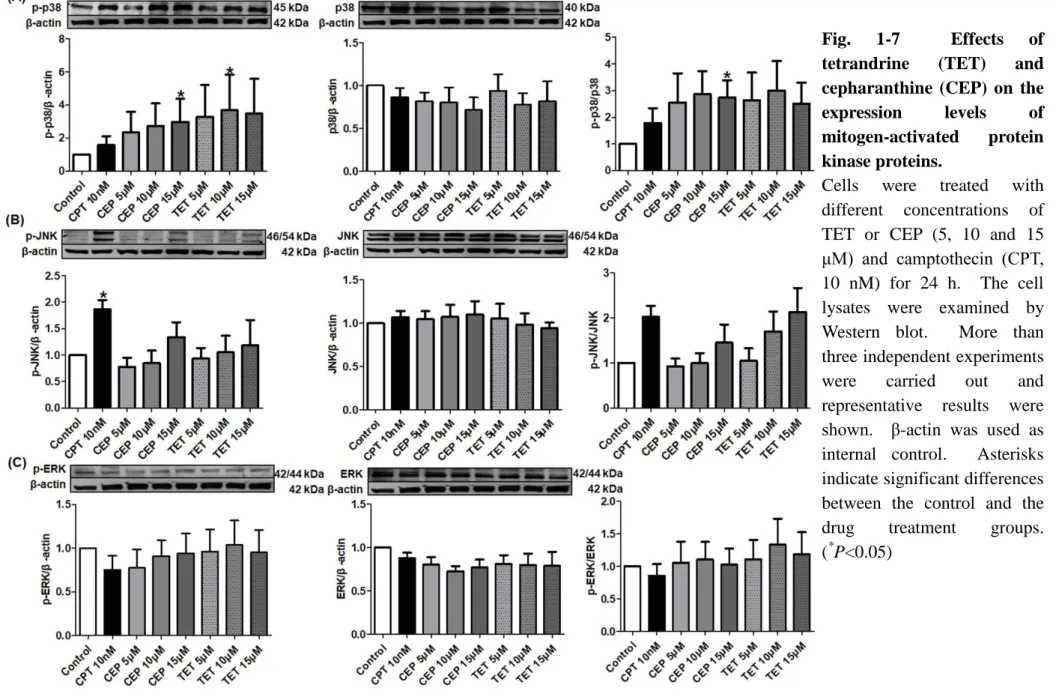
MAPK activation maintains the proliferation of T cells. To investigate the molecular basis for the effects of TET and CEP on Jurkat cell growth, I examined the influence of TET or CEP on MAPK activation. As shown in Fig 1-7A, both TET and CEP apparently stimulated the phosphorylation of p38 in a dose-dependent manner. 15 μM of CEP changed the ratio of p-p38 and p38 significantly (P<0.05). As shown in Fig. 1-7B, 10 nM of CPT significantly increased the expression of p-JNK (P<0.05), and TET or CEP also tended to activate the p-JNK dose-dependently, though the effects were not significant. However, none of these three drugs significantly influenced the expression of p-ERK (Fig. 1-7C). 1.3.7 TET and CEP modify PI3K/Akt/mTOR signaling pathway
Fig. 1-6 Effects of tetrandrine (TET) and cepharanthine (CEP) on cell cycle regulators in Jurkat T cells. Cells were treated with different concentrations of TET or CEP (5, 10 and 15 μM) and camptothecin (CPT, 10 nM) for 72 h. The cell lysates were examined by Western blot. More than three independent experiments were carried out, and representative results were shown. β-actin was used as internal control. Asterisks indicate significant differences between the control and the drug treatment groups. (*P<0.05)
Fig. 1-7 Effects of tetrandrine (TET) and cepharanthine (CEP) on the
expression levels of
mitogen-activated protein kinase proteins.
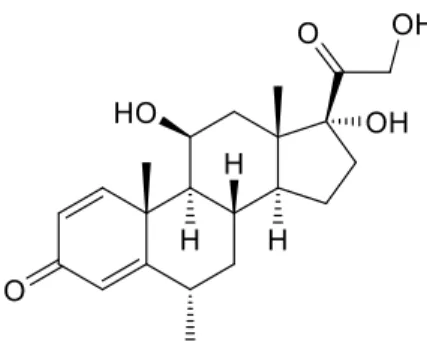
1.3.8 Synergic effect of steroid combined with TET or CEP on Jurkat T cell proliferation Glucocorticoids (GCs) are among the first drug classes used in the treatment of patients with ALL, and are still essential components of treatment. Then, I examined the inhibitory effects of the combination of GC and TET or CEP. Methylprednisolone (MP) is one of the typical GCs, and thus MP (Fig. 1-9) was used in my following study.
Fig. 1-9 Chemical structure of methylprednisolone (MP)
As shown in Fig. 1-10, low concentration of MP potentiated the anti-T-ALL effects of TET or CEP. Although MP alone showed little cytotoxicity on Jurkat T cells, ng/mL grade of MP decreased the IC50 values of TET and CEP dose-dependently and significantly. The
Fig. 1-10 Methylprednisolone (MP) potentiates inhibitory effect of tetrandrine (TET) or cepharanthine (CEP) on Jurkat T cells. Jurkat T cells were treated with various concentrations (3, 5, 10 μM) of TET (A-C) or CEP (D-F) with or without methylprednisolone (MP) for 48 h, and the cell viability was assessed by WST-8 assay. IC50 values of TET (B)
and CEP (E) were calculated by GraphPad Prism 5.0. The Combination Index for the effect of TET (C) or CEP (F) combined with MP was calculated using CompuSyn software. All of the data were expressed as the mean ± S.E.M. (n=4). Asterisks indicate significant differences between the control and the drug treatment groups (*P<0.05, **P<0.01 and
***
P<0.001).
1.4 DISCUSSION
Despite of the treatment by high-dose antileukemic drugs and improved supportive care, the prognosis of patients with glucocorticoid resistant T‑ALL who fail to obtain a complete hematological remission or those whose disease relapses after a transient initial response remains poor [4, 5]. Moreover, these aggressive treatment regimens are often associated with severe acute toxicities and long-term side effects, especially, for pediatric T-ALL [7]. Faced with these clinical challenges, it is urgent to develop more effective and less toxic drugs for T-ALL.
Bisbenzylisoquinoline alkaloids TET and CEP (Fig. 1-1A) isolated from traditional herbs are commercially distributed in China and Japan for more than 20 years respectively, which certifies the safety of these two compounds. Meanwhile, with the advantage of high tolerance, TET has been registered as CBT-1® in USA and was studied in the clinical trials in association with doxorubicin for treating patients with advanced solid tumors [33]. Recent numerous molecular investigations for the efficacy of TET and CEP firmly support that they would be suitable candidates for anti-cancer drugs [34-37]. However, fewer studies are designed to examine the underlying action mechanisms of TET or CEP for their anti-T-ALL effects. Therefore, the present study was performed to investigate the cytotoxic effects of TET and CEP by using the steroid resistant human leukemia Jurkat T cell line.
Annexin‑V and PI staining (Fig. 1-2B). Images obtained from fluorescence microscopy revealed that the cell morphology was largely changed to show karyorrhexis, chromatin condensation and fragmentation (Fig. 1-1C), which indicated that cell apoptosis seriously occurred. This finding was also certified by the results of apoptosis analysis shown in Fig. 1-2C and D. Both TET and CEP showed cytotoxic effect on Jurkat T cells by inducing apoptosis, which were consistent with the observations of previous reports [38, 39].
Caspase cascades are pivotal components of apoptosis. To date, two types of caspases, the initiator caspase and effector/executioner caspase, have been defined [40]. I showed that TET or CEP not only upregulated the expression of initiator caspases such as caspase-8 and 9 (Fig. 1-3D and E), but also increased the expression of effector caspases such as caspase-3 and 6 (Fig. 1-3A and B). Moreover, Jianghong Wu et al. reported that 24 h treatment with 10 μM CEP activated the caspase-3/8/9, which leads to increase in cleaved products of these caspases in Jurkat T cells [39]. After Jurkat T cells were treated with 30 μM TET for 12 h, the amount of cleaved caspase-3 in these cells was reported to increase significantly [41]. All these findings suggested that caspases contributed to the apoptotic effect of TET or CEP. However, TET or CEP seemed to show little effect on caspase-7, another important effector caspase, suggesting that caspase-7 was not the main target of TET or CEP (Fig. 1-3C).
activated by caspase-6, are nuclear membrane structural components, and are important in maintaining normal cell functions such as cell cycle control, DNA replication, chromatin organization and apoptosis [44-46]. TET or CEP upregulated the expression of lamin A/C, which was consistent with the largely changed morphology of Jurkat T cells treated by these agents (Fig. 1-1C). DNA damage leads to high response of tumor suppressor p53 [47]. Subsequently, p53 induces a large number of apoptotic genes that are associated with various steps of apoptosis [48]. The present study revealed that both TET and CEP largely increased the expression amounts of p53, whereas CPT showed a slight effect (Fig. 1-3H). Bax is one of the members of Bcl-2 family, which induces apoptosis through mitochondrial stress [49-51]. TET or CEP strongly stimulated Bax expression at 5 and 10 μM, while they decreased the expression at 15 μM (Fig. 1-3I). Excessive stimulation of p-Akt1 by 15 μM TET or CEP, as shown in Fig. 8B, may account for the paradoxical results, since Akt inhibits a conformational change in the pro-apoptotic Bax protein and its translocation into mitochondria [52].
or HOXA-positive primary T-ALLs sensitively [57, 58]. Combination of TET or CEP and ABT-199 would be meaningful to overcome the anti-apoptotic effects of higher Bcl-2 expression induced by TET or CEP, although Bcl-2 did not appear to affect prognosis in ALL [57, 59]. Mcl-1 is another crucial pro-survival factor, and overexpressing Mcl-1 may relate to chemo-resistance in leukemia cells [60]. Protein kinase inhibitor H89 was reported to show a synergic anti-cancer effect with TET by modulating Mcl-1 expression [61].
Development of T-ALL is also known to be resulted from the loss of cell cycle control [5]. Cyclin D overexpression is commonly seen in human T-ALL, and specific cyclin D expression is associated with distinct T-ALL subsets [62]. Thus, as like the most common human tumors, cell cycle arrest would be an important way to regulate T-ALL cell growth and proliferation [63]. In the present study, I found that all of the three agents largely arrested the cell cycle progression at S phase in a dose-dependent manner, following with a significant decrease of cell population at G0/G1 phase (Fig. 1-5A-B). S phase is a crucial event in the cell cycle that allows proper replication of DNA without accumulating genetic abnormalities [64]. Topoisomerase Ⅰ relaxes the DNA supercoil form during the DNA replication process, and I showed that CPT significantly inhibited the expression of topoisomerase Ⅰ in Jurkat T cells (data not shown). My present data suggested that CPT caused DNA damage and activated the cell cycle checkpoint with a cell cycle arrest at S phase, as has been suggested by other researchers [65]. In contrast, TET or CEP, sharing similar arresting-effect on cell cycle with that of CPT, did not influence the expression of topoisomerase Ⅰ in Jurkat T cell nucleus (data not shown). As we have known, transition from one cell cycle phase to another occurs in an orderly fashion and is regulated by different cellular proteins, such as cyclin A/B/D [66]. Further investigation revealed that both CPT and TET or CEP upregulated the expressions of cyclin A2 and B1 but downregulated the expression of cyclin D1, which might contribute to their similar effect on cell cycle arrest (Fig. 1-6A-C).
is required for the proliferation of CD8 T cells activated in the absence of co-stimulation [69]. Unlike the normal T cells, activated MAPK may contribute to the apoptotic process of malignant Jurkat T cells. As shown in Fig. 1-7A, p38 was activated by the treatment with TET or CEP apparently and dose-dependently, which was accompanied by the induction of apoptosis. This finding was consistent with that of the previous study [70]. Comparing with TET or CEP, 10 nM of CPT strongly stimulated the phosphorylation of JNK (Fig. 1-7B). It was reported that JNK mediates phosphorylation of anti-apoptotic proteins Bcl-2/Bcl-xL, which changes the mitochondrial membrane potential to release cytochrome c. Then, caspase-9 is activated following with caspase-3 activation. Finally, JNK sensitizes cancer cells to genotoxic stress-induced cell death [71]. However, all of the three agents rarely influenced on the activation of ERK (Fig. 1-7C).
to further characterize the role of TET and CEP on the complex relationship between PI3K and AKT in cancer.
TET and CEP share the same bisbenzylisoquinoline skeletons and thus both of them show similar efficacy on the above multiple targets. Whereas, the steric configurations and substituent groups of TET and CEP are largely different. Subsequently, I observed different influences of TET and CEP on the signal proteins caspase-3/8, cyclin A2/B1 and mTOR. However, I still can preliminarily infer that the steric configuration of the two benzylisouinoline units will not affect the cytotoxicity of bisbenzylisoquinoline alkaloid on glucocorticoid resistant human leukemia Jurkat T cells, because I did not observe any contradictory effects of TET and CEP, although they share the opposite steric configurations. The structure-activity relationship of bisbenzylisoquinoline skeletons deserves to be explored comprehensively in the future.
There are still a lot of other important questions which remain to be answered. As I have mentioned, several different molecular mechanisms contribute to GC resistance. Indeed, many kinds of GC resistant T-ALL cell lines such as Jurkat, MOLT-4 and CEM MTX-R3 cells have been known. My examination in this Chapter limited to the cytotoxic effects of TET and CEP in Jurkat T cells only, and thus how TET or CEP influences the viability of other GC resistant T-ALL cells is remained to be studied in the future. In Japan, CEP is usually used for the treatment of leukocytopenia caused by radiation, which seems to be paradoxical with my findings. Therefore, the influence of radiation on cell physiology and molecular mechanisms of the therapeutic efficacy of CEP on leukocytopenia are the next problems to be elucidated. Cytotoxicity of TET and CEP on normal cells is also necessary to be addressed in the future.
potentiates the cytotoxic effects of TET or CEP on Jurkat T cells (data not shown). Therefore, inhibitory effect of MP on NF-B may help us to explain this synergic effect of the combination. However, other anti-leukemic drugs such as methotrexate, vincristine, THP-adriamycin, cyclophosphamide, L-asparaginase, cytarabine and mercaptopurine are inevitably recommended to the patients with T-ALL according to the Japanese Clinical Guidelines for Childhood Leukemia and Lymphoma in 2016 [6]. How does TET or CEP influence the pharmacodynamics of the above-mentioned chemotherapeutic drugs? This point remains to be disclosed in the future.
Because a considerable number of patients with chronic inflammatory or autoimmune diseases show a poor or absent response even to high doses of GCs, the GC resistance or insensitivity represents an important barrier for the effective treatment of these patients [14]. Therefore, combination of MP and TET or CEP could be a new therapeutic approach for GC resistant patients. In Chapters 2 and 3, I continued to examine the synergic effects and the possible mechanisms of these combinations on human T cells.
1.5 CONCLUSION
Chapter 2
Tetrandrine potentiates the steroid pharmacodynamics in
mitogen-activated peripheral blood mononuclear cells of healthy subjects
2.1 INTRODUCTION
As mentioned in Chapter 1, Boui derived bisbenzylisoquinoline alkaloid TET showed significant inhibitory effect on a GC resistant human Jurkat T cell line. Moreover, synergic effect of MP and TET or CEP was observed. It is highly possible to use the combination of MP and TET or CEP to enhance the immunosuppressive effect of GC to overcome GC resistance.
Lots of our studies have certified individual variations of GC efficacy in patients of bronchial asthma [76], minimal change nephrotic syndrome [77], ulcerative colitis [78] and other kinds of inflammatory or immunological diseases [15]. Since a considerable number of patients with these chronic inflammatory or autoimmune diseases show a poor or absent response even to high doses of GCs, the GC resistance or insensitivity represents an important barrier for the effective treatment of these patients [14]. New therapeutic approaches to increase the GC sensitivity are thus urgent to be developed for GC resistant patients.
Then, in this Chapter, the synergic immunosuppressive effect of TET with MP was investigated by using the human peripheral blood mononuclear cell (PBMC) culture system, and I also explored its possible action mechanisms with focus on P-glycoprotein, MAPK, and GC receptor (GR) signaling pathways.
2.2 MATERIALS AND METHODS 2.2.1 Drugs and reagents
(purity: more than 98%) and verapamil were purchased from Sigma Aldrich (St. Louis. Mo., USA). TET was dissolved in ethanol at a concentration of 15 mM, filtered through a 0.2 μm membrane filter (Advantec Co., Japan), and diluted to 150 μM stock solution in ethanol and then stored at 4℃ until use. The working concentrations were prepared by dilution with ethanol. MP was provided from Sigma Aldrich (St. Louis. Mo., USA), dissolved in ethanol and then stored at 4℃ until use. The cell proliferation WST-8 assay kits were obtained from Dojindo Molecular Technologies, Inc., Japan. BD Cytometric Bead Array (CBA) Human Th1/ Th2/Th17 Cytokine Kit, Alexa Fluor® 488 Mouse anti-human Foxp3, FITC mouse anti-human CD4, and APC Mouse Anti-Human CD8 and CD25 were obtained from BD Biosciences, San Jose, CA, USA. GR antibody (G-5) was provided by Santa Cruz Biotechnology, INC (dilution 1:1000, # sc-393232). β-actin was purchased from Proteintech Group (dilution 1:5000, # 66009-1-Ig). All other reagents were of the highest quality available from commercial vendors.
2.2.2 Subjects
The present study was carried out in accordance with The Code of Ethics of the World Medical Association (Declaration of Helsinki). The study was approved by the Ethical Committee of Tokyo University of Pharmacy and Life Sciences and written informed consent was obtained from all healthy subjects included in the study. The study included 9 healthy subjects (4 males and 5 females with a mean age of 34.4 years). These subjects had neither a history of immunological disorders nor a history of taking immunosuppressive drugs including steroids.
2.2.3 Isolation of PBMCs and evaluation of drug effects in vitro
min. PBMCs were separated and suspended with RPMI 1640 medium containing 10% FBS, 100,000 IU/L penicillin G sodium salt and 100 mg/L streptomycin sulfate to a final density of 1 × 10⁶ cells/mL. 194 μL of this cell suspension were loaded into wells of a 96-well plate. Con A as a T-cell mitogen was added to each well to a final concentration of 5.0 μg/mL. Subsequently, 2 μL of an ethanol solution containing MP were added to give final concentrations of 0.05, 0.5, 5, and 50 ng/mL. To examine the additional effect of TET combined with MP, 4 μl of an ethanol solution containing TET were subsequently added to give final concentrations of 0.3, 3, 30 and 300 nM, respectively. Six microliters of ethanol were added to the control wells. The plate was incubated for 96 h in 5% CO2 at 37℃.
After the culture, 10 μL of WST-8 assay reagent solution were added to each well, and the plate was incubated for another 3 h. The optical density value was measured at 450 nm
absorbance (ref. 650 nm). PBMC proliferation was calculated by
(Test-Blank)/(Control-Blank)×100%. IC50 values of MP were obtained by GraphPad Prism
5.
2.2.4 Functional assays for P-glycoprotein
P-glycoprotein function of PBMCs was measured by Rhodamine (Rh) 123 efflux assay using flow cytometry. In brief, 0.5 mL of the cell suspension containing 1 × 10⁶ cells/mL prepared as above were loaded with Rh123 to yield a final concentration of 2 μM and incubated for 10 min in 5% CO2 at 37℃. After the accumulation period of 10 min, the cells
re-suspended in PBS and kept on ice in the dark until analysis by FACSCanto ™ II (BD Biosciences, San Jose, CA).
2.2.5 Quantification of human cytokines
PBMCs were incubated for 96 h in the presence of Con A, TET and MP together or respectively as described above, and the culture supernatant was stored at −80℃ until measurement of cytokine concentrations. The concentrations of interferon (IFN)-γ, TNF-α, IL-2, -4, -6, -10 and -17 in the culture supernatant were measured with beads-array procedures using the Human Th1/Th2/Th17 Cytokine Kit, followed by flow cytometry, according to the instructions of BD Biosciences (San Jose, CA). The data were analyzed using BD™ Cytometric Bead Array (CBA) FCAP Array Software.
2.2.6 CD4+ CD25+ Foxp3+ T cell analysis
The data were analyzed with FACSCanto ™ II (BD Biosciences), using BD FACSDiva™ software. CD4+
cells in the lymphocyte fraction were gated, and the percentages of CD4+ CD25+ Foxp3+ cells in the CD4+ cell fraction were calculated
2.2.7 Assessment of phosphorylation of MAPK isoforms
Phosphorylation of ERK1/2, P38 and JNK as indicative of mitogen-activated protein kinase (MAPK) were determined by Cell Lysates ELISA kits (Ray Biotech Inc, USA) according to each manufacturer’s instruction. Briefly, 1.288 ml of 1 × 10⁶ cells/mL PBMC suspension were seeded and pre-treated with or without TET (final concentration of 3 or 3000 nM) for 2h. Then, 14 μL of an ethanol solution containing MP were added to give a final concentration of 0.5 ng/mL. In order to activate T cells and phosphorylate MAPK in these cells, 70 μL of Con A solution was added to yield a final concentration of 21 μg/mL. Subsequently, cells were incubated in 5% CO2 at 37℃ for 5 or 15 min. A control cell
population was cultured in the medium without drugs. Cells were lysed in 128.8 μL of cell lysis buffer, and then microcentrifuged at 4℃. The supernatants were obtained and diluted 10 folds. The cell lysates were incubated with rabbit anti total and phosphorylated P38 (p-P38), ERK1/2 (p-ERK1/2), or JNK (p-JNK), followed by incubation with HRP-conjugated anti-rabbit IgG or streptavidin. Finally, 3, 3’, 5, 5’–tetramethylbenzidine was added, followed by addition of stop solution, and the optical density was read at 450 nm. The cells treated by the drugs for 5 min were used to examine ERK1/2 and P38, and the cells treated for 15 min were used for JNK analysis.
2.2.8 MOLT-4 and MOLT-4/DNR cell culture
2.2.9 Western blot analysis
MOLT-4 and MOLT-4/DNR T cells were treated with TET and MP for 1 h. Cytoplasmic and nuclear proteins were extracted using the Thermo Scientific NE-PER Nuclear and Cytoplasmic Extraction Reagents (Pierce Biotechnology, Rockford, IL, USA) according to manufacturer’s instruction. Protein concentration was quantified by Pierce BCA Protein Assay Kit (Thermo Scientific). Cytoplasmic and nuclear extracts were subsequently separated by SDS-polyacrylamide gel electrophoresis and then electrotransferred to hydrophobic polyvinylidene fluoride membrane (Immobilon-P; Merck Millipore, Darmstadt, Germany). The membranes were subsequently blocked with 5% skimmed milk for 1 h and washed with Tris-buffered saline/0.1% Tween-20 (TBST). Then, the membranes were incubated with primary antibodies against individual proteins overnight at 4℃. After washing three times with TBST, the membranes were continued to incubate with secondary antibody (Anti-mouse IgG, HRP-linked, #7076, Cell Signaling Technology, Inc.) at a dilution of 1:1000 at room temperature for 1 h. After washing three times with TBST, the signals were detected with an ECL or ECL Prime Western Blotting detection kit (GE Healthcare) in a luminescent image analyzer (Fujifilm; LAS-3000; Fujifilm, Tokyo, Japan). The images were quantitatively analyzed by ImageJ software (version 1.52e, National Institutes of Health, USA; http://imagej.nih.gov/ij).
2.2.10 Statistical analysis
Differences in the percentages of PBMC proliferations, IC50 values of drugs, Rh 123
Bonferroni multiple comparison tests. Statistical analyses for the differences of GR expression amounts in MOLT-4 or MOLT-4/DNR cells between the cells treated by MP alone and those treated with MP combined with TET were carried out by Mann-Whitney test. These analyses were performed with GraphPad PRISM 5.0. In each case, two-sided P values <0.05 were considered to be significant.
2.3 RESULTS
2.3.1 Effects of MP combined with TET on mitogen-activated proliferation of PBMCs I first examined the effects of MP in the presence or absence of TET on cell proliferation of PBMCs activated with a T-cell mitogen, Con A, in vitro. The PBMCs obtained from healthy subjects were cultured in the presence of Con A and serial concentrations of MP with or without TET for 96 h, and the proliferative response of the PBMCs was estimated by WST assay procedures(Fig. 2-1A). MP dose-dependently inhibited the PBMC proliferation, and TET significantly potentiated the suppressive effects of MP at doses of 0.05 and 0.5 ng/ml as shown in Fig. 2-1A (P<0.05). The mean (S.E.M.) of MP IC50 values was 3.57 (0.61) ng/ml,
whereas the mean (S.D.) IC50 values of MP combined with 0.3, 3, 30, and 300 nM TET were
Fig. 2-1 Effects of methylprednisolone (MP) in the presence or absence of tetrandrine (TET) on proliferation of PBMCs activated with concanavalin A. Cell proliferation was determined by WST-8 assay. PBMC proliferation (%) was estimated from the formula (Test-Blank)/(Control-Blank)×100%. IC50 values were calculated by GraphPad Prism 5.
(A) Inhibition of PBMC proliferation by MP combined with TET. (B) IC50 values of MP in
the presence or absence of TET. The data were expressed as means ± S.E.M. Statistical analyses were performed using Bonferroni’s multiple comparison tests, *
P<0.05, **P<0.01 and
***
P<0.001, as compared to the group treated by MP alone. (n=7)
2.3.2 Effects of TET combined with MP on P-glycoprotein function of PBMCs
Fig. 2-2 Rhodamine 123 (Rh123) accumulation in PBMCs by tetrandrine (TET). PBMCs were incubated with 2 μM Rh123 for 10 min to uptake the fluorescent dye. Subsequently, the cells were washed and cultured for 180 min with or without drugs to efflux intracellular dye. (A) Effects of TET as compared with verapamil, the prototype P-glycoprotein blocker, on P-glycoprotein function of peripheral lymphocytes. PBMCs were incubated with 3, 30, 300 nM and 3μM of TET for the efflux period, and the Rh123 accumulation was measured by flow cytometry. (B) P-glycoprotein inhibitory effect of TET in the presence of MP. Rh123 mean fluorescence intensities were detected by flow cytometry analysis, and Rh123 accumulated (%) was calculated by the formula: Dye accumulated/Dye uptaken × 100 (%). The results were expressed as means ± S.E.M. Statistical analyses were performed using Bonferroni’s multiple comparison tests. *
P<0.05,
**
P<0.01 and ***P<0.001, as compared to the group without drugs. #P<0.05, ##P<0.01 and
###
P<0.001, as compared to the group treated with MP alone. (n=3)
2.3.3 Effects of MP combined with TET on cytokine production from mitogen-activated PBMCs
Fig. 2-3 Cytokine concentrations in the supernatant of T-cell mitogen-activated PBMCs treated with tetrandrine (TET) and/or methylprednisolone (MP).
PBMCs were stimulated with concanavalin A (Con A) for 96 h in the absence or presence of TET (0.3, 3, 30 and 300 nM) and/or MP (0.05 and 0.5 ng/mL). Then the culture supernatant was analyzed for concentrations of TNF-α and IL-6 using beads-array procedures followed by flow cytometry. Averaged results obtained using PBMCs from 7 healthy subjects were shown (± S.E.M.). Statistical analyses were performed using Wilcoxon matched-pairs signed rank tests to analyze the differences between each group.
2.3.4 Effects of MP combined with TET on the frequency of CD4+ CD25+ Foxp3+ T cells in mitogen-activated PBMCs
Fig. 2-4 Flow cytometric analysis of CD4+ CD25+ Foxp3+ T cells in concanavalin A-stimulated PBMCs treated with tetrandrine (TET) and/or methylprednisolone (MP). PBMCs were treated with serial concentrations of the drugs for 96 h, and then analyzed with flow cytometry, as described in Materials and Methods. The data were indicated as the mean ± S.E.M. Statistically significant changes as compared to PBMCs treated with concanavalin A without drugs were not observed using Wilcoxon matched-pairs signed rank tests. (n=3) 2.3.5 Effect of MP combined with TET on phosphorylation of MAPK isoforms in mitogen-activated PBMCs
The effects of MP in the presence or absence of TET on the activation of cellular ERK1/2, P38 and JNK in PBMCs stimulated with Con A were examined (Fig. 2-5). The relative phosphorylation of ERK1/2 and P38 increased by the stimulation with Con A for 5 min. MP at 0.5 ng/mL tended to repress the ERK1/2 activity. Meanwhile, 3 μM of TET suppressed ERK1/2 phosphorylation, though the effect was not statistically significant (Fig. 2-5A). The synergic inhibitory effect by the combination of MP (0.5 ng/ml) with TET (3 μM) was observed significantly (P<0.05) when compared with the group treated by MP alone. Similarly, the tendency of synergic suppressing effect on P38 was observed by the same combination of MP with TET, though the effect was not statistically significant. (Fig. 2-5B). On the other hand, Con A did not stimulate significantly the phosphorylation of JNK by 15 min (data not shown).
against p-ERK1/2 (A) and p-P38 (B), respectively. Other treatments were followed as described in Materials and Methods. The results were expressed by mean ± S.E.M. of relative phosphorylation (-folds). Statistical analyses were performed using Bonferroni’s multiple comparison tests, *P<0.05 and **P<0.01, as compared to each control. (n=3)
2.3.6 Effect of MP combined with TET on the translocation of GR
Fig. 2-6 Effect of methylprednisolone (MP) in the presence or absence of tetrandrine (TET) on the translocation of glucocorticoid receptor (GR) in MOLT-4 and MOLT-4/DNR T
cells. MOLT-4 (A) and P-glycoprotein positive
MOLT-4/DNR (B) T cells were treated with MP with or without TET for 48 h. Cell viability was assessed by WST-8 assay. (C-E)
Cells were treated by MP (5 ng/mL) with or without TET (300 nM) for 1 h. Total GR in nuclear (C) and cytoplasmic (D) extracts were analyzed by Western blot. (E) Distribution (rate) of GR in nuclear/cytoplasmic fractions. HDAC-1 and β-actin were used as controls for nuclear protein extracts and cytoplasmic extracts, respectively. Data represented the mean ± S.E.M. of six independent experiments. Statistical analyses of the control and the drug treatment groups were performed using Bonferroni's multiple comparison tests (*P <0.05,
**
2.4 DISCUSSION
Comparing with isolated T cells, PBMCs were much closer to the human immune network in vivo. Although IL-2 or anti-CD3 antibody largely stimulates T cell growth in PBMCs, the pharmacological parameters of immunosuppressive drugs in vitro were significantly correlated with the clinical efficacy of these drugs in Con A-stimulated PBMC culture system according to the previous reports [15, 76, 80]. Therefore, I used Con A as a stimulant of PBMCs with an aim to obtain clinically applicable information of TET combined with MP. Thus, in this Chapter, Con A mitogen-activated PBMC culture procedure was chosen to examine the TET potential combined with GC. It has been reported that 3 μM of TET effectively suppresses proliferation of T cells stimulated with phorbol 12-myristate 13-acetate and anti CD28 antibody [18, 81]. Here, I showed that TET, even at the lowest concentration of 0.3 nM, increased the anti-proliferative effect of MP in the mitogen-activated PBMCs, and thus decreased the IC50 value of MP significantly (Fig. 2-2B). Actually, TET
itself (≤300 nM) showed no toxic effect on the ability of PBMCs to proliferate in response to a T-cell mitogen, Con A (Fig. 2-2A). It would be a novel finding that the nM level of TET potentiates the anti-proliferative efficacy of MP on T cell mitogen-activated human PBMCs.
on the cell surface resulted in efflux of GC molecule out of the cells, decreased number of GC molecules in cytoplasm of T cells, and therefore impaired the GR translocation. This hypothesis was subsequently confirmed by the Western blot analyses of P-glycoprotein negative MOLT-4 and P-glycoprotein positive MOLT-4/DNR T cells treated by MP with or without TET as shown in Fig 2-6. Accordingly, the efficient suppression of P-glycoprotein function on the cell surface might potentiate the GC effects. Indeed, 300 nM of TET significantly potentiated the inhibitory activity of extremely low concentrations (0.05 and 0.5 ng/mL) of MP on T-cell proliferation (Fig. 2-1A). According to a preliminary report, the maximum blood concentration of TET after intake of 40 mg TET could be reached to 17 μM in healthy male subjects [88]. Therefore, this concentration (300 nM) of TET to suppress P-glycoprotein function in the activated T cells could be easily obtained clinically without risks of side effects.
of TET on the production of these inflammatory cytokines were beneficial for the anti-proliferative efficacy of GCs on the activated immune cells, especially T cells. In addition to T cells, monocytes, macrophages, and dendritic cells might also be suppressed their function by TET. How dose TET influence the proliferation of these immune cells, as well as possibly B cells or NK cells? These important points are worthy to be disclosed in the future.
CD4+ CD25+ Foxp3+ T cells were usually recognized as Treg cells, which are suggested to inhibit proliferation of immune cells. Some immunosuppressive drugs such as methotrexate inhibit proliferation of lymphocytes by increasing partially the number of CD4+ CD25+ Foxp3+ Treg cells [90]. On the other hand, human CD4+ CD25+ Foxp3+ T cells were reported to exhibit effector/memory phenotypes without any regulatory/suppressor function [91, 92]. Although the function of human Treg cells is still a big controversy, I examined the effects of the drug combination on the expression of CD4+ CD25+ Foxp3+ T cells. Either TET or combination of TET and MP did not increase but rather decreased the percentage of CD4+ CD25+ Foxp3+/CD4+ cells (Fig. 2-4). This result was also consistent with the effect of TET to decrease the Treg related cytokine IL-10 production (data not shown).
consistent with my results of the PBMC proliferation assay shown in Fig.2-1. As mentioned above, IL-6 secretion was inhibited by TET and/or MP, which means that IL-6/ERK1/2 cascade can be the other possible action target for TET to potentiate the MP efficacy, since IL-6 was reported to stimulate phosphorylation of ERK1/2 [97].
The results obtained by use of PBMCs revealed a strong relationship between the inhibitory efficacy of TET on P-glycoprotein function and the antiproliferative synergic effect of TET combined with MP. To confirm the influence of TET on the GR translocation via inhibition of P-glycoprotein efflux function, MOLT-4 and MOLT-4/DNR T cells were treated by MP with or without TET, as I showed in Fig. 2-6. Compared with the parent MOLT-4 cells, MOLT-4/DNR T cells expressed larger number of P-glycoprotein and MDR-1 gene as we reported before [79]. The present data suggested that highly expressed P-glycoprotein impaired the GR translocation into nuclei in MOLT-4/DNR T cells, as compared to the parent MOLT-4 T cells. The impaired GR translocation in MOLT-4/DNR T cells was recovered by TET. This theory was consistent with the data of cell proliferation as shown in Fig. 2-6A and B. TET showed little influence on the MP pharmacodynamics on MOLT-4 T cell proliferation, whereas TET dose-dependently enhanced the inhibitory effect of MP on MOLT-4/DNR T cells expressing high amount of P-glycoprotein on the cell membrane.
2.5 CONCLUSION
TET decreased the IC50 value of MP, while it showed little toxic effect on the Con
Chapter 3
Immunosuppressive efficacy of tetrandrine combined with
methylprednisolone against mitogen-activated peripheral blood
mononuclear cells of hemodialysis patients
3.1 INTRODUCTION
According to our previous research, a significantly large population of dialysis patients (26.2%), when compared with the healthy subjects (4.1%), showed a marked decrease in lymphocyte response to the suppressive effects of prednisolone [80]. It is worthy to develop new therapeutic approaches, which can decrease the doses, and therefore adverse effects, of GCs and other immunosuppressive drugs for renal transplant recipients.
As shown in Chapter 2, TET potentiated immunosuppressive effects of MP through P-glycoprotein/MAPK/GR signaling pathway in PBMCs of healthy subjects. Considering the characteristics of T lymphocytes of renal transplant recipients, it is necessary to confirm the synergic effect of TET and MP in PBMCs of hemodialysis patients.
Thus, in this Chapter, the synergic immunosuppressive effects of TET with MP were examined in T cell mitogen-activated PBMCs of hemodialysis patients, and the drug efficacy in vitro was related to the clinical parameters of the patients.
3.2 MATERIALS AND METHODS 3.2.1 Drugs and reagents
3.2.2 Subjects
The study was conducted in accordance with the Declaration of Helsinki and was approved by the institutional ethics committee for studies in human in both Keiyu Hospital and Tokyo University of Pharmacy and Life Sciences. All hemodialysis patients (three females and ten males with the age of 67.69 ± 15.06) and healthy subjects (six females and five males with the age of 31.64±13.37) gave their written informed consent for blood donation. Healthy subjects had neither a history of immunological disorders nor a history of taking immunosuppressive drugs including steroids. Basic characteristics of the patients including gender, age, duration of hemodialysis, white blood cell counts, C-reactive protein concentration, and serum creatinine concentration were shown in Table 1.
3.2.3 Preparation of PBMCs
Table 1. Characteristics and laboratory data of the hemodialysis patients
Case Gender Age Duration of
hemodialysis (years) WBC CRP CRE
Stimulation index† 1 M 86 0 5300 0.62 3.86 3.85 2 M 71 0 6200 0.01 9.18 1.77 3 F 83 0.75 5500 0.51 4.48 2.05 4 M 62 1 6800 0.42 15.74 1.60 5 M 86 2 7600 1.05 6.42 1.95 6 M 77 1 5300 0.05 5.69 1.20 7 M 71 7 6800 0.44 11.91 1.54 8 F 79 7 4300 0.05 8.53 4.24 9 F 66 0 8600 0.24 8.13 1.49 10 M 49 0 9400 0.10 7.10 1.96 11 M 45 0 8700 0.20 10.24 1.71 12 M 42 0 6000 0.38 15.18 1.27 13 M 63 0 6500 0.62 6.47 1.63 Mean±SD 67.69±15.06 1.44±2.54 6692.21±1517.39 0.36±0.30 8.69±3.74 2.02±0.94 Median 71 0 6500 0.38 8.13 1.71 Minimum 42 0 4300 0.01 3.86 1.20 Maximum 86 7 9400 1.05 15.74 4.24
3.2.4 Evaluation of drug pharmacodynamics in vitro
194 μL of PBMCs suspension were loaded into wells of a 96-well plate. Con A was added to each well to a final concentration of 5.0 μg/mL. Subsequently, 4 μL of an ethanol solution containing TET were added to give a serial concentrations of 0.3 nM to 30 μM. To evaluate the synergistic effect of TET combined with MP, 2 μL of an ethanol solution containing MP were added to give final concentrations of 0.05, 0.5, 5, 50 and 500 ng/mL, respectively. Six microliters of ethanol were added to the control wells. The plate was incubated for 96 h in 5% CO2 at 37℃. After the culture, 10 μL of WST-8 assay reagent
solution were added to each well, and the plate was incubated for another 3 h. The optical density value was measured at 450 nm absorbance (ref. 650 nm). PBMCs proliferation was calculated by (Test-Blank)/(Control-Blank)×100%.
3.2.5 Quantification of human cytokines
PBMCs were incubated for 96 h in the presence of Con A, TET and MP together or respectively as described above, and the culture supernatant was stored at −80℃ until measurement of cytokine concentrations. The concentrations of interferon (IFN)-γ, TNF-α, IL-2, -4, -6, -10 and -17 in the culture supernatant were measured with beads-array procedures using the Human Th1/Th2/Th17 Cytokine Kit, followed by flow cytometry, according to the instructions of BD Biosciences (San Jose, CA). The data were analyzed using BD™ Cytometric Bead Array (CBA) FCAP Array Software.
3.2.6 Statistical analysis
The correlation coefficients between the IC50 values of the drugs and the basic
characteristics of the hemodialysis patients were analyzed using Pearson’s test. Differences of median values for the drug IC50 values or stimulation indices between any two subject
potentiate MP immunosuppressive pharmacodynamics were analyzed by Kruskal-Wallis test. These analyses were performed with GraphPad PRISM 5.0. In each case, two-sided P values <0.05 were considered to be significant.
3.3 RESULTS
3.3.1 Effects of MP on mitogen-activated proliferation of PBMCs of hemodialysis patients and healthy subjects
The effects of MP on Con A-activated proliferation of PBMCs of hemodialysis patients and healthy subjects were examined. MP dose-dependently suppressed the PBMC proliferation as shown in Fig. 3-1A. PBMCs derived from two out of 13 hemodialysis patients showed low-responses to MP, and the IC50 values of MP on the proliferation of
PBMCs from these patients gave more than 400 ng/mL (Case 5 and Case 9, Table 2). Meanwhile, none of the low-responders were observed in 11 healthy subjects. Typical dose-response curves of PBMCs obtained from hemodialysis patients against the suppressive effects of MP in the low-responder (Case 5), the high-responder (Case 1) and the normal-responder (Case 7) were presented in Fig. 3-1B. Although the stimulation indices (the ratio of PBMC proliferation stimulated and unstimulated by Con A) on PBMCs of the patients were significantly lower than those of the healthy subjects (Fig. 3-2B, P=0.02), there was no significant difference between the MP effects on patient PBMCs and those on healthy PBMCs (Fig. 3-2A, P=0.45). The median (range) of MP IC50 values against the
proliferation of patient PBMCs was 7.04 (2.30~500.00) ng/mL, while the median (range) value against the healthy PBMCs was 4.44 (3.19~5.08) ng/mL. Obviously, the individual difference of MP IC50 values against the proliferation of patient PBMCs was much larger than
Fig. 3-1 Effects of methylprednisolone on proliferation of PBMCs of hemodialysis patients activated with concanavalin A. Cell proliferation was determined by WST-8 assay. (A) Inhibition of PBMC proliferation by MP. The data were expressed as mean ± SEM and analyzed by Kruskal-Wallis tests (n=13). **P<0.01 and ***P<0.001 (B) Typical dose-response curves of MP against concanavalin A-stimulated proliferation of PBMCs derived from 3 hemodialysis patients (Case 1, Case 5 and Case 7; see Table 1).
Fig. 3-2 Comparison of methylprednisolone (MP) IC50 values (A) and stimulation
indices (B) after the stimulation by concanavalin A between PBMCs of the hemodialysis patients and healthy subjects. The data were analyzed by Mann-Whitney test.