聖マリアンナ・東京ベイ合同
Journal Club
PAVは呼吸器離脱に適したモードか?
東京ベイ・浦安市川医療センター
集中治療科
⽚岡 惇
2016.03.22
本⽇の論⽂
Copyright © 2016 by the Society of Critical Care Medicine and Wolters Kluwer Health, Inc. All Rights Reserved.
Critical Care Medicine www.ccmjournal.org 1
Objectives: Despite protocols incorporating spontaneous breath-ing trials, 31% of ICU patients experience difficult or prolonged weaning from mechanical ventilation. Nonfatiguing modes such as pressure support ventilation are recommended. Proportional assist ventilation provides assistance in proportion to patient effort, which may optimize weaning. However, it is not known how proportional assist ventilation performs relative to pressure sup-port ventilation over a prolonged period in the complex ICU set-ting. The purpose of this study was to compare the physiologic and clinical performance (failure rate), safety, and feasibility of protocols using daily spontaneous breathing trial plus pressure support ventilation versus proportional assist ventilation until ven-tilation discontinuation.
Design: Single-center, unblinded pilot randomized controlled trial. Setting: Medical-surgical ICU of a tertiary-care hospital.
Patients: Adult patients intubated greater than 36 hours were ran-domized if they met eligibility criteria for partial ventilatory support,
tolerated pressure support ventilation greater than or equal to 30 minutes, and either failed or did not meet criteria for a sponta-neous breathing trial.
Interventions: Patients were randomized to the pressure support ventilation or proportional assist ventilation protocol (PAV+, Puri-tan Bennett 840; Covidien, Boulder, CO). Both protocols used progressive decreases in level of assistance as tolerated, coupled with daily assessment for spontaneous breathing trials.
Measurements and Main Results: Of 54 patients randomized, outcome data are available for 50 patients; 27 were randomized to receive proportional assist ventilation and 23 to receive pres-sure support ventilation. There were no adverse events linked to the study interventions, and protocol violations were infrequent. Recruitment was slower than projected (1.3 patients per month). The median (interquartile range) time from randomization to suc-cessful extubation was 3.9 days (2.8–8.4 d) on proportional assist ventilation versus 4.9 days (2.9–26.3 d) on pressure support ventilation (p = 0.39). Time to live ICU discharge was 7.3 days (5.2–11.4 d) on proportional assist ventilation versus 12.4 days (7.5–30.8 d) on pressure support ventilation (p = 0.03).
Conclusion: This pilot study demonstrates the utility, safety, and feasibility of the weaning protocols and provides important infor-mation to guide the design of a future randomized controlled trial comparing weaning from mechanical ventilation on pressure sup-port ventilation versus prosup-portional assist ventilation. (Crit Care Med 2016; XX:00–00)
Key Words: assisted mechanical ventilation; asynchrony index; proportional assist ventilation; respiratory muscles; ventilator weaning
D
ifficult or prolonged weaning from mechanical ventilation (MV) affects 31% (range, 26–42%) of mechanically ventilated patients (1) and increases patient morbidity, mortality, ICU length of stay, and cost to the healthcare system (2). When initial weaning attempts fail to liberate patients from MV, ideally clinicians should chooseCopyright © 2016 by the Society of Critical Care Medicine and Wolters Kluwer Health, Inc. All Rights Reserved.
DOI: 10.1097/CCM.0000000000001600
1London Health Sciences Centre, London, ON, Canada.
2Department of Medicine, The University of Western Ontario, London, ON,
Canada.
This study was performed at London Health Sciences Centre, University Hospital, London, Canada.
Supplemental digital content is available for this article. Direct URL cita-tions appear in the printed text and are provided in the HTML and PDF versions of this article on the journal’s website (http://journals.lww.com/ ccmjournal).
Supported, in part, by Critical Care Western, Department of Medicine, The University of Western Ontario; Program of Experimental Medi-cine (POEM), Department of MediMedi-cine, University of Western Ontario; Lawson Health Research Institute, London Health Sciences Centre, London, Canada; and Covidien, Boulder, USA.
Dr. Bosma has received honourarium for lectures and travel reimburse-ments from Covidien. Dr. Bosma’s institution has received grant support from Covidien for Dr. Bosma’s research studies. The remaining authors have disclosed that they do not have any potential conflicts of interest. For information regarding this article, E-mail: [email protected]
A Pilot Randomized Trial Comparing Weaning
From Mechanical Ventilation on Pressure Support
Versus Proportional Assist Ventilation
Karen J. Bosma, MD, FRCPC
1,2; Brooke A. Read, MHS, BSc, RRT
1;
Mohammad J. Bahrgard Nikoo, MD, FRCPC
1,2; Philip M. Jones, MD, FRCPC, MSc
1,2;
Fran A. Priestap, MSc
1; James F. Lewis, MD, FRCPC
1,2Crit Care Med. 2016 Jan 20.
[Epub ahead of print]
⼈⼯呼吸器離脱の定義
分類
定義
Simple weaning
最初のSBTで呼吸器離脱する患者
Difficult weaning
最⼤3回までのSBT、あるいは1回⽬
のSBTから呼吸器離脱までに最⻑7
⽇間かかる患者
Prolonged weaning 4回以上のSBT、あるいは最初の
SBTから呼吸器離脱までに8⽇間以
上かかる患者
Eur Respir J 2007; 29: 1033-1056
呼吸器離脱困難
•
Difficult weaning, prolonged weaningは、
⼈⼯呼吸器装着患者の31%に起こる
•
それらは患者のICU滞在⽇数の延⻑、死亡率
の増加、コスト増⼤につながる
•
PSVがSBTに失敗した患者が、weaningを⾏
う際に最も使われているモードである
•
PSVは、トリガーした後は受動的であり、横
隔膜の萎縮につながる可能性、⾮同調が多い
可能性がある
Eur Respir J 2007; 29:1033–1056 JAMA 2002; 287:345–355 Chest 1994; 106:1188–1193 J Appl Physiol (1985) 1996; 81:426–436 Intensive Care Med 2008; 34:1477–1486⼈⼯呼吸器離脱困難患者に
適したモードはあるのか?
従来の⼈⼯呼吸器モード
医師
モード
呼吸器
⼈⼯
患者
1回換気量
呼吸数
Closed-loop Ventilation
医師
% サポート
呼吸器
⼈⼯
患者
気道抵抗、コンプライアンスを測
定、患者が求める1回換気量、流
速を計測する
Closed-loop Ventilation
•
患者の吸気努⼒に⽐例したサポートを⾏うモード
Proportional Assist Ventilation(PAV)
→PAV+(PB840/980), PPS(Evita)
Neurally Adjusted Ventilatory Assist(NAVA)
→Servo i
•
⾃動weaningシステムにより離脱を⽬指すモード
SmartCare
→Evita XL/infinity V500
Adaptive Support Ventilation(ASV)
→Hammilton G5
患者の吸気努⼒に⽐例してサポートする
conventional ventilation. The patient still has to generate
sufficient flow to trigger the ventilator. However, as
dis-cussed later, conventional modes may force a larger tidal
volume than normal, causing air trapping and thus
increas-ing the number of missed triggers.
Neurally Adjusted Ventilatory Assist
NAVA accomplishes the same goals as PAV but
uti-lizes measurement of the diaphragmatic EMG signal to
control gas delivery.
6This is accomplished by the
place-ment of a specifically designed nasogastric tube that has a
series of EMG electrodes near its distal end, positioned
across the diaphragm. As illustrated in Figure 1,
support-ing ventilation based on the diaphragmatic EMG signal
should greatly improve the response of the ventilator and
synchrony, since the signal recognized is high up on the
neural pathway controlling ventilation.
7What is set by the
clinician is the pressure applied for each millivolt of EMG
activity. Thus, similar to PAV, a portion of the ventilatory
effort is proportionally provided by the ventilator, and the
remainder by the patient. As EMG activity increases,
pres-sure is applied during the inspiratory phase, and as the
diaphragm relaxes, airway pressure decreases. Inspiration
ends at a specific percentage of the peak EMG activity.
Contrary to PAV, NAVA greatly improves triggering, since
gas delivery begins when the diaphragm is simulated, not
as a result of flow in the airway. Thus, even in the
pres-ence of severe air trapping or large system leaks,
trigger-ing is not compromised.
PAV and NAVA Versus Traditional Gas Delivery
Figure 2 nicely illustrates the relationship between and
the patient’s effort or work of breathing and the ventilator
pressure during various ventilation modes.
1During a
spe-cific breath, with all forms of volume ventilation there is
an indirect relationship between patient effort (P
mus) and
the pressure applied by the ventilator. Essentially, the more
work assumed by the patient, the less work applied by the
ventilator. This relationship creates difficult problems
re-garding synchrony, which can easily be illustrated with a
lung model with proper setting of inspiratory demand. If
demand is high and the lung model tidal volume is greater
than the ventilator set tidal volume, no pressure above
baseline will be applied to the lung.
In pressure-targeted ventilation, regardless of mode,
ven-tilator work or applied pressure should be independent of
P
mus. That is, during a specific breath, a constant pressure
should be applied to the airway during inspiration, no
matter how much work or P
musis generated by the patient.
Of course, in patients with very high ventilatory demand,
pressure may not be sustained since the ventilator may not
always be able to meet patient flow demand.
In PAV and NAVA there is a direct relationship
be-tween the patient’s effort (P
mus) and ventilator pressure.
Fig. 1. Steps in the process of activating a ventilator breath.
Neu-rally adjusted ventilatory assist ventilation modes are activated
and controlled by diaphragm excitation. Proportional assist
ven-tilation modes are activated by a change in airway pressure, flow,
and volume. (Adapted from Reference 6.)
Fig. 2. Relationship between patient effort and ventilator pressure
during various ventilation modes. During volume ventilation,
pa-tient effort and ventilator pressure are inversely related. During
pressure ventilation, ventilator pressure in unaffected by patient
effort. During proportional assist ventilation (PAV) and neurally
ad-justed ventilatory assist (NAVA), patient effort and ventilator
pres-sure are directly related. (Adapted from Reference 5.)
P
ROPORTIONAL
A
SSIST
V
ENTILATION AND
N
EURALLY
A
DJUSTED
V
ENTILATORY
A
SSIST
142
R
ESPIRATORY
C
ARE
• F
EBRUARY
2011 V
OL
56 N
O
2
Proportional Assist Ventilation
•
コンプライアンス(C)とレジスタンス(R)を
測定して、患者の吸気努⼒に⽐例したサポート
を⾏う
•
Paw = V/C + R×Flow
•
WOB =
ʃ
P×Flow dt
•
PB840では、8-15呼吸ごとに300msecの吸気
ポーズを⾏いCとRを測定
設定するのは
サポート率の
み
患者の呼吸仕事量
(WOBpt)が0.3〜0.8J/L
になるようにサポート率を
設定する
PAVのメリット・デメリット
•
メリット
患者-呼吸器の同調性が良い
呼吸筋を適度に使うことができる
•
デメリット
患者の呼吸努⼒が弱い場合はサポートが減ってしまう
リークがある場合、過度にサポート圧が上がってしま
う可能性(runaway現象)
PAVのエビデンス
•
PAVとPSVによるウィーニングを⾏い48
時間観察したRCTでは、PAVの⽅が調節呼
吸に戻る割合が低かった(PAV 11% vs
PSV 22%, p=0.04)
•
夜間PAVにすることで睡眠の質が改善した
Intensive Care Med 2008; 34:2026–2034
Crit Care Med 2007; 35:1048–1054
PAVは呼吸器離脱困難患者の
ウィーニングにおいて
本⽇の論⽂
Copyright © 2016 by the Society of Critical Care Medicine and Wolters Kluwer Health, Inc. All Rights Reserved.
Critical Care Medicine www.ccmjournal.org 1
Objectives: Despite protocols incorporating spontaneous breath-ing trials, 31% of ICU patients experience difficult or prolonged weaning from mechanical ventilation. Nonfatiguing modes such as pressure support ventilation are recommended. Proportional assist ventilation provides assistance in proportion to patient effort, which may optimize weaning. However, it is not known how proportional assist ventilation performs relative to pressure sup-port ventilation over a prolonged period in the complex ICU set-ting. The purpose of this study was to compare the physiologic and clinical performance (failure rate), safety, and feasibility of protocols using daily spontaneous breathing trial plus pressure support ventilation versus proportional assist ventilation until ven-tilation discontinuation.
Design: Single-center, unblinded pilot randomized controlled trial. Setting: Medical-surgical ICU of a tertiary-care hospital.
Patients: Adult patients intubated greater than 36 hours were ran-domized if they met eligibility criteria for partial ventilatory support,
tolerated pressure support ventilation greater than or equal to 30 minutes, and either failed or did not meet criteria for a sponta-neous breathing trial.
Interventions: Patients were randomized to the pressure support ventilation or proportional assist ventilation protocol (PAV+, Puri-tan Bennett 840; Covidien, Boulder, CO). Both protocols used progressive decreases in level of assistance as tolerated, coupled with daily assessment for spontaneous breathing trials.
Measurements and Main Results: Of 54 patients randomized, outcome data are available for 50 patients; 27 were randomized to receive proportional assist ventilation and 23 to receive pres-sure support ventilation. There were no adverse events linked to the study interventions, and protocol violations were infrequent. Recruitment was slower than projected (1.3 patients per month). The median (interquartile range) time from randomization to suc-cessful extubation was 3.9 days (2.8–8.4 d) on proportional assist ventilation versus 4.9 days (2.9–26.3 d) on pressure support ventilation (p = 0.39). Time to live ICU discharge was 7.3 days (5.2–11.4 d) on proportional assist ventilation versus 12.4 days (7.5–30.8 d) on pressure support ventilation (p = 0.03).
Conclusion: This pilot study demonstrates the utility, safety, and feasibility of the weaning protocols and provides important infor-mation to guide the design of a future randomized controlled trial comparing weaning from mechanical ventilation on pressure sup-port ventilation versus prosup-portional assist ventilation. (Crit Care Med 2016; XX:00–00)
Key Words: assisted mechanical ventilation; asynchrony index; proportional assist ventilation; respiratory muscles; ventilator weaning
D
ifficult or prolonged weaning from mechanical ventilation (MV) affects 31% (range, 26–42%) of mechanically ventilated patients (1) and increases patient morbidity, mortality, ICU length of stay, and cost to the healthcare system (2). When initial weaning attempts fail to liberate patients from MV, ideally clinicians should chooseCopyright © 2016 by the Society of Critical Care Medicine and Wolters Kluwer Health, Inc. All Rights Reserved.
DOI: 10.1097/CCM.0000000000001600
1London Health Sciences Centre, London, ON, Canada.
2Department of Medicine, The University of Western Ontario, London, ON,
Canada.
This study was performed at London Health Sciences Centre, University Hospital, London, Canada.
Supplemental digital content is available for this article. Direct URL cita-tions appear in the printed text and are provided in the HTML and PDF versions of this article on the journal’s website (http://journals.lww.com/ ccmjournal).
Supported, in part, by Critical Care Western, Department of Medicine, The University of Western Ontario; Program of Experimental Medi-cine (POEM), Department of MediMedi-cine, University of Western Ontario; Lawson Health Research Institute, London Health Sciences Centre, London, Canada; and Covidien, Boulder, USA.
Dr. Bosma has received honourarium for lectures and travel reimburse-ments from Covidien. Dr. Bosma’s institution has received grant support from Covidien for Dr. Bosma’s research studies. The remaining authors have disclosed that they do not have any potential conflicts of interest. For information regarding this article, E-mail: [email protected]
A Pilot Randomized Trial Comparing Weaning
From Mechanical Ventilation on Pressure Support
Versus Proportional Assist Ventilation
Karen J. Bosma, MD, FRCPC
1,2; Brooke A. Read, MHS, BSc, RRT
1;
Mohammad J. Bahrgard Nikoo, MD, FRCPC
1,2; Philip M. Jones, MD, FRCPC, MSc
1,2;
Fran A. Priestap, MSc
1; James F. Lewis, MD, FRCPC
1,2Crit Care Med. 2016 Jan 20.
[Epub ahead of print]
論⽂のPICO
P
⼈⼯呼吸器離脱困難な患者
(simple weaningではない)
I
PAVを使⽤
C
PSVを使⽤
O
呼吸器離脱までの時間
Study Design
•
単施設、⾮盲検、前向きランダム化⽐較
試験(pilot study)
•
カナダ、ロンドンにあるUniversity
Hospital-London Health Science
Centre の内科外科ICU(20床)
•
ランダム割付は、computer-generated
random number sequence によって⾏
われ、隠蔽化されている
Patients
Inclusion criteria
•
18歳以上の挿管患者
Patients
Exclusion criteria
1) 48時間以内にwithdrawが考慮される患者
2) ⾼位の脊髄障害、進⾏性の神経筋疾患の
よって慢性的な呼吸器依存となる可能性が
ある、または脳外科的介⼊が必要である患
者
Enrolment Procedure
Supplemental Digital Content Figure 1: Enrolment Procedure
Daily Screening of all ICU patients: >18 yrs of age
Intubated >36 hours
Exclude if:
Exclusion Criteria:
Successful SBT awaiting extubation Withdrawal of life support considered High spinal cord injury
Neurosurgical patient Neuromuscular disease Follow using daily eligibility checklist until meet all
Clinical Stability Criteria to trial mode of partial ventilatory support (PAV or PSV):
partial/complete reversal of cause of respiratory failure
body temperature between 36ºC and 39ºC metabolic disorders corrected; pH >7.32 hemoglobin >70 g/L; no ongoing bleeding stable hemodynamic status
Able to trigger
PaO2 ≥ 60 mmHg or SaO2 ≥ 90% on FiO2≤
0.60 and PEEP ≤ 15 cm H2O
AC/VC: Pplat≤30cmH2O with Vt 6-8 ml/kg
OR AC/PC: PC+PEEP≤30cmH2O
Exclude if: Exclusion Criteria:
Has met all Criteria for Switching to Spontaneous Mode of Ventilation >24 hours
Pre-inclusion Test on PSV 15 cmH2O for 30 minutes
Patient fails Pre-inclusion test:
Return to AC ventilation and reassess within 24 hour
Patient passes Pre-inclusion test: Assess for Criteria to Initiate Weaning:
PaO2/FiO2>200 on FiO2 ≤0.50 and PEEP ≤8 cmH2O
No inotropes/vasopressors except low dose dopamine
RSBI <105: Patient passes Pre-SBT readiness assessment Proceed to SBT:
Place patient on CPAP 5 cmH2O and FiO2 0.40 for 30 minutes
Patient does not meet Criteria to Initiate Weaning
Patient meets Criteria to Initiate Weaning: Proceed to Pre-SBT readiness assessment: Place patient on CPAP for 1-2 min, measure RSBI
RSBI≥ 105: Patient fails Pre-SBT readiness assessment
Patient passes SBT Patient fails SBT
Exclude if: Exclusion Criteria: Passed SBT and tolerating
PSV≤7cmH2O and
PEEP≤5 cmH2O while
awaiting extubation Obtain informed
consent from Patient or SDM as soon as available (deferred consent permitted) Randomize Exclude if: Exclusion Criteria: Patient/ SDM refuse consent
•
呼吸不全の原因に改善が認められて
きている
•
体温は36〜39度である
•
pH>7.32である
•
Hb>7g/dLで、現在出⾎なし
•
⾎⾏動態が安定している
•
トリガーできる
•
FiO2≦0.6, PEEP≦15cmH2Oで、
PaO2≧60mmHg or SaO2≧90%
•
AC/VCで、Vt 6-8ml/kgで
Pplat≦30cmH2O、もしくはAC/PC
でPC+PEEP≦30cmH2O
上記をすべて満たせば、
プレテストとしてPSV 15cmH2Oに変更
Enrolment Procedure
Supplemental Digital Content Figure 1: Enrolment Procedure
Daily Screening of all ICU patients: >18 yrs of age
Intubated >36 hours
Exclude if:
Exclusion Criteria:
Successful SBT awaiting extubation Withdrawal of life support considered High spinal cord injury
Neurosurgical patient Neuromuscular disease Follow using daily eligibility checklist until meet all
Clinical Stability Criteria to trial mode of partial ventilatory support (PAV or PSV):
partial/complete reversal of cause of respiratory failure
body temperature between 36ºC and 39ºC metabolic disorders corrected; pH >7.32 hemoglobin >70 g/L; no ongoing bleeding stable hemodynamic status
Able to trigger
PaO2 ≥ 60 mmHg or SaO2 ≥ 90% on FiO2≤
0.60 and PEEP ≤ 15 cm H2O
AC/VC: Pplat≤30cmH2O with Vt 6-8 ml/kg
OR AC/PC: PC+PEEP≤30cmH2O
Exclude if: Exclusion Criteria:
Has met all Criteria for Switching to Spontaneous Mode of Ventilation >24 hours
Pre-inclusion Test on PSV 15 cmH2O for 30 minutes
Patient fails Pre-inclusion test: Return to AC ventilation and reassess within 24 hour
Patient passes Pre-inclusion test: Assess for Criteria to Initiate Weaning:
PaO2/FiO2>200 on FiO2 ≤0.50 and PEEP ≤8 cmH2O
No inotropes/vasopressors except low dose dopamine
RSBI <105: Patient passes Pre-SBT readiness assessment Proceed to SBT:
Place patient on CPAP 5 cmH2O and FiO2 0.40 for 30 minutes
Patient does not meet Criteria to Initiate Weaning
Patient meets Criteria to Initiate Weaning: Proceed to Pre-SBT readiness assessment: Place patient on CPAP for 1-2 min, measure RSBI
RSBI≥ 105: Patient fails Pre-SBT readiness assessment
Patient passes SBT Patient fails SBT
Exclude if: Exclusion Criteria: Passed SBT and
tolerating
PSV≤7cmH2O and
PEEP≤5 cmH2O while
awaiting extubation Obtain informed
consent from Patient or SDM as soon as available (deferred consent permitted) Randomize Exclude if: Exclusion Criteria: Patient/ SDM refuse consent
呼吸窮迫がなければプレテストクリア
•
FiO2≦0.5, PEEP≦8cmH2Oで、P/F≧200
•
強⼼薬・昇圧剤の使⽤なし
であれば、SBTへ
まず1-2分CPAP 5cmH2Oにして、
RSBIを測定
RSBI<105であれば、SBTへ
PSV 5cmH2Oにして、30-120分
酸素化の条件を満たさない
RSBI≧105
SBT失敗
であれば、割り付けへ
Ventilation Protocols
•
呼吸器はPuritan Bennett 840 を使⽤
•
後述するPAVプロトコール、PSVプロトコー
ルに従って、呼吸療法⼠(RRT)が設定を変
更(respiratory distress 呼吸窮迫がないよ
うにできるだけサポートを下げていく)
•
設定したmaxのサポートが必要になった場合
はA/Cに戻す
•
PAV群はPAV+とA/C、PSV群はPSVとA/Cし
か使⽤しない
Ventilation Protocols
•
RCTの開始前に15名の患者を⽤いて観察
研究を⾏い、RRTにプロトコルの確認を
⾏ってもらった
•
プロトコルはすぐに⾒られるようにラミ
ネートしてベッドサイドに置いた
•
RRTは毎⽇SBTを⾏えるかどうか後述する
チェックリストを⽤いて確認、除外項⽬
を満たさない場合は毎⽇RSBIのアセスメ
ントとSBTを⾏う
Respiratory Distress
•
呼吸数>35回/min
•
脈拍>140/min, もしくはベースラインより20%以上の
上昇
•
収縮期⾎圧>180mmHg, もしくは<90mmHg, ベース
ラインより30%以上の変化
•
不安
•
発汗
•
副呼吸筋の使⽤
•
奇異呼吸
•
呼吸困難の訴え
PAV protocol
Supplemental Digital Content Figure 2a: Proportional Assist Ventilation Protocol
•
開始の設定は
サポート率70%
•
2-3時間おきに
RRTがアセスメン
トし、問題なけれ
ば10-20%ずつ
PAVサポートを下
げる
サポート率90%ま
で上げてもダメな場
合はA/Cに戻す
PSV protocol
Supplemental Digital Content Figure 2b: Pressure Support Ventilation Protocol
•
開始の設定は
PS 15cmH2O
•
まずRR<35,
VT>5mL/kg
で耐えられる
PSまで下げる
•
2-3時間おきに
RRTがアセス
メントして
PS2-3cmH2P
ずつ下げる
Data collection form for RRTs
Supplemental Digital Content Figure 3: Daily data collection form for Registered Respiratory Therapists
SBTの開始基準
•
P/F≧200
•
FiO2≦0.5
•
pH≧7.32
•
トリガーできる
•
24時間以内に⼼筋虚⾎イベントなし
•
強⼼薬・昇圧剤の使⽤なし
Data collection form for RRTs
Supplemental Digital Content Figure 3: Daily data collection form for Registered Respiratory Therapists
CPAPにしてRSBIを測定
RSBI<105であればSBT施⾏
PAV群はサポート率20%
PSV群はPS 5cmH2O
でSBTを施⾏
PEEP≦8cmH2Oで
SaO2≧90%
呼吸窮迫なし
であればSBTクリア
抜管へ
Endpoints
呼吸器離脱までの時間、ICU/病院滞在期間
呼吸器離脱成功の定義
抜管後48時間再挿管なし、⾮侵襲的⼈⼯呼
吸(NIV)の使⽤もなし、気管切開使⽤時
は呼吸器から最終的に外れた時点、1⽇のう
ち12時間以上NIVを使⽤していない
Statistical Analysis
•
Pilot studyのため、サンプルサイズの計
算はしていない
•
P値<0.05を統計学的有意とした
割付
Copyright © 2016 by the Society of Critical Care Medicine and Wolters Kluwer Health, Inc. All Rights Reserved.
Clinical Investigation
Critical Care Medicine
www.ccmjournal.org 3ventilation protocols. In both protocols, registered respiratory
therapists (RRTs) used stepwise reductions in level of
sup-port to determine the lowest level tolerated in order to avoid
both overassistance and respiratory muscle fatigue. If
respi-ratory distress developed according to the predefined criteria
(Supplemental Table 1, Supplemental Digital Content 1,
http://links.lww.com/CCM/B636), the level of support was
increased. If distress or respiratory acidosis was unresolved
despite maximum levels of support, patients were switch to
assist/control (A/C) mode and reassessed daily to resume PAV
or PSV. Patients in the PAV group could be ventilated using
PAV+ or A/C only, and patients in the PSV group could be
ventilated using PSV or A/C only. In both arms, weaning was
conducted by the RRTs with daily screening and assessment for
SBTs (Supplemental Fig. 3, Supplemental Digital Content 4,
http://links.lww.com/CCM/B635). Level of support was not
used as an indicator of readiness to wean. The RSBI was
con-ducted on continuous positive airway pressure (CPAP) set at
the prior level of positive end-expiratory pressure (PEEP).
SBTs were conducted on PEEP of 5 cm H
2O plus PSV of 5–6 cm
H
2O or PAV of 10–20% gain, respectively.
Strategies to Enhance Protocol Compliance
Prior to the start of this RCT, the ventilation protocols
were trialed and modified with input and collaboration
from RRTs during an observational study of 15 patients
Figure 1. Flow of patients through the study. MD = medical doctor, PAV = proportional assist ventilation, PSV = pressure support ventilation, SBT = spontaneous breathing trial.
エンロール期間は42か⽉
割付
Copyright © 2016 by the Society of Critical Care Medicine and Wolters Kluwer Health, Inc. All Rights Reserved.
Clinical Investigation
Critical Care Medicine www.ccmjournal.org 3
ventilation protocols. In both protocols, registered respiratory therapists (RRTs) used stepwise reductions in level of sup-port to determine the lowest level tolerated in order to avoid both overassistance and respiratory muscle fatigue. If respi-ratory distress developed according to the predefined criteria (Supplemental Table 1, Supplemental Digital Content 1, http://links.lww.com/CCM/B636), the level of support was increased. If distress or respiratory acidosis was unresolved despite maximum levels of support, patients were switch to assist/control (A/C) mode and reassessed daily to resume PAV or PSV. Patients in the PAV group could be ventilated using PAV+ or A/C only, and patients in the PSV group could be ventilated using PSV or A/C only. In both arms, weaning was
conducted by the RRTs with daily screening and assessment for SBTs (Supplemental Fig. 3, Supplemental Digital Content 4, http://links.lww.com/CCM/B635). Level of support was not used as an indicator of readiness to wean. The RSBI was con-ducted on continuous positive airway pressure (CPAP) set at the prior level of positive end-expiratory pressure (PEEP). SBTs were conducted on PEEP of 5 cm H2O plus PSV of 5–6 cm H2O or PAV of 10–20% gain, respectively.
Strategies to Enhance Protocol Compliance
Prior to the start of this RCT, the ventilation protocols were trialed and modified with input and collaboration from RRTs during an observational study of 15 patients
Figure 1. Flow of patients through the study. MD = medical doctor, PAV = proportional assist ventilation, PSV = pressure support ventilation, SBT = spontaneous breathing trial.
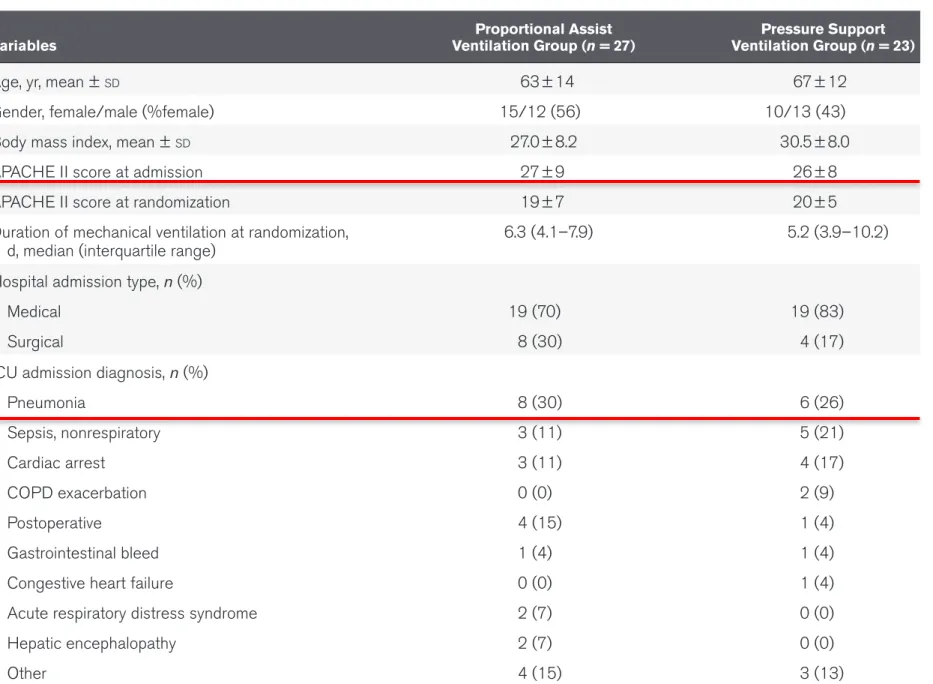
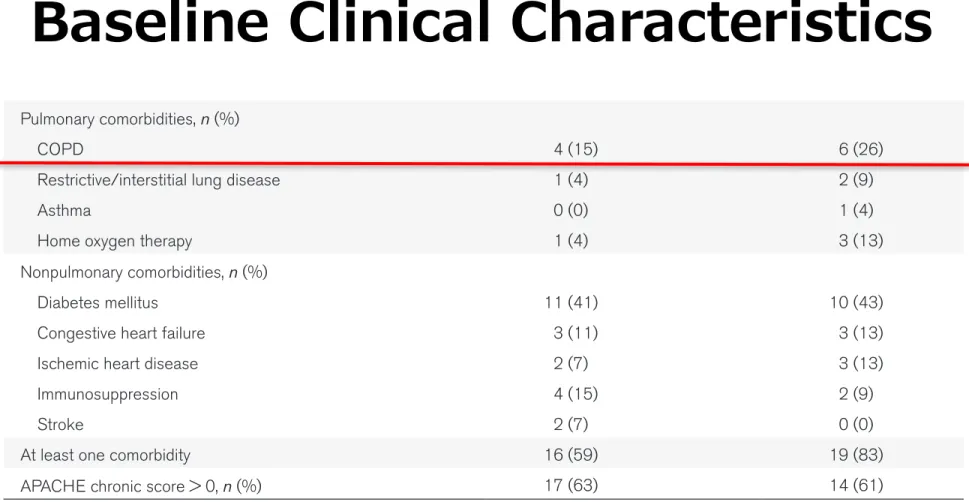
Baseline Clinical Characteristics
Copyright © 2016 by the Society of Critical Care Medicine and Wolters Kluwer Health, Inc. All Rights Reserved.
Clinical Investigation
Critical Care Medicine www.ccmjournal.org 5
TABLE 1.
Baseline Clinical Characteristics of the Study Patients at Enrollment
Variables Ventilation Group (n = 27)Proportional Assist Ventilation Group (n = 23)Pressure Support
Age, yr, mean ± SD 63 ± 14 67 ± 12
Gender, female/male (%female) 15/12 (56) 10/13 (43)
Body mass index, mean ± SD 27.0 ± 8.2 30.5 ± 8.0
APACHE II score at admission 27 ± 9 26 ± 8
APACHE II score at randomization 19 ± 7 20 ± 5
Duration of mechanical ventilation at randomization,
d, median (interquartile range) 6.3 (4.1–7.9) 5.2 (3.9–10.2)
Hospital admission type, n (%)
Medical 19 (70) 19 (83)
Surgical 8 (30) 4 (17)
ICU admission diagnosis, n (%)
Pneumonia 8 (30) 6 (26) Sepsis, nonrespiratory 3 (11) 5 (21) Cardiac arrest 3 (11) 4 (17) COPD exacerbation 0 (0) 2 (9) Postoperative 4 (15) 1 (4) Gastrointestinal bleed 1 (4) 1 (4)
Congestive heart failure 0 (0) 1 (4)
Acute respiratory distress syndrome 2 (7) 0 (0)
Hepatic encephalopathy 2 (7) 0 (0)
Other 4 (15) 3 (13)
Pulmonary comorbidities, n (%)
COPD 4 (15) 6 (26)
Restrictive/interstitial lung disease 1 (4) 2 (9)
Asthma 0 (0) 1 (4)
Home oxygen therapy 1 (4) 3 (13)
Nonpulmonary comorbidities, n (%)
Diabetes mellitus 11 (41) 10 (43)
Congestive heart failure 3 (11) 3 (13)
Ischemic heart disease 2 (7) 3 (13)
Immunosuppression 4 (15) 2 (9)
Stroke 2 (7) 0 (0)
At least one comorbidity 16 (59) 19 (83)
APACHE chronic score > 0, n (%) 17 (63) 14 (61)
APACHE = Acute Physiology and Chronic Health Evaluation, COPD = chronic obstructive pulmonary disease. common reasons for switching to A/C were similar between
PAV and PSV groups and were ongoing distress at maxi-mum support (36 vs 33 events), sedated for procedure (10 vs 8 events), apnea (3 vs 8 events), and pH less than 7.32 (4 vs 2 events), respectively.
An initial audit demonstrated that the most common protocol violation was noncompletion of the daily two-step weaning assessment. After modification of the daily data collection form to include a checklist (Supplemental Fig. 3, Supplemental Digital Content 4, http://links.lww.com/CCM/
Baseline Clinical Characteristics
Copyright © 2016 by the Society of Critical Care Medicine and Wolters Kluwer Health, Inc. All Rights Reserved.
Clinical Investigation
Critical Care Medicine www.ccmjournal.org 5
TABLE 1.
Baseline Clinical Characteristics of the Study Patients at Enrollment
Variables Ventilation Group (n = 27)Proportional Assist Ventilation Group (n = 23)Pressure Support
Age, yr, mean ± SD 63 ± 14 67 ± 12
Gender, female/male (%female) 15/12 (56) 10/13 (43)
Body mass index, mean ± SD 27.0 ± 8.2 30.5 ± 8.0
APACHE II score at admission 27 ± 9 26 ± 8
APACHE II score at randomization 19 ± 7 20 ± 5
Duration of mechanical ventilation at randomization,
d, median (interquartile range) 6.3 (4.1–7.9) 5.2 (3.9–10.2)
Hospital admission type, n (%)
Medical 19 (70) 19 (83)
Surgical 8 (30) 4 (17)
ICU admission diagnosis, n (%)
Pneumonia 8 (30) 6 (26) Sepsis, nonrespiratory 3 (11) 5 (21) Cardiac arrest 3 (11) 4 (17) COPD exacerbation 0 (0) 2 (9) Postoperative 4 (15) 1 (4) Gastrointestinal bleed 1 (4) 1 (4)
Congestive heart failure 0 (0) 1 (4)
Acute respiratory distress syndrome 2 (7) 0 (0)
Hepatic encephalopathy 2 (7) 0 (0)
Other 4 (15) 3 (13)
Pulmonary comorbidities, n (%)
COPD 4 (15) 6 (26)
Restrictive/interstitial lung disease 1 (4) 2 (9)
Asthma 0 (0) 1 (4)
Home oxygen therapy 1 (4) 3 (13)
Nonpulmonary comorbidities, n (%)
Diabetes mellitus 11 (41) 10 (43)
Congestive heart failure 3 (11) 3 (13)
Ischemic heart disease 2 (7) 3 (13)
Immunosuppression 4 (15) 2 (9)
Stroke 2 (7) 0 (0)
At least one comorbidity 16 (59) 19 (83)
APACHE chronic score > 0, n (%) 17 (63) 14 (61)
APACHE = Acute Physiology and Chronic Health Evaluation, COPD = chronic obstructive pulmonary disease.
common reasons for switching to A/C were similar between PAV and PSV groups and were ongoing distress at maxi-mum support (36 vs 33 events), sedated for procedure (10 vs 8 events), apnea (3 vs 8 events), and pH less than 7.32 (4 vs 2 events), respectively.
An initial audit demonstrated that the most common protocol violation was noncompletion of the daily two-step weaning assessment. After modification of the daily data collection form to include a checklist (Supplemental Fig. 3, Supplemental Digital Content 4, http://links.lww.com/CCM/
ベースラインは両群間で変わりなし
重症度はAPACHEⅡ 27点程度
Feasibility Outcomes
•
呼吸窮迫でRRTが呼吸器サポートを上昇
させた回数は、PAV群で76回/232days、
PSV群で124回/295daysと、有意にPSV
群で多かった(p=0.002)
•
A/Cに戻した回数は、PAV群で66回、PSV
群で90回と、変わりなし(p=0.61)
•
全くA/Cに戻さなかった患者は、PAV群で
6/27名、PSV群で6/23名(p=1.0)
Respiratory Parameters
Copyright © 2016 by the Society of Critical Care Medicine and Wolters Kluwer Health, Inc. All Rights Reserved.
Bosma et al
6 www.ccmjournal.org 888
TABLE 2.
Comparison of Respiratory Parameters Pre- and Postrandomization on
Proportional Assist Ventilation With Load-Adjustable Gain Factors Versus Pressure
Support Ventilation
Variables PAV PSV Adjusted Difference (PAV – PSV) (95% CI) Pre-randomization (n = 27) First Post-randomization (n = 26) Second Post-randomization (n = 12) Pre-randomization (n = 23) First Post-randomization (n = 23) Second Post-randomization (n = 15) First Post-randomization Second Post -randomization Set level of support on PSV, cm H2O 12.8 ± 3.1 13.4 ± 2.4 12.9 ± 2.8 9.7 ± 3.9 Set level of support on PAV, % 58.3 ± 15.8 31.3 ± 10.5 ∆P, cm H2O 13.2 ± 3.3 10.8 ± 3.8a 6.3 ± 1.8b 13.6 ± 2.6 12.3 ± 5.4 10.4 ± 3.7b –1.5 (–4.1 to 1.1) (–6.5 to –1.6)–4.1 a Peak pressure at the airway opening, cm H2O 21.8 ± 3.9 19.3 ± 4.1b 15.9 ± 3.7a 22.9 ± 2.8 22.9 ± 3.5 19.2 ± 4.5a –3.0 (–4.8 to –1.2)a (–6.4 to 0.3)–3.0 c Positive end- expiratory pressure, cm H2O 8.6 ± 2.2 8.4 ± 2.0 9.5 ± 2.5 9.3 ± 2.6 9.5 ± 2.4 8.7 ± 2.4 –0.3 (–1.0 to 0.4) (–0.9 to 2.5)0.8 Inspiratory time/ total breath time, % 35.3 ± 7.9 38.0 ± 6.5d 38.3 ± 5.0 38.0 ± 8.5 38.8 ± 8.5 37.4 ± 7.4 1.0 (–2.2 to 4.1) (–4.5 to 5.0)0.3 Peak inspiratory flow, L/s 1.0 ± 0.2 1.0 ± 0.2 0.9 ± 0.2 1.0 ± 0.2 1.0 ± 0.2 0.9 ± 0.2 d 0.0 (–0.1 to 0.1) (–0.2 to 0.2)–0.0 VT, mL 564 ± 162 560 ± 136 589 ± 98 628 ± 193 634 ± 190 563 ± 158d –0.0 (–0.1 to 0.04) (–0.1 to 0.1)0.0 VT/kg ideal body weight, mL 9.6 ± 2.8 9.6 ± 3.0 8.9 ± 2.0 10.0 ± 2.7 10.0 ± 2.5 8.7 ± 2.0d –0.0 (–1.2 to 1.2) (–1.0 to 1.9)0.4 Respiratory rate, breaths/min 25.7 ± 5.5 27.2 ± 6.2c 25.1 ± 6.3 24.3 ± 7.5 25.7 ± 6.7 27.2 ± 6.5 0.9 (–2.3 to 4.1) (–7.9 to 2.4)–2.8 VE, L/min 13.9 ± 3.2 14.6 ± 3.1 14.3 ± 2.9 14.5 ± 4.8 15.9 ± 5.3 14.5 ± 3.9 –0.5 (–2.4 to 1.3) (–2.6 to 2.2)–0.2 PaoArea, cm H2O·s 6.7 (4.3) 3.8 (2.6) b 7.1 (3.9) 8.2 (6.8) –4.1 (–5.4 to –2.8)b PaoArea/VE, cm H2O·s/L 12.2 (6.5) 7.3 (6.7) b 14.5 (11.2) 14.8 (12.4) –7.4 (–9.8 to –4.9)b VT/PaoArea, mL/ cm H2O·s 84 (40) 140 (158)b 66 (62) 68 (68) 115 (48 to 181)aPAV = proportional assist ventilation, PSV = pressure support ventilation, ∆P (delta pressure) = peak pressure at the airway opening – positive end-expiratory pressure, VT = tidal volume, VE = minute ventilation, PaoArea = area under the inspiratory pressure curve.
a p < 0.005. b p < 0.0005. c p ≤ 0.07 d p < 0.05.
All data points are presented as mean ± SD or median (interquartile range).
ベースラインは両群間で変わりなし
PAVにすることで、ΔP圧、Peak圧が低く、吸気時間/呼吸時間が⻑くなる
PSV群と⽐較すると、PAV群の⽅が、PaoArea、PaoArea/VE(呼吸器のサ
ポートの強さを⽰す)が低く、VT/PaoAreaが⾼く、second
Asynchrony index
Copyright © 2016 by the Society of Critical Care Medicine and Wolters Kluwer Health, Inc. All Rights Reserved.
Clinical Investigation
Critical Care Medicine www.ccmjournal.org 7
B635) documenting compliance with the daily screening for SBT, noncompletion of either the CPAP screening test or SBT occurred on 5 of 292 of patient study days (1.7%), and this violation involved two patients in each study arm. The second audit examining for nine different potential deviations found complete adherence to study protocol on 254 of 292 of patient study days (90.0%). There were no adverse events (pneumo-thorax, arrhythmia, or death) resulting from any of the study interventions.
Physiologic Response to Ventilation Protocols
Recordings of flow and airway pressure were available for analysis for all 50 patients prerandomization, 49 patients immediately (median, 1; interquartile range [IQR], 0–1.5 hr) postrandomization, and for 26 patients during subsequent days (median, 27; IQR, 20–70-hr postrandomization). Approximately 15,000 breaths in 125 recordings were analyzed. Table 2 compares the respiratory parameters in both groups pre- and postrandomization. There were no statistically sig-nificant differences between the PAV and PSV groups at base-line prerandomization (p values not shown). In the PAV group, there was a significant decrease in peak airway pressure, delta pressure (measured as peak airway opening pressure minus the PEEP), and area under the inspiratory pressure curve, immediately postrandomization, and an increase in the per-cent of total cycle time spent in inspiration (Ti/Ttot), whereas there were no significant differences immediately postran-domization in the PSV group. The second measurement of postrandomization respiratory parameters revealed signifi-cant decreases in peak airway pressure and delta pressure in both PAV and PSV groups. Adjusting for baseline measure-ments as a covariate, the PAV group received 7 cm H2O∙s less ventilator assistance (PaoArea) per liter of minute ventilation (p < 0.0001) and increased their VT by 115 mL/cm H2O∙s relative to the PSV group (p < 0.001).
PAV significantly reduced AI postrandomization (Fig. 2A). In total, nine patients (18%) had a high AI (> 10% of breaths) on PSV or on A/C mode at baseline. No patients had a high AI on PAV. In the PSV group, six patients (26%) had a high AI
at baseline, four (17%) immediately postrandomization, and one patient (7%) after further adjustment of ventilator settings according to the PSV protocol (Fig. 2B). Adjusting for baseline differences, patients in the PAV group tended to have a lower AI than patients in the PSV group immediately postrandom-ization, but this did not reach statistical significance (adjusted difference, –4.5 [95% CI –9.5 to 0.4]; p = 0.07).
Clinical Outcomes
Table 3 shows the results for the main clinical endpoints. Weaning duration and time to successful SBT did not dif-fer significantly among survivors between the groups. Among ICU survivors, median time to ICU discharge was shorter in the group randomized to PAV: 7.3 days (IQR, 5.2–11.4 d) ver-sus 12.4 days (IQR, 7.5–30.8 d) in the PSV group (p = 0.03). Kaplan-Meier plots of the proportion of at-risk patients achiev-ing successful extubation and live ICU discharge are shown in Figure 3, A and B. No difference was found for hospital length of stay, ICU mortality, or hospital mortality. Four patients (15%) in the PAV group and three patients (13%) in the PSV group died in ICU (respiratory rate [RR] of PAV, 1.14; 95% CI, 0.28 to 4.6; p = 0.86). Overall in-hospital mortality was nine patients (33%) in the PAV group and six patients (26%) in the PSV group (RR of PAV, 1.28; 95% CI, 0.54 to 3.1; p = 0.58). Cointerventions: Sedating Medications
Table 4 compares the use of medications that may prolong weaning (by causing sedation or neuromuscular weakness) in the two groups pre- and postrandomization. Type and dose of sedative medication were highly variable among individual patients, and therefore, we analyzed pre- and postrandomiza-tion changes to determine the impact of the ventilapostrandomiza-tion pro-tocol on sedative use within each patient. In the PAV group, benzodiazepine, narcotic, and propofol use, measured as both cumulative dose and average daily dose, all decreased signifi-cantly postrandomization as did neuromuscular blocker use. In the PSV group, average daily dose of lorazepam equiva-lent and average daily dose of propofol decreased signifi-cantly postrandomization, whereas the proportion of patients
Figure 2. A, Asynchrony index pre- and postrandomization on proportional assist ventilation. B, Asynchrony index pre- and postrandomization on
pressure support ventilation.
PAV群
PSV群
Asynchrony Index (%) = ⾮同調イベントの回数/全呼吸回数 × 100
Intensive Care Med (2006) 32:1515–1522
AI>10%は、3名いたが、PAVに
Clinical Outcomes
Copyright © 2016 by the Society of Critical Care Medicine and Wolters Kluwer Health, Inc. All Rights Reserved.
Bosma et al
8 www.ccmjournal.org 888
receiving a neuroleptic medication and the median number of days patients received a neuroleptic medication increased significantly postrandomization. After adjusting for the pres-ence/absence of neuroleptic medication prerandomization, the odds of receiving a neuroleptic medication postrandomization on PSV was 3.5 (95% CI, 0.9–13.6; p = 0.07) compared with PAV. ANCOVA, adjusting for baseline values, revealed no sta-tistically significant differences between PAV and PSV groups in postrandomization values for any of the medications.
DISCUSSION
This study is the first RCT examining the physiologic and clinical outcomes of a protocol for PAV with load-adjustable gain factors employed from randomization to final extubation
compared with a protocol for PSV, the most commonly used weaning mode. Patients spent a median 6 days (3–12 d) on study protocol, and an average of 18 ± 5 hours/d without need for ventilation with A/C mode, demonstrating that both pro-tocols could be used safely and effectively for the majority of the recovery period. Patients on PSV met criteria for respira-tory distress, prompting an increase in level of support more frequently than patients on PAV, but patients met criteria for switching to A/C mode with equal frequency between the two groups. No patient experienced an adverse event as a physio-logic consequence of excessive work of breathing or instability. The physiologic impact of PAV+ was a more marked reduc-tion in peak airway pressures and area under the inspiratory pressure curve (a measure of ventilator assistance) while achieving equivalent VTs, indicating that patients on PAV+
Figure 3. A, Time to successful extubation for the two treatment groups (Kaplan-Meier curves). B, Time to live ICU discharge for the two treatment
groups (Kaplan-Meier curves). PAV = proportional assist ventilation, PSV = pressure support ventilation.
TABLE 3.
Comparison of Clinical Outcomes Between Study Groups
Variables Ventilation Group (n = 27)Proportional Assist Pressure Support Ventilation Group (n = 23) p
Time to successful pass of spontaneous breathing trial, d,
median (IQR) 3.7 (2.6–7.0) 4.7 (2.9–25.9) 0.34
Time to successful extubation, d, median (IQR) 3.9 (2.8–8.4) 4.9 (2.9–26.3) 0.39
Time to live ICU discharge, d, median (IQR) 7.3 (5.2–11.4) 12.4 (7.5–30.8) 0.03
Time to live hospital discharge, d, median (IQR) 26.5 (12.3–74.4) 25.0 (15.9–43.5) 0.42
ICU mortality, n (%) 4 (15) 3 (13) 0.86
Hospital mortality, n (%) 9 (33) 6 (26) 0.58
Reintubation, n (%) 3 (11) 5 (22) 0.31
Tracheostomy, n (%) 4 (15) 6 (26) 0.32
Noninvasive ventilation use postfinal extubation 3 (11) 5 (22) 0.52
Total duration of MV, d, median (IQR) 12.1 (7.8–20.4) 13.9 (7.1–34.6) 0.51
Total duration of MV > 21 d, n (%) 6 (22) 6 (26) 0.75
IQR = interquartile range, MV = mechanical ventilation.
成功したSBTまでの⽇数、抜管成功までの⽇数に変わりなし
ICU退室までの⽇数は、PAV群で有意に短い
Kaplan-Meier curves
Copyright © 2016 by the Society of Critical Care Medicine and Wolters Kluwer Health, Inc. All Rights Reserved.
Bosma et al
8 www.ccmjournal.org 888
receiving a neuroleptic medication and the median number of days patients received a neuroleptic medication increased significantly postrandomization. After adjusting for the pres-ence/absence of neuroleptic medication prerandomization, the odds of receiving a neuroleptic medication postrandomization on PSV was 3.5 (95% CI, 0.9–13.6; p = 0.07) compared with PAV. ANCOVA, adjusting for baseline values, revealed no sta-tistically significant differences between PAV and PSV groups in postrandomization values for any of the medications.
DISCUSSION
This study is the first RCT examining the physiologic and clinical outcomes of a protocol for PAV with load-adjustable gain factors employed from randomization to final extubation
compared with a protocol for PSV, the most commonly used weaning mode. Patients spent a median 6 days (3–12 d) on study protocol, and an average of 18 ± 5 hours/d without need for ventilation with A/C mode, demonstrating that both pro-tocols could be used safely and effectively for the majority of the recovery period. Patients on PSV met criteria for respira-tory distress, prompting an increase in level of support more frequently than patients on PAV, but patients met criteria for switching to A/C mode with equal frequency between the two groups. No patient experienced an adverse event as a physio-logic consequence of excessive work of breathing or instability. The physiologic impact of PAV+ was a more marked reduc-tion in peak airway pressures and area under the inspiratory pressure curve (a measure of ventilator assistance) while achieving equivalent VTs, indicating that patients on PAV+ Figure 3. A, Time to successful extubation for the two treatment groups (Kaplan-Meier curves). B, Time to live ICU discharge for the two treatment groups (Kaplan-Meier curves). PAV = proportional assist ventilation, PSV = pressure support ventilation.
TABLE 3.
Comparison of Clinical Outcomes Between Study Groups
Variables Ventilation Group (n = 27)Proportional Assist Pressure Support Ventilation Group (n = 23) p
Time to successful pass of spontaneous breathing trial, d,
median (IQR) 3.7 (2.6–7.0) 4.7 (2.9–25.9) 0.34
Time to successful extubation, d, median (IQR) 3.9 (2.8–8.4) 4.9 (2.9–26.3) 0.39
Time to live ICU discharge, d, median (IQR) 7.3 (5.2–11.4) 12.4 (7.5–30.8) 0.03
Time to live hospital discharge, d, median (IQR) 26.5 (12.3–74.4) 25.0 (15.9–43.5) 0.42
ICU mortality, n (%) 4 (15) 3 (13) 0.86
Hospital mortality, n (%) 9 (33) 6 (26) 0.58
Reintubation, n (%) 3 (11) 5 (22) 0.31
Tracheostomy, n (%) 4 (15) 6 (26) 0.32
Noninvasive ventilation use postfinal extubation 3 (11) 5 (22) 0.52
Total duration of MV, d, median (IQR) 12.1 (7.8–20.4) 13.9 (7.1–34.6) 0.51
Total duration of MV > 21 d, n (%) 6 (22) 6 (26) 0.75
IQR = interquartile range, MV = mechanical ventilation.
Copyright © 2016 by the Society of Critical Care Medicine and Wolters Kluwer Health, Inc. All Rights Reserved.
Clinical Investigation
Critical Care Medicine www.ccmjournal.org 9
TABLE 4. Comparison of Medications That May Alter Weaning Duration Pre- and Postrandomization
Variables
PAV Group
(n = 27) PSV Group (n = 23) Postrandomization Pre randomization Pos trandomization Pre randomization Pos trandomization Adjusted Difference, PSV – PAV (95% CI)
Lorazepam equivalents Cumulative dose, mg 30.8 (207) 4.8 (25.7) a 13.7 (44.0) 5.4 (25.8) 23.7 (–58.0 to 105.5) Average daily dose, mg 4.4 (25.5) 0.9 (4.3) a 2.3 (8.5) 0.6 (4.0)a 2.4 (–6.2 to 11.0) Single-day dose, mgb 0.8 (7.2) 1.2 (5.0) 1.6 (7.0) 1.0 (6.4) 3.2 (–1.3 to 7.8) Morphine equivalents Cumulative dose, mg 500.3 (618.8) 114.0 (314.0) b 171.0 (1331.0) 161.0 (486.0) 59.1 (–251.5 to 369.6) Average daily dose, mg 85.8 (163.8) 17.0 (57.8) c 42.8 (172.4) 13.6 (32.0)d 10.8 (–31.6 to 53.2) Single-day dose, mga 18.0 (124.0) 18.7 (77) 10.0 (192.0) 5.0 (63.0) d 33.4 (–0.26 to 67.0)d Propofol Cumulative dose, mg 740.0 (5550.0) 0 (70.0) a 2945.0 (8580.0) 0 (2766.0) 22.6 (–4,215.6 to 4,260.7) Average daily dose, mg 52.9 (1169.0) 0 (5.3) a 487.9 (1598.0) 0 (273.8)a 65.1 (–321.1 to 451.4) Single-day dose, mga 0 (0) 0 (0) 0 (100.0) 0 (0) 34.4 (–378.1 to 446.9) Neuroleptics Days receiving neuroleptics, n 0 (2) 0 (4) 0 (0) 1 (4) a –1.6 (–3.4 to 0.3) Proportion of patients who received a neuroleptic, % 40.7 40.7 17.4 56.5b NMBs Days receiving NMBs, n 1 (1) 0 (0) a 0 (1) 0 (0) –0.1 (–0.5 to 0.3) Proportion of patients who received an NMB, % 51.8 14.8a 34.8 17.4 Corticosteroids Days receiving corticosteroids, n 0 (0) 0 (0) 0 (2) 0 (2) 0.2 (–0.6 to 1.0) Proportion of patients who received corticosteroids, % 18.5 14.8 34.8 26.1
PAV = proportional assist ventilation, PSV = pressure support ventilation, NMB = neuromuscular blocker. a p < 0.05.
b Single-day dose = total dose given day prior to randomization or total dose give day after randomization. c p < 0.005.
d p < 0.0005. e p ≤ 0.07.
All data points except percentage of patients receiving neuroleptics, NMBs, or corticosteroids are presented as median (interquartile range).