• 検索結果がありません。

R as a Lingua Franca: Advantages of Using R for Quantitative Research in Applied Linguistics

N/A
N/A
Protected

Academic year: 2021

シェア "R as a Lingua Franca: Advantages of Using R for Quantitative Research in Applied Linguistics"

Copied!
15
0
0

読み込み中.... (全文を見る)

全文

(1)

for Quantitative Research in Applied Linguistics

著者 Mizumoto Atsushi, Luke PLONSKY journal or

publication title

Applied Linguistics

volume 37

number 2

page range 284‑291

year 2016‑04

権利 This is the accepted version of the

manuscript. The final, definitive version of this paper will bepublished in Applied

Linguistics by Oxford University Press, All rights

reserved.http://applij.oxfordjournals.org/cont ent/37/2/284

URL http://hdl.handle.net/10112/13013

doi: 10.1093/applin/amv025

(2)

R as a lingua franca: Advantages of using R for quantitative research in applied linguistics

Atsushi Mizumoto

Kansai University

Luke Plonsky

Northern Arizona University

This is the accepted version of the manuscript. The final, definitive version of this paper will be published in Applied Linguistics by Oxford University Press, All rights reserved.

http://applij.oxfordjournals.org/content/37/2/284

Citation

Mizumoto, A., & Plonsky, L. (2016). R as a lingua franca: Advantages of using R for quantitative research in applied linguistics. Applied Linguistics, 37, 284–291.

doi:10.1093/applin/amv025

(3)

1. Introduction

J. D. Brown’s (1991) classic paper in TESOL Quarterly, titled “Statistics as a Foreign Language,” demonstrated that teachers and even researchers in the field were not well versed in statistics. Likewise, Meara (1995) wrote, “[When I was in graduate school], anyone who could explain the difference between a one-tailed and two-tailed test of significance was regarded as a dangerous intellectual; admitting to a knowledge of one-way analyses of variance was practically the same as admitting to witchcraft in 18th century Massachusetts” (p. 341). Since then, a large body of quantitative research in TESOL has been conducted, employing a range of techniques (e.g., Loewen and Gass 2009; Plonsky 2013). In this sense, statistics is no longer “a foreign language,” but rather it is a communicative and analytical tool for conducting and reporting our research practice. At the same time, however, Loewen et al.’s (2014) replication of Lazaraton et al.’s (1987) survey of researchers’ knowledge of statistics revealed that statistical literacy of researchers in the field has not changed much in the last two decades.

A number of recent works have sought to address this weakness and to move researchers in applied linguistics toward more appropriate analyses. In many cases, the reporting of effect sizes and confidence intervals, for example, seek to align L2 research with what is considered best practice in other social sciences such as education and psychology (Cumming 2012). In other cases, novel techniques such as bootstrapping and mixed effects modeling have also been introduced as a means to advance and potentially improve quantitative data analysis in the field (Baayen 2008; Cunnings 2012; Larson-Hall 2015; Larson-Hall and Herrington 2010; Plonsky, Egbert and LaFlair 2014).

In an effort to keep abreast with and apply these and other recent statistical advances, we

argue in this paper in favor of the use of R, a statistical software environment, for quantitative

(4)

applied linguistics research. In order to facilitate the use of R, we also introduce an R-based web application recently developed by the first author. Throughout the paper, we advocate the use of R as a lingua franca (communication tool) for applied linguists. However, it is not our intention to “sell” this particular software to the readers of Applied Linguistics or to anyone, for that

matter. Rather, we seek to inform a general applied linguistics audience of how recent advances in quantitative data analyses have been driven by—and can be fruitfully utilized using—R. We are also pragmatic in our approach, and we recognize that R, like any program, has its

weaknesses. Therefore, our goal is achieved if, after reading this article, readers make more informed decisions concerning statistical software depending on their research foci and needs.

2. Advantages of Using R

R is a free, open-source computer language and software environment for statistical computing and graphics (R Core Team 2014). Compared with SPSS, it is not used by many researchers in applied linguistics (Loewen et al. 2014). In Loewen et al.’s (2014: 372) survey, SPSS was found to be used by 69% of the respondents. In contrast, R was used by only 15% of the respondents, even less than the 17% who conducted their analyses “by hand.” Despite its lack of popularity in our own field, the use of R in other disciplines has been rapidly gaining in

popularity and, according to Muenchen (2014), R recently “became the most widely used analytics software for [all] scholarly articles.” We first outline the reasons why R is popular among researchers in other fields and why we recommend its use for analyses in quantitative applied linguistics research as well.

The reproducibility of data analysis is perhaps the most compelling advantage provided

by R. As applied linguistics continues to mature, more attention will likely continue to be paid to

(5)

research synthesis/meta-analysis as well as replication research (Oswald and Plonsky 2010; Porte 2012). Further momentum in this area is found in the IRIS (Instruments for Research Into

Second Language Learning and Teaching) database launched in 2012 as “a free, searchable, up- and downloadable collection of instruments, materials and stimuli that are used to elicit data for research into second and foreign languages” (IRIS n.d.) to which many international journals in applied linguistics, including Applied Linguistics, have pledged their support. These are all signs

of the field’s maturity and emphasis on reproducibility of research.

In order to examine the reproducibility of primary studies and further promote replication, however, the data itself and data analytic procedures must also be shared. And in fact, journals and funding agencies increasingly require data to be made publicly available after publication. In addition to data sharing, open access to R codes will facilitate reproduction and replication of data analysis. This is possible because R is a command line driven program. With R, you only need to run the code to replicate the analyses and produce the exact same results obtained by the original study. This feature of R also enables researchers to experiment with and learn from alternate analytical approaches based on the same dataset.

Our next point is also related to the reproducibility of data analysis. Statisticians and computer scientists have developed thousands of R packages. These packages can be used for conducting nearly any analysis imaginable. User-friendly R manuals and textbooks, three of which have been written by linguists, of course also come with R codes (Baayen 2008; Gries 2013; Larson-Hall 2015). In applied linguistics, more advanced statistical analyses and modeling have been introduced in recent years such as:

• bootstrapping (Larson-Hall and Herrington 2010; Plonsky et al. 2014);

(6)

• hierarchical linear modeling / multilevel modeling / mixed-effect modeling (e.g., Baayen, Davidson and Bates 2008; Cunnings and Finlayson in press; Gries 2015);

• Bayesian analysis (Gudmestad, House and Geeslin 2013); and

• quantile regression (Chen and Chalhoub-Deville 2014).

These were all conducted with R, enabling codes and packages to be provided or cited.

When R codes are provided, they are usually accompanied by the dataset, which enables researchers to re-run the analyses themselves. This hitherto unprecedented type of

communication of data analysis is greatly facilitated with R, and it is precisely for this reason that we regard R as a (potential) lingua franca for quantitative data analysis in applied linguistics.

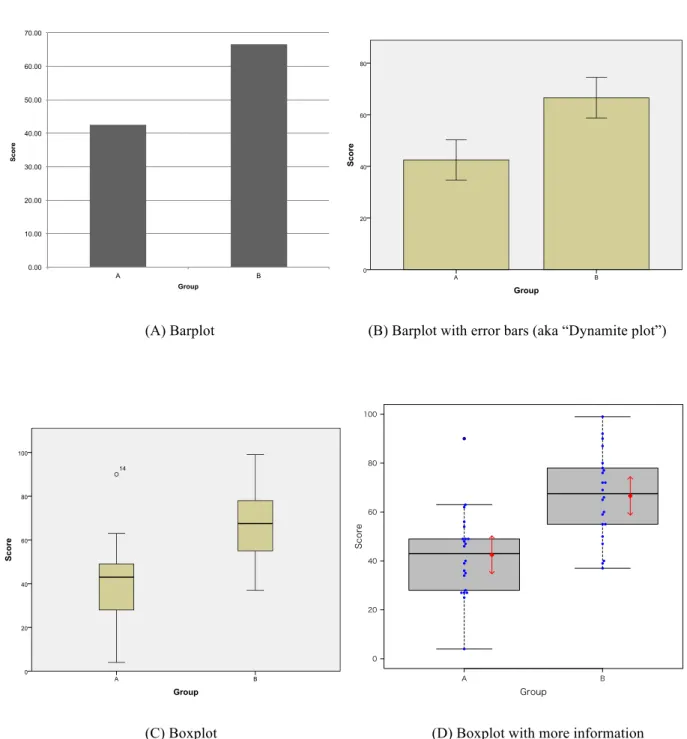
Yet another benefit of R is its ability to produce high-quality graphics. Because R is a command line driven language, the researcher specifies graphic elements with code. This is challenging for beginners, but learning how to make a plot with R provides the researcher with the autonomy to go beyond program defaults to produce more effective data visualizations, a perennial problem in applied linguistics (e.g., Larson-Hall and Plonsky 2015).

Figure 1 shows an example of R’s superiority in producing graphics even for simple

purposes. The same data are used to plot four types of graphs with the amount of information

increasing from (A) to (D). Specifically, in (A, made in Excel), the barplot contains only the

means, while barplot (B, SPSS) has the means and error bars. The boxplot (C, SPSS) is an

improvement on these graphs in that it includes more information (i.e., quartiles, median,

minimum and maximum scores, and outliers) than the barplot with error bars (B). Finally,

though, the boxplot (D), created in R, is superior to all others in that it allows the researcher to

show not only all the information provided by the SPSS graph but also individual data points

(beeswarm plot), their means, and error bars.

(7)

(A) Barplot (B) Barplot with error bars (aka “Dynamite plot”)

(C) Boxplot (D) Boxplot with more information

Figure 1. Comparisons of different plots with the same data.

0.00 10.00 20.00 30.00 40.00 50.00 60.00 70.00

A B

Score

Group

&[ページ タイトル]

Group

B A

Score

80

60

40

20

0

Error Bar: 95% CI

ページ 1

&[ページ タイトル]

G グラフ

Group

B A

Score

100

80

60

40

20

0

14

ページ 1

A B

0 20 40 60 80 100

Group

Score

(8)

A final advantage of R over other analytical options is tied to the fact that R is a

programming language, rendering the range of possible uses and functions nearly unlimited. Its flexibility enables ideas suggested by a community of professional statisticians and computer scientists to be integrated almost instantaneously. R can also be used with MYSQL database and Apache web-server, which facilitates the development of innovative online programs or

platforms. One such program, “Concerto” (http://www.psychometrics.cam.ac.uk/newconcerto), is an online R-based adaptive testing platform. Concerto can be used for free to create your own CAT (computer adaptive test) and administer it online.

R can also be used to analyze corpus data (see Gries 2009) using natural language processing packages (e.g., tm: Text Mining Package). Various indices have been developed in recent years, for example, that enable learner corpus researchers to automatically score learner writing (or speaking) and to measure readability, lexical diversity (see Koizumi and In’nami 2012 for a review), and discourse-level representations of a text (e.g., Coh-Metrix; Graesser, McNamara and Kulikowich 2011). The R package “koRpus” (Michalke 2014), for example, can compute a number of readability and lexical diversity indices, and the author of the package has created a web application to illustrate the kinds of text analyses users can conduct

(http://ripley.psycho.hhu.de/koRpus/). These and other flexible features are possible because,

unlike any other statistical software package, R is also, as we have noted, a programming

language.

(9)

3. The “langtest” Web Application

So far we have highlighted only strengths of the R statistical package. The major downside of R is its command line interface (CLI; although R Commander makes it possible to use R with a Graphical User Interface). For those who want to utilize R more immediately, we recommend a web application (http://langtest.jp/) developed by the first author using Shiny (http://shiny.rstudio.com/), a web application framework for R.

The web application “langtest” is very easy and intuitive to use. The user simply copies and pastes his/her data from a spreadsheet as shown in screenshots from the website in Figure 2.

S/he can then conduct a wide range of statistical analyses. Furthermore, all analyses on the website provide sample data and output with which users can compare their own.

As its name “langtest” suggests, analyses of particular interest to researchers in language

testing can also be conducted, such as item analysis (based on norm-referenced and criterion- referenced testing), generalizability theory, and item response theory (IRT).

Because “langtest” utilizes the power and flexibility of R, it produces output that includes

effect sizes such as Cohen’s d (which is not produced by SPSS), confidence intervals, and other

valuable indices. The application also provides superior functionality in data visualization. In

many analyses, the user can produce boxplots as suggested by Larson-Hall and Herrington

(2010) instead of bar graphs with error bars. The web application “langtest” is also, of course,

free, and all codes are available on the website, so interested users can modify the code as

needed; they can also study the code as an example or to assist in producing their own.

(10)

Figure 2. Screenshot of data entry and automatically produced graphics from “langtest.”

Basic Statistics Calculator

Data input:

Input values can be separated by newlines, spaces, commas, or tabs.

Main About

Basic statistics

n mean sd median trimmed mad min max range skew kurtosis se 92 40.41 6.35 40 40.69 5.93 25 53 28 -0.36 -0.34 0.66

Histogram

Box plot with individual data points

Test of normality

44

32

37

44

40

44

45

36

37

42

38

47

26

41

27

39

47

41

36

44

39

49

40

25

33

39

36

45

32

51

47

(11)

The web application “langtest” was created for three main reasons. First, it frees us from the need to purchase software such as SPSS. Second, it provides users with clear examples of each analysis (as an educational purpose). And third, it is our hope that by engaging with

“langtest,” learners will want to learn how to use R as well. That is, though “langtest” is more than adequate for the vast majority of analyses in our field, it also has limitations (e.g., users can check the R codes used in “langtest,” but they are not recorded in a reproducible command line format). And as users become more experienced, addressing relationships that require more sophisticated or flexible analytical approaches, they may require the full range of functionality available in R to meet their research needs.

4. Conclusion

R may someday be the de facto standard software for quantitative data analysis in applied linguistics. Statistics used to be regarded “as a foreign language” (Brown 1991), but we hope R will someday be considered “as a lingua franca.” The hands-on approach to statistics embodied by R helps researchers gain a deeper understanding of the data analytic process, rather than relying on SPSS defaults. We concede that the learning curve of R can be steep. However, considering the advantages described above, we feel it is worth undertaking. If you want to learn another language, you devote your time and effort to learning it. You choose an economical option to learn it. You learn from others who have been successful and in a supportive community of practice. Learning R is very much the same.

Finally, we hope that the web application we have introduced here, “langtest,” will

introduce quantitative researchers in applied linguistics to the possibility of how R, the preferred

(12)

package of researchers in the 21st century, can contribute to improved data analysis and

reporting practices.

(13)

References

Baayen, R. H. 2008. Analyzing Linguistic Data: A Practical Introduction to Statistics Using R.

Cambridge University Press.

Baayen, R. H., D. J. Davidson, and D. M. Bates. 2008. ‘Mixed-effects modeling with crossed random effects for subjects and items,’ Journal of Memory and Language 59/4: 390–412.

doi:10.1016/j.jml.2007.12.005

Brown, J. D. 1991. ‘Statistics as a foreign language: Part 1 What to look for in reading statistical language studies,’ TESOL Quarterly 25/4: 569–586. doi:10.2307/3587077

Chen, F. and M. Chalhoub-Deville. 2014. ‘Principles of quantile regression and an application,’

Language Testing 31/1: 63–87. doi:10.1177/0265532213493623

Cumming, G. 2012. Understanding the New Statistics: Effect Sizes, Confidence Intervals, and Meta-analysis. New York: Routledge.

Cunnings, I. 2012. ‘An overview of mixed-effects statistical models for second language researchers,’ Second Language Research 28/3: 369–382. doi:10.1177/0267658312443651 Cunnings, I. and I. Finlayson. in press. ‘Mixed effects modeling and longitudinal data analysis’

in L. Plonsky (ed.), Advancing Quantitative Methods in Second Language Research. New York: Routledge.

Graesser, A. C., D. S. McNamara, and J. M. Kulikowich. 2011. ‘Coh-Metrix: Providing multi- level analyses of text characteristics,’ Educational Researcher 40/5: 223–234. doi:

10.3102/0013189X11413260

Gries, S. Th. 2009. Quantitative Corpus Linguistics with R: A Practical Introduction. New York:

Routledge.

Gries, S. Th. 2013. Statistics for Linguistics with R (2nd rev. ed.). New York: De Gruyter.

(14)

Gries, S. Th. 2015. ‘The most underused statistical method in corpus linguistics: Multi-level (and mixed-effects) models,’ Corpora 10/1: 95–125. doi:10.3366/cor.2015.0068

Gudmestad, A., L. House, and K. L. Geeslin. 2013. ‘What a Bayesian analysis can do for SLA:

New tools for the sociolinguistic study of subject expression in L2 Spanish,’ Language Learning 63/3: 371–399. doi:10.1111/lang.12006

IRIS. n.d. IRIS: A Digital Repository of Data Collection Instruments for Research into Second Language Learning and Teaching. Available at http://www.iris-

database.org/iris/app/home/about

Koizumi, R. and Y. In’nami. 2012. ‘Effects of text length on lexical diversity measures: Using short texts with less than 200 tokens,’ System 40/4: 554–564.

doi:10.1016/j.system.2012.10.012

Larson-Hall, J. 2015. A Guide to Doing Statistics in Second Language Research Using SPSS and R (2nd ed.). New York: Routledge.

Larson-Hall, J. and R. Herrington. 2010. ‘Improving data analysis in second language acquisition by utilizing modern developments in applied statistics,’ Applied Linguistics 31/3: 368–390.

doi:10.1093/applin/amp038

Larson-Hall, J. and L. Plonsky. 2015. ‘Reporting and interpreting quantitative research findings:

What gets reported and recommendations for the field,’ Language Learning 65/Supp. 1:

125–157.

Lazaraton, A., H. Riggenbach, and A. Ediger. 1987. ‘Forming a discipline: Applied linguists’

literacy in research methodology and statistics,’ TESOL Quarterly 21/2: 263–277.

doi:10.2307/3586735

(15)

Loewen, S. and S. Gass. 2009. ‘The use of statistics in L2 acquisition research,’ Language Teaching 42/2: 181–196. doi:10.1017/S0261444808005624

Loewen, S., E. Lavolette, L. Spino, M. Papi, J. Schmidtke, S. Sterling, and D. Wolff. 2014.

‘Statistical literacy among applied linguists and second language acquisition researchers,’

TESOL Quarterly 48/2: 360–388. doi:10.1002/tesq.128

Meara, P. 1995. ‘Review: Statistical techniques for the study of language and language behavior,’

Language Learning 45/2: 341–343. doi: 10.1111/j.1467-1770.1995.tb00442.x Michalke, M. 2014. koRpus: An R Package for Text Analysis. Version 0.05-5. [Computer

program]. Available at http://reaktanz.de/?c=hacking&s=koRpus

Muenchen, R. A. 2014. R Passes SPSS in Scholarly Use, Stata Growing Rapidly. Available at http://r4stats.com/2014/08/20/r-passes-spss-in-scholarly-use-stata-growing-rapidly/

Oswald, F. L. and L. Plonsky. 2010. ‘Meta-analysis in second language research: Choices and challenges,’ Annual Review of Applied Linguistics 30: 85–110. doi:10.1017/

S0267190510000115

Plonsky, L. 2013. ‘Study quality in SLA: An assessment of designs, analyses, and reporting practices in quantitative L2 research,’ Studies in Second Language Acquisition 35/4: 655- 687. doi:10.1017/S0272263113000399

Plonsky, L., J. Egbert, and G. T. LaFlair. 2014. ‘Bootstrapping in applied linguistics: Assessing its potential using shared data,’ Applied Linguistics Advance online publication.

doi:10.1093/applin/amu001

Porte, G. (ed.). 2012. Replication Research in Applied Linguistics. Cambridge University Press.

R Core Team. 2014. R: A Language and Environment for Statistical Computing [Computer

software]. Vienna, Austria. Available at http://www.r-project.org/

Figure 1. Comparisons of different plots with the same data.
Figure 2. Screenshot of data entry and automatically produced graphics from “langtest.”

参照

関連したドキュメント

Research in mathematics education should address the relationship between language and mathematics learning from a theoretical perspective that combines current perspectives

Our aim was not to come up with something that could tell us something about the possibilities to learn about fractions with different denominators in Swedish and Hong

An example of a database state in the lextensive category of finite sets, for the EA sketch of our school data specification is provided by any database which models the

A NOTE ON SUMS OF POWERS WHICH HAVE A FIXED NUMBER OF PRIME FACTORS.. RAFAEL JAKIMCZUK D EPARTMENT OF

In the previous section, we revisited the problem of the American put close to expiry and used an asymptotic expansion of the Black-Scholes-Merton PDE to find expressions for

A lemma of considerable generality is proved from which one can obtain inequali- ties of Popoviciu’s type involving norms in a Banach space and Gram determinants.. Key words

We show that a discrete fixed point theorem of Eilenberg is equivalent to the restriction of the contraction principle to the class of non-Archimedean bounded metric spaces.. We

Using an “energy approach” introduced by Bronsard and Kohn [11] to study slow motion for Allen-Cahn equation and improved by Grant [25] in the study of Cahn-Morral systems, we