Growth Factors of the Life Insurance Business in Japan
Tadayoshi OTSUKA
Abstract
The purpose of this essay is to demonstrate the factors that contributed to the growth of the life insurance business in Japan through analyzing its historical trend, as well as the overall business environment including market, products, and price during the half century from the end of World War II until the revision of the Insurance Business Law in 1996. In order to accom- plish this puropose, multiple hypotheses to explain the factors of growth are indicated through quantitative analyses and then are tested by empirical analyses
During this period, the life insurance sector grew tremendously, that is, more than 8,000 times in business in force and 10,000 times in total assets.
The growth of the life insurance business exceeded the growth of the Japa- nese economy by far, as its actual growth was 21 times in business in force or 30 times in total assets. The second largest causal factor of the expansion of the life insurance market, following this economic growth, was the increase in the number of households. This increase in households exceeded the popu- lation growth during the high growth period due to an increase in nuclear families. The latter was due to the increase in urban population, which dimin- ished the function of mutual help within families and local communities.
The reason why the growth of the life insurance exceeded household growth was the improvement in peoples' literacy in terms of insurance, that is, their understanding of the necessity for insurance. In addition, the trend must have been accelerated by a series of product developments that sup- ported peoples' self-help efforts, as well as by reductions in premium rates.
早稲田商学第451・452合併号
2 0 1 8 年 3 月
1. Introduction
Meiji Life Insurance was established in 1881, approximately one hundred years after the Equitable Society, the first modern life insurance company, was launched in England. For 130 years since then, the life insurance busi- ness in Japan grew steadily as the country became modernized and its economy continued to expand. However, the nature of the life insurance busi- ness was renewed at the end of the Second World War, with the business before and after WWII⑴ being dramatically different.
The post-war stance of regulation was also significantly different from the pre-war stance. Especially during the post-war recovery period, the utmost priority was to re-establish peoples' trust in the insurance business.
During the high-growth period and after, the regulator was proactively engaged in the healthy growth of the life insurance business by advocating two basic stances which pointed to different directions, that is, protecting pol- icyholders while reducing their cost, and restricting excessive competition.
The purpose of this essay is to demonstrate the factors that contributed to the growth of the life insurance business in Japan through analyzing its historical trend, as well as the overall environment including market, prod- ucts, and price during the half century from the end of World War II until the revision of the Insurance Business Law⑵ in 1996.
In Section 2 of this essay, the growth of the life insurance business over
─────────────────
⑴ Following is the summary of the life insurance business until WWII. The main focus of the market was the middle class and above, and distribution agencies were managed by the estab- lishment of local communities. At first, whole life insurance was a mainstream product, after which endowments became more popular. The premium mode was annual, and underwriting required medical examination by a physician. Many insurers were stock companies, and rather lax regulation at the time resulted in frequent bankruptcies and mergers and acquisitions (M&As) compared to the post-war period. For low income citizens, the government offered small insur- ance policies through the Postal Life Insurance established in 1916. The product required a small monthly premium, of up to 250 yen face amount, and was underwritten only by self-declaration.
⑵ This was the first full-scale revision of the Insurance Business Law since it was enacted in 1900.
a half-century period is quantitatively demonstrated. Section 3 provides an overview of the life insurance business including markets, products, and prices, as well as the surrounding business environment. In Section 4, I dem- onstrate through quantitative analysis that the key contributor to the growth of the life insurance business was the growth of Japan's overall economy, and set multiple hypotheses that indicate the factors that contributed to this growth, which was faster than that of the economy. In the Section 5, I con- duct an empirical analysis on those hypotheses and explain the results.
Finally, I present conclusive opinions and considerations for future research.
2. Historical Trend of Life Insurance Sales
First, I observe the historical trend of business in force and new busi- ness, as well as the total assets and the premium income during the period between 1947⑶ and 2000, in order to quantitatively demonstrate the growth of the life insurance business.
2.1. Business in Force and Total Assets
Table 1 shows the historical movement of the business in force and the total assets for several years during the post-war period, and every five years afterwards. Over the analysis period, the business grew dramatically, more than 8,000 times in business in force and 10,000 times in total assets. How- ever, business in force peaked in 1995, as did the total assets in 1997. Both have been declining since.
In contrast, Figure 1. shows the actual growth rate of business in force and total assets, considering GDP growth. For the purpose of indexation, the 1947 values were defined as 1, and values in each subsequent year were divided by the GDP growth rate.
While the nominal growth of business in force was over 8,000 times, the
─────────────────
⑶ All of the twenty life insurers established the Second Company and completed transfer of the business in 1947, at which point my observation starts. Refer to the section 3.1. for the Second Companies.
actual growth was 21 times. As for total assets, the nominal was more than 10,000 times, but the actual was 30 times. This means that the growth of the life insurance business after the war was mainly due to the recovery and advancement of the Japanese economy. Still, 21 times and 30 times in actual growth rate demonstrate that the life insurance business grew at a pace that far exceeded the growth of the Japanese economy. It is obvious that there were growth factors unique to the life insurance market.
Figure 2 shows the year-on-year growth rate of business in force and total assets. Although the numbers are volatile for the post-war period, they Table 1. Historical Business in Force and Total Assets (Amount in 100 million yen)
Year Business in Force Individual Total asset
1947 1,957 1,957 160
1948 3,656 3,557 189
1949 4,794 4,794 367
1950 5,515 5,100 367
1955 22,430 19,330 1,929
1960 69,971 60,118 7,528
1965 244,173 211,864 22,431
1970 782,301 606,741 58,548
1975 2,654,178 1,730,474 128,930
1980 5,723,283 3,843,319 262,578
1985 8,809,675 6,011,921 538,706
1990 15,953,087 10,835,964 1,302,513
1995 21,395,315 14,692,588 1,874,925
2000 16,312,231 12,444,449 1,886,767
(Source) Fiscal year 1947: "
", Life Insurance Association of Japan; Fiscal years 1948 to 1966: " ," Association of Okura financial affairs; Fiscal years 1967 to 2000: "
," Hoken Kenkyujo Ltd.; hereafter the same shall apply unless otherwise indicated.
0.00 5.00 10.00 15.00 20.00 25.00 30.00 35.00
1946 1948 1950 1952 1954 1956 1958 1960 1962 1964 1966 1968 1970 1972 1974 1976 1978 1980 1982 1984 1986 1988 1990 1992 1994 1996 1998 2000
Total asset Business in force Indivisual
Figure 1. Indexed growth of business in force and total assets, considering GDP growth.
(Note) Values in 1947 were defined as 1; each year's values were divided by GDP growth rate (Source) GDP: Up to fiscal 1965 the Bank of Japan; afterwards the Cabinet Office of Japan; http://
www.esri.cao.go.jp/jp/sna/data/data̲list/kakuhou/files/
(%)
(20) 0 20 40 60 80 100
1948 1950 1952 1954 1956 1958 1960 1962 1964 1966 1968 1970 1972 1974 1976 1978 1980 1982 1984 1986 1988 1990 1992 1994 1996 1998 2000
Business in force Indivisual Total asset
Figure 2. Year-on-year growth of business in force and total assets
show a steady growth afterwards. Figure 3 is similar to Figure 2, with the exception that the volatile post-war period has been removed. The annual growth rate of business in force exceeded 20% until 1976, but slowed down thereafter and became as low as 6% by 1984. During the Bubble Economy period between 1985 and 1991, the growth rate recovered and exceeded 10%
but started declining again, and finally became negative.
The growth rate of total assets essentially shows the same trend as that of business in force, except for the Bubble Economy period during which it shows significantly higher growth rates of over 20%. This indicates that, other than during the post-war confusion period and the Bubble Economy period, the insurance business was consistently growing despite some fluctua- tions. It did not grow instantaneously during a specific period.
2.2. New business and premium income
Next, let us consider the historical trend of new business of individual insurance and premium income, excluding corporate pensions. The individual
(%)
(15) (10) (5) 0 5 10 15 20 25 30 35 40
196019621964196619681970197219741976197819801982198419861988199019921994199619982000
Business in force Indivisual Total asset
Figure 3. Year-on-year growth of business in force and total assets after 1959
insurance new business includes the actual increase from conversion policies.
Figure 4 is the historical trend of actual new business and actual premium income.
Between the beginning and the end of the observation period, the actual growth of both new business and premium income, excluding corporate pen- sions, are 1.8 times, which shows a clear contrast when compared with the dramatic growth of the business in force and total assets. The different pace of growth between the business in force and new business is rather reason- able, as the policy period of life insurance in general is extended over an extremely long time.
In addition, new business peaked in 1993, and so did the premium income in 1997. In other words, the new business peaked two years earlier than the business in force, but the premium income and the total assets peaked in the same year.
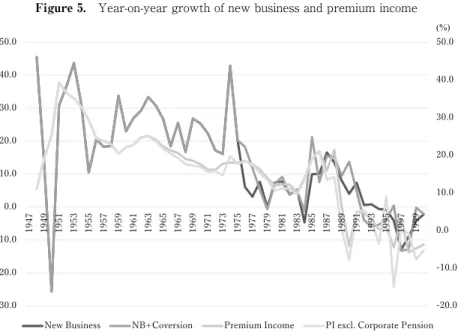
Figure 5 shows the year-on-year growth rate of new business and pre- mium income. Although new business numbers were volatile even after the post-war period, the average growth rate until 1975 is around 20%. After-
0.00 1.00 2.00 3.00 4.00 5.00 6.00
1947 1949 1951 1953 1955 1957 1959 1961 1963 1965 1967 1969 1971 1973 1975 1977 1979 1981 1983 1985 1987 1989 1991 1993 1995 1997 1999
Premium Income Corporate Pension New Business NB+Coversion
Figure 4. Indexed growth of new business and premium income, considering GDP growth
(Note) The 1947 values were defined as 1, and each year's value was divided by the GDP growth rate
wards, although more conversion policies appeared, the new business growth rate decreased gradually and then, after recovering during the Bubble Econ- omy period, it started decreasing again and became negative.
Contrary to new business, the growth rate of premium income was not so volatile. However, it shows the same trend as new business. After decreas- ing gradually, the premium income grew by almost 20% during the Bubble Economy period, and started to decrease again to become negative.
3. Outline of Business
Next, I will divide the 50-year period from the end of WWII until the revision of the Insurance Business Law into four periods: recovery period, high growth period, steady growth period, and Bubble Economy period. For each period, I will demonstrate the outline of the life insurance business and its management, the price changes reflecting premium rates and dividends rates, and how the regulation was involved.
(%)
-20.0 -10.0 0.0 10.0 20.0 30.0 40.0 50.0
-30.0 -20.0 -10.0 0.0 10.0 20.0 30.0 40.0 50.0
1947 1949 1951 1953 1955 1957 1959 1961 1963 1965 1967 1969 1971 1973 1975 1977 1979 1981 1983 1985 1987 1989 1991 1993 1995 1997 1999
New Business NB+Coversion Premium Income PI excl. Corporate Pension
Figure 5. Year-on-year growth of new business and premium income
Table 2. Change in the Insurance Business after World War II Overview of Life
Insurance Business Premium / Dividends Stance of Regulation
Recovery Period 1946~58
20 insurers split their account and resumed the business.
Female sales reps expanded the market.
Business resumed based on conservative provi- sional rates.
Dividends started distributing again, and premium rates were lowered three times.
Rates recovered to the pre-war level.
<Harmonized approach by all companies>
Under guidance of the regulator, all companies offered the same premiums and dividends.
High Growth Period 1959~75
Growth at rates over 20%
continued.
Increased urban popula- tion and nuclear families resulted in stronger demand for life protection.
Launch of the endowment with term.
Individualized dividends started reflecting differ- ence in financial strength.
Premium rates lowered reflecting improvement in mortality and expense.
<Controlled liberalization>
Correction of uniformity, liberalization of dividends within a specified range.
Focus on protection of policyholder (establishment of the Insurance Council) Prioritizing the net premium reserve accumulation and restriction on excessive competitions (start of the Governance by Net Premium Reserve).
Steady Growth Period 1976~84
Slowdown of growth.
Further concentration on life protection products and increased sales of WL with Term products.
Entry of foreign life insurers.
Launch of the third-sector products.
Fixed ranking of company size
Significant increase of divi- dends across the industry including special dividends funded by capital gains.
Dramatic reduction of premium rates including raising interest rate assumptions. Two times additional rate reductions
<Horizontally egalitarian system>
Regulator focused on reducing policyholder's costs and demanded rate reduction and increase of dividends.
Continuation of the Gover- nance by Net Premium Reserve.
Improved quality of agents and sales organization.
Bubble Economy Period 1985~1995
Significant advancement of saving type products.
Increase in total assets.
Change in ranking of middle-sized life insurers.
Burst of the Bubble followed by emergence of negative spreads.
Rates increased four times after the Bubble burst.
<Liberalization and globaliza- tion>
Market principle-based financial administration and mutual entry by subsidiary (Financial System Reform) Rules and regulations to maintain the financial sound- ness, extended information disclosure and measures for bankrupt companies (revision of Insurance Business Law) (Source) Created by the author
3.1. Recovery Period (1946 – 1958)
As Japan was defeated in the Second World War, all financial institutions across the country fell into a state of bankruptcy. Life insurers also followed the Financial Institutions' Reconstruction and Adjustment Act, and executed the designated timing settlement in 1946. In the next couple of years, twenty life insurance companies built the Second Company and transferred their business. In 1946, the provisional premium rates with highly conservative assumptions were implemented by all companies, and applied not only to new business but also retroactively to business in force. Further, policyholder divi- dends were reintroduced in 1948. The recovery period for the life insurance business should be the 10-year period from the start of the Second Company until 1958, when the actual value of business in force and premium rates returned to the pre-war level.
The main product during this period was endowment insurance, the same as during the pre-war period. Although sales were volatile during the post-war depression period and the following inflation period, the life insur- ance industry as well as Japan's economy started to recover during the Korean War in 1950. The pace of recovery of the life insurance industry was rather slow compared with other industries in Japan. The actual value of business in force (based on GDP) exceeded the pre-war level only at the end of 1958, and the total assets exceeded the pre-war level at the end of 1961.
In terms of premium rates, as business recovered and mortality improved, the premium rates were lowered repeatedly by all companies in 1951, 1955, and 1958, almost returning to the pre-war level.
The most significant characteristics of the life insurance business in the post-war period was the establishment of a sales organization mainly consist- ing of women or war widows, especially in the early period. The rapid growth of the sales channel by recruiting a large number of female agents was key to the success of the life insurance business. The pre-war practice of insurance solicitation by local establishment became obsolete. Instead, a new solicitation style was established, whereby female sales agents assigned to
work in certain areas regularly visited households to sell insurance.
The life insurance business during this period can be represented by the phrase "harmonized approach by all companies," which was conducted under guidance of the regulator. The goal of Japan at the time was economic recov- ery, and the goal of the regulator was to rebuild peoples' trust in the financial and insurance businesses. This is why the regulator made sure that none of the twenty approved companies became bankrupt. In other words, the authority paid very close attention so that none of the companies would try to differentiate themselves by offering better prices or dividends, resulting in price competitions.
3.2. High Growth Period (1959 – 1975)
After 1954, the Japanese economy experienced dramatic growth, and continued growing until the first Oil Shock in 1973. This period is called the high growth period, which was also true for the life insurance industry. New business kept growing in excess of 20%, as did premium income and total assets. In other words, the high growth period for the life insurance business lagged slightly behind the overall Japan economy. The high growth period for the life insurance industry was the 16-year period between 1959 and 1975.
The concentration of population in urban areas and advancement of the nuclear family that started in the late 1950s destroyed the traditional mutual help system within families and local communities, resulting in new urban residents' need for protection against death. The door-to-door visits by female sales reps precisely fulfilled this need.
Further, the mainstream products in this period were different from those in the recovery period. In response to the increased need for life pro- tection, the endowment with term product—which offered an enlarged life protection feature—was launched. As the need for life protection became stronger than that for saving, the endowment with term accounted for a larger portion of new business, and the ratio of the death benefit to the matu- rity benefit increased from two times in the early period to as large as
twenty times.
One of the highlights of the high growth period was the entry of foreign life insurers into the Japanese market. The American Life Insurance Com- pany (ALICO Japan) in 1973, and the American Family Assurance Corporation (Aflac Japan) in 1974, launched a business in Japan targeting Jap- anese people for the first time after the war. After that, more foreign life insurers followed, and the market became increasingly multi-channel with diversified products.
The life insurance business during this period can be represented by the phrase "controlled liberalization" by the authority. Companies did not pursue premium rates reflecting their management status. Instead, the authority instructed insurers to differentiate by policyholders' dividends.
Also in this period, the regulator explicitly implemented two policies that pointed to different directions. One is protection of policyholders and reduc- ing their costs; the other is restriction on excessive competitions. As for the first one, the Insurance Council, a consultative body of the Minister of Finance, made the first recommendation, which included the correction of imposing universal premium rates and policyholder dividends, as well as reduction of policyholders' cost by achieving management efficiency. The lat- ter, restriction on excessive competitions, was the beginning of Governance by Net Premium Reserve; the aim was to prioritize the accumulation of net premium reserve over offering competitive premium rates.
3.3. Steady Growth Period (1976 – 1984)
At the event of the first Oil Shock in 1973, the Japanese economy ended its miraculous growth and entered a steady growth period. The 20% annual growth of the life insurance business also declined to below 10% in the 1950s.
During this era, while hyperinflation eroded the practical value of policies issued in past years, life insurance companies one after another built modern buildings downtown in large cities all over Japan. This practice generated the social criticism that life insurance companies were making too much money.
As new business growth slowed down, the mainstream of insurance sales shifted from endowment with term products to more protection-ori- ented whole life (WL) with term products. In addition, not only life protection but also medical protection such as hospitalization and surgery benefits started expanding. Many companies developed medical riders to attach to WL with term products, medical insurance products focused on hospitaliza- tion and surgery benefits, and cancer products.
While big-sized life insurers that play mainly in the captive agent chan- nel sold the WL with term insurance attached with medical riders as the key product, foreign companies and some middle-sized companies sold medical and cancer insurance through the agency channel. In the same period, the individual annuity insurance focused on the long-term savings feature became more popular. However, the distribution channel of domestic life insurers, which used female sales agents as its core, hardly changed at all.
One of the roles of the regulator in this period was to correct the disad- vantages suffered by policyholders due to the absence of enough information and knowledge. Essentially, the reduction of premium rates and the increase or introduction of policyholder dividends significantly reduced the actual costs of insurance. This basic stance succeeded without major changes, even when the government started discussing innovation of the financial system.
As for improvement of sales practice, the "Three-year Plan for Improve- ment of Life Insurance Solicitation Process" started in 1976 for the purpose of improving the quality of life insurance agents. The plan included more strin- gent recruiting standards and a reinforced education system for sales agents, as well as improvement of new business persistency, all of which encouraged more efficient business management of companies.
3.4. Bubble Economy Period (1985 – 1995)
The 1985 Plaza Accord has been regarded as the trigger for the Bubble Economy in Japan. Yen appreciation advanced quickly, the government reacted and lowered interest rates, and equity and real estate prices shot up.
The expansion of the economy started in December 1986 and continued until February 1991⑷. As the Restriction on Loans Related to Lands and Related Assets (restriction on the total volume of land trading) was announced in 1990, the Bubble Economy started bursting. In this essay, the Bubble Econ- omy refers to both the expansion and the burst of the Bubble Economy.
As the economy expanded, the life insurance business started growing, with a more than 10% annual increase in new business. Supported especially by savings-type products such as single premium endowment and individual annuity, the total assets achieved a significant annual growth increase of 20%
for several years. With the abundant cash, Japanese life insurers—the so- called "the Seiho" — had a dominant presence in London and New York during this period. In addition, companies that started selling these types of saving products earlier than others quickly expanded their business, which changed the long-standing business ranking of companies.
After the bubble burst, the investment yield on assets of insurance com- panies rapidly declined to reflect the downward market, and the "negative spreads" of the high interest rate products that had been sold during the Bubble Economy period appeared. The reduction of the statutory valuation interest rate was executed in 1990 for the first time, followed by additional reductions to the low level that is continuing until today. Still, it did not help the struggling management of life insurers. During the period between April 1997 and March 2001, seven out of twenty Japanese life insurance companies went bankrupt.
The keyword for the finance administration in this period was financial liberalization and globalization. The Japanese Financial Big Bang initiative, announced in 1996, was to ensure transparency of the financial administration according to the market principle, and to execute a structural innovation of the market itself. The government reviewed the financial administration and rules for each financial industry, and then promoted mutual entries between
─────────────────
⑷ Period of expansion under the diffusion index.
different businesses and the healthy growth of the capital market.
Also in the area of insurance administration, the Insurance Business Law was revised in the same year. The key revisions were: (1) promotion of com- petitions and market efficiency by deregulation; (2) sustaining soundness and protection of policyholders' benefits in the case of management crisis; and (3) ensuring fair business management.
4. Analysis of Factors of Business Growth
4.1. Approach
As described in Section 2, the size of the life insurance business grew dramatically in the 50 years after WWII, that is, 8,000 times in business in force and over 10,000 times in total assets. The biggest contributor is assumed to be the recovery and growth of Japan's overall economy. The actual growth rate, excluding the impact of overall economic growth, was 21 times in business in force and 30 times in total assets; this represents a far larger growth than Japan's economy.
In this section, I will use the actual growth rate converted by the GDP growth rate to analyze the historical trend of the life insurance business; on this basis, I present multiple hypotheses to explain the factors of growth, other than the overall economic growth. The factors under analysis include:
the change in the insurance premium paid by people, the increase in the number of households, and the change in the average face amount reflecting the above changes.
For the purpose of avoiding an excessive complication of analysis, the new business in this analysis is limited to that of individuals, and the pre- mium income excludes corporate pension. In addition, the observation period is limited to the start of the high growth period in 1959, and after.
The hypotheses are tested in Section 5.
4.2. Comparison between Life Insurance Premium and National Medical Expenditure
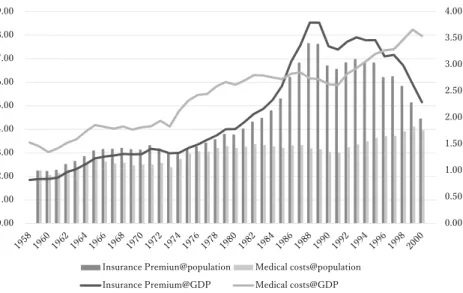
First, I observe the cost borne by households. Figure 6 shows the trend of the ratio of each of premium income and national medical expenditure to GDP, and indices of premium income and the national medical expenditure per citizen (the 1959 value is defined as one, and values in each year are indexed by the growth rate of GDP; hereafter in this section the same shall apply).
During the observation period, the ratio of national medical expenditure to GDP constantly increased, from 3.3% at the start of the period to 8.2% at the end; the growth was 2.5 times. However, the indexed medical cost per head grew to 1.5 times in the high growth period but stayed constant after- wards. Since part of the medical expenditure is paid by households, it is reasonable that the more income households get, the more they pay for medi- cal care. Still, the per-head medical cost stopped growing. This indicates that the growth in medical expenditure until the steady growth period was due to population growth.
On the contrary, the ratio of life insurance premiums to GDP tripled from 1.9% to 5.9% during the period preceding the steady growth period. In this period, the premium trend followed that of the medical expenditure, at approximately 60%. However, in the later stage of the steady growth period, it started to grow at a higher pace than the medical cost, and exceeded it in the Bubble Economy period. As the Bubble Economy burst, the premium income dropped dramatically. The trend of premiums during the Bubble Economy was different from that of medical cost, which indicates that the premium income includes the increase or decrease of saving type products such as individual annuity and single premium endowment. In other words, when savings products are excluded, the life insurance cost borne by house- holds assumedly shows the same trend as the medical cost.
4.3. Historical Trend of Average Face Amount and Case Count of New Business
Next, I analyze the historical trend of new business (NB) volume. As the new business volume is the average face amount multiplied by the new busi- ness case count, I divide the new business volume into the average face amount and the new business case count, and analyze which one of the two contributed more to the growth in new business volume.
Figure 7 shows the historical trend of the indexed average of the actual NB face amount and the indexed NB case count per household (NB case count / number of households). The figure tells a different story from the dramatic growth of the life insurance business demonstrated in Section 2.
The per-household NB case count increased to 1.3 cases in the high
0.00 0.50 1.00 1.50 2.00 2.50 3.00 3.50 4.00
0.00 1.00 2.00 3.00 4.00 5.00 6.00 7.00 8.00 9.00
Insurance Premiun@population Medical costs@population Insurance Premium@GDP Medical costs@GDP
Figure 6. Historical ratios of premium income and national medical expenditure to GDP and indexed per-citizen spending
(Note) Left axis: ratio to GDP; right axis: indexed per-person expenditure based on a 1959 value of 1 (Source) For population: the Five-Yearly National Census by the Ministry of Internal Affairs and the Annual Demographics Statistics by the Ministry of Health, Labor and Welfare; for national medical expenditure: the Overview of National Medical Expenditure by the MHLW.
http://www.mhlw.go.jp/toukei/saikin/hw/k-iryohi/02/toukei1.html
growth period, but continued to decrease slightly ever since, ultimately drop- ping to 0.7 cases after the bubble burst. In other words, the current per- household NB case count is 30% smaller compared to the beginning of the high growth period. On the other hand, although not shown in the figure, an increase in the number of households exceeded the population growth, espe- cially from the high growth period through the steady growth period.
Further, the indexed average of the actual NB face amount increased to 1.7 in 1975, the last year of the high growth period, but stabilized around 1.2 since then. I suppose that the shift of business from savings to protection, that is, from endowment products to endowment with term products to whole life with term products, as well as the decrease in the per-face amount premium as a result of a reduction of the premium rates, were the reasons for the increase of the average face value at a rate that exceeded the GDP
0.60 0.80 1.00 1.20 1.40 1.60 1.80
195919611963196519671969197119731975197719791981198319851987198919911993199519971999 NB case count per household Indexed average of actual NB face amount
Figure 7. Historical trend of indexed average of the actual NB face amount and the indexed NB case count per household
(Note) 1959 values are defined as 1
(Source) Number of households based on the Five-yearly National Census by the Ministry of Inter- nal Affairs. For years with no data, the numbers were pro-rated based on the five-yearly numbers.
growth during the high growth period. As demonstrated earlier, the cost of people during this period did not increase compared to other periods. This indicates that the increase in the average face amount during this period was accomplished by product updates that were repeated in response to the increased demand of people for insurance protection.
In addition, during the Bubble Economy in the late 1980s, the average face amount decreased while the case count increased, which I assume is the impact of single premium endowment products. At the time of the bubble burst in the late 1990s, there was a dramatic decrease in case count, which I think was a result of peoples' reduced trust in life insurance business due to a series of bankruptcies of middle-sized life insurers.
4.4. Historical Trend of In-force Case Count and Per-household In-force Case Count
As the policy period of life insurance is as long as 30 years or even life- long, people can have only one policy during their lifetime, unless they surrender the policy and buy a new one, or buy multiple policies. In this sec- tion, I analyze the historical trend of business in force, following new business.
Figure 8 shows the historical trend of the indexed average actual in-force face amount, indexed average actual premium, and per-household in-force case count (in-force case count / number of households). The case count increased by 1.5 times (from 1.5 cases to 2.3 cases per household) over the 10-year period since 1959, which represents the earlier period of high eco- nomic growth. Afterwards, until the Bubble Economy period, the case count essentially remained stable. Meanwhile, the number of households increased by 1.5 times over the 10-year period from 1959, and continued to increase afterwards. Over the 20 years since 1975, the rate of increase was 1.6. In other words, the growth of the life insurance NB market was due to the increased number of households, and the growth of in-force in the earlier period of high economic growth exceeded the increase in households. The increase in the Bubble Economy period is attributed to single premium
endowment products.
During the analysis period, while the average face amount doubled, the average premium decreased by 30% , which I assume was the impact of the development of more protection-oriented products and a reduction in pre- mium rates, as described earlier. Although the impact on business in force was delayed relative to that on new business, the average face amount con- tinued to increase at a significant level after 1975 when premium rates were lowered dramatically. In light of the average face amount and premium, I suppose that the development of more protection-oriented products and a decrease in premium rates are assumed to be the growth factors of protec- tion products.
5. Empirical Analysis of Hypotheses
In this section, I will conduct an empirical analysis of the factors that I demonstrated through a quantitative analysis in the previous section. The
0.0 0.5 1.0 1.5 2.0 2.5
195919611963196519671969197119731975197719791981198319851987198919911993199519971999 per-household in-force case count indexed average actual in-force face amount indexed average actual premium
Figure 8. Historical trend of indexed actual average in-force face amount, indexed actual average premium, and per-household in-force case count
(Note) 1959 value are defined as 1
t-test is adopted as main methodology, based on a cross-sectional analysis by each single year. According to the factors identified in the previous section, I define six sets of hypotheses for the analysis.
Hypothesis 1: The major contributing factor to the growth of the life insur- ance business in Japan during the 50-year post-war period is the recovery and development of Japan's overall economy, which also applies to the national medical expenditure.
Hypothesis 2: The life insurance business and the national medical expendi- ture expanded by a larger scale than the growth of Japan's economy.
Hypothesis 3: The national medical expenditure and the insurance premium volume expanded in parallel and are significantly correlated with Japan's pop- ulation and number of households.
Hypothesis 4: The increased number of households is the major contributing factor to the growth in national medical expenditure and premium volume at a larger scale than Japan's economy.
Hypothesis 5: The actual amount of business and the number of policies increase more quickly than the expansion of premium income.
Hypothesis 6: The actual in-force amount has increased.
5.1. Recovery and Growth of Japan’s Economy and Expansion of the Life Insurance Business
In this section, I conduct a t-test based on a cross-sectional analysis, with several benchmarks demonstrating the scale of life insurance business as dependent variables and GDP as the explanatory variable.
The null hypothesis states that the regression coefficient is zero. I defined nine dependent variables: Business in Force (BiF), Individual BiF (Ind.
BiF), Number of individual BiF (nind.BiF), Individual New Business (Ind.NB), Number of Individual New Business (nInd.NB), New Business and Conversion (NB+CV), Total Asset (TA), Premium Income (PI), and, Premium Income excluding Corporate Pension (PI-CP). I used 54 samples spread over the
period between 1947 and 2000, and conducted the same analysis on the national medical expenditure (NME).
Table 3 shows the result of a regression analysis. The regression coeffi- cient (R.C.) is positive for all dependent variables, and the p-value is extremely small with significance. In addition, the coefficient of determination (R2) is above 0.85 throughout, except for the NB case count where it is 0.6153.
Therefore, the null hypothesis is rejected.
However, since GDP is assumed to grow according to an exponential curve, the results of Table 3 are considerably affected by the later period of the analysis where values are large. Therefore, I use logarithms of both the dependent variables and the explanatory variable.
As a result, both the p-value and the determination coefficient are more favorable than in Table 3. This indicates not only the rejection of the null hypothesis in the logarithmic expression, but also the stronger correlations between the logarithmic values than the original values.
Table 3. Cross-sectional Analysis with GDP as the Explanatory Variable Dependent Variable R.C. R2 Std Error T-ratio P-value
BIF 4.5018 0.9245 0.1784 25.24 7.57E-31
Ind. BIF 3.5207 0.9345 0.1293 27.24 1.88E-32
nInd.BiF 0.2393 0.9187 0.0099 24.24 5.29E-30
Ind. NB 0.3713 0.9685 0.0093 40.04 9.45E-41
nInd.NB 0.2099 0.6153 0.0023 9.12 2.26E-12
NB+ CV 0.4815 0.9471 0.0158 30.52 7.22E-35
TA 0.4378 0.8589 0.0246 17.79 9.19E-24
PI 0.0786 0.9457 0.0026 30.11 1.41E-34
PI-CP 0.0574 0.9538 0.0018 32.75 2.21E-36
NME 0.0719 0.9734 0.0018 40.82 3.35E-37
(Note) In calculating Number of BiF (nBiF) and Number of Individual New Business (nInd.NB), the unit of GDP is one million yen. Otherwise, the unit is one case or one yen.
In conclusion, all results of the analysis support Hypothesis 1, "the major contributing factor to the growth of life insurance business in Japan during the 50-year post-war period is the recovery and development of Japan's over- all economy, which also applies to growth of the national medical expenditure."
Further, all of the regression coefficients using logarithmic numbers of amount in force, NB amount, total assets, and premium amount are larger than one. This means that the pace of business growth demonstrated by these benchmarks is more rapid than the pace of economic growth demon- strated by GDP, which indicates that other factors supported the insurance business growth beyond the economic growth. The same trend is observed for the national medical expenditure, which supports Hypothesis 2.
5.2. Correlations between National Medical Expenditure and Premium Income
I will analyze correlations between the national medical expenditure, pre- Table 4. Cross-sectional Analysis with GDP as Explanatory Variable (Logarithm) Dependent Variable R.C. R2 Std Error T-ratio P-value
BIF 1.6431 0.9961 0.0142 115.74 2.06E-64
Ind. BIF 1.5929 0.9956 0.0147 108.32 6.34E-63
nInd.BiF 0.3599 0.9438 0.0122 29.55 3.54E-34
Ind. NB 1.3079 0.9856 0.0219 59.73 1.37E-49
nInd.NB 0.3080 0.7532 0.0245 12.60 2.00E-17
NB+ CV 1.4255 0.9621 0.0392 36.32 1.26E-38
TA 1.6279 0.9851 0.0278 58.62 3.57E-49
PI 1.4299 0.9910 0.0189 75.71 6.97E-55
PI-CP 1.3695 0.9912 0.0179 76.47 4.15E-55
NME 1.2070 0.9972 0.0095 126.95 3.81E-59
(Note) In calculating Number of BiF (nBiF) and Number of Individual New Business (nInd.NB), the unit of GDP is one million yen. Otherwise, the unit is one case or one yen.
mium income, population, and GDP for the purpose of validating Hypothesis 3.
Table 5 shows the calculation results. I used 42 samples during the period after the high economic growth period, from 1954 to 2000. The calculation result shows extremely strong correlations between all benchmarks, which supports Hypothesis 3, "the national medical expenditure and the insurance premium volume expanded in parallel and are significantly correlated with Japan's population and number of households."
However, the results in Table 5 tend to demonstrate distorted correla- tion results, since GDP results in an excessive impact on the national medical expenditure and premium income. To prevent this, I used the medical expen- diture and premium income indexed by GDP in calculating their correlations with population size and number of households, which are shown in Table 6.
Compared with Table 5, Table 6 shows lower correlation coefficients between premium income and population / households, that is, 0.9160 and 0.9258 ver- sus 0.8899 and 0.8856. This is in sharp contrast with the correlation of the national medical expenditure with population / households.
The next is the correlation coefficients when the analysis period is nar- rowed to the 26 years between 1959 and 1984. The results in Table 7 show again larger correlation coefficients between premium income and population / households. The correlation with population / households is so strong for both national medical expenditure and premium income that they are almost dependent. The results also show significant correlation between national medical expenditure and premium income.
These results led me to assume that consumers view the payment of premiums as equivalent to the payment of medical expenditure. As I observed under the section 4.1., Comparison between Life Insurance Premium and National Medical Expenditure, the medical cost is a regular household expenditure and reasonably increases as the household income increases.
Table 5. Correlation Coefficients between Premium Income, National Medical Expenditure, Population, Number of Households, and GDP (1959 ‒ 2000)
PI-CP NME PPL Household GDP
PI-CP 1.0000
NME 0.9520 1.0000
PPL 0.9160 0.9410 1.0000
Household 0.9258 0.9628 0.9953 1.0000
GDP 0.9729 0.9857 0.9700 0.9789 1.0000
(Note) The unit is one case or one yen.
Table 6. Correlation Coefficients between Indexed Premium Income / National Medical Expenditure and Population / Number of Households (1959 ‒ 2000).
PI-CP NME PPL Household
PI-CP 1.0000
NME 0.8103 1.0000
PPL 0.8899 0.9586 1.0000
Household 0.8856 0.9692 0.9953 1.0000
(Note) 1959 values are defined as 1. Each year's number of PI-CP and NME are divided by GDP growth rate.
Table 7. Correlation Coefficients between Indexed Premium Income / National Medical Expenditure and Population / Number of Households (1959 ‒ 1984)
PI-CP NME PPL Household
PI-CP 1.0000
NME 0.9388 1.0000
PPL 0.9225 0.9715 1.0000
Household 0.9381 0.9684 0.9977 1.0000
(Note) 1959 values are defined as 1. Each year's number of PI-CP and NME are divided by the GDP growth rate.
5.3. Actual National Medical Expenditure, Premium Income, and Increase in Population and Number of Households
Hypothesis 4 is verified in the section 5.3. In the cross-sectional analysis, dependent variables are the actual national medical expenditure and pre- mium income, explanatory variables are population and the number of households, and the null hypothesis states that the regression coefficient is zero. However, as the correlation coefficient between population and the number of households is significantly high, to the extent that multicollinearity is generated, it is impossible to conduct a multiple regression analysis. There- fore, I executed simple regressions for each of the variables population and number of households. I used 42 samples between 1954 and 2000, and then used the national medical expenditure and premium income indexed based on GDP growth.
Table 8 demonstrates the results of the regression analysis. All regres- sion coefficients are positive for all dependent variables, and the p-value is extremely small, with significance. Therefore, the null hypothesis is rejected.
The regression coefficient on population is 3.2647 for medical expenditure and 5.6153 for premium income, which means that the increase in the actual medical expenditure and premium income is far larger than the population growth. In other words, the actual medical cost and premium per capita is increasing. On the other hand, the regression coefficient on the number of households is low, 1.0220 for medical expenditure and 1.7297 for premium income, which indicates that the actual medical cost per household is almost constant.
Further, the growth rate of per-household actual premium is lower than the growth rate of per capita actual premium. This supports Hypothesis 4,
"the increased number of households is the major contributing factor to the growth in national medical expenditure and premium volume at a larger scale than Japan's economy."
Further, while the determination coefficients of actual medical expendi- ture are 0.9 or above, those of actual premium income are slightly lower, at
0.7920 and 0.7842. When the analysis period is narrowed to the 26 years between 1959 and 1984, that is, the high and steady economic growth periods, the determination coefficient of the number of households for actual premium income improves to 0.8801. Also during this period, the regression coefficient of the number of households on the actual premium is 1.2137, which is smaller than 1.7297—the number for the extended period including the bubble econ- omy. This indicates that the phenomenon of Hypothesis 4 is more applicable to the high and steady economic growth periods (1959 ‒ 1984).
Based on the above result, I can assume that while the medical expendi- ture completely correlates with Japan's economy and number of households, the growth of premium income exceeded them. I believe that penetration is
Table 8. Cross-sectional Analysis of National Medical Expenditure and Premium Income with Population and Number of Households
as Explanatory Variables (1959 ‒ 2000)
D.V. E.V. R.C. R2 Std Error T-ratio P-value
NME PPL 3.2647 0.9189 0.1534 21.29 1.98E-23
Household 1.0220 0.9393 0.0411 24.88 5.91E-26
PI-CP PPL 5.6153 0.7920 0.4550 12.34 3.22E-15
Household 1.7297 0.7842 0.1435 12.06 6.74E-15 (Note) 1959 values are defined as 1. Each year's value for NME and PI-CP are divided by GDP growth rate.
Table 9. Cross-sectional Analysis on National Medical Expenditure and Premium Income with the Number of Households as Explanatory Variable (1959 ‒ 1984)
D.V. E.V. R.C. R2 Std Error T-ratio P-value
NME Household 1.0624 0.9378 0.0559 19.02 5.59E-16
PI-CP Household 1.2137 0.8801 0.0914 13.27 1.51E-12 (Note) The 1959 values are defined as 1. Each year's value for NME and PI-CP are divided by the GDP growth rate.
the factor for the growth in premium income at a rate higher than both that of Japan's economy and the number of households. While the medical expen- diture is an essential part of household spending, insurance is not. As the number of nuclear families kept increasing during the economic growth and steady growth eras, more people became aware of the necessity of insurance and bought policies.
5.4. Increase in the business case count and the number of households I verify Hypothesis 5. First, I use a cross-sectional analysis to confirm that, as for the case of premium income, the increase in the number of house- holds is the major factor for the growth of business amount and the number of policies exceeding the growth of Japan's economy. As for the section 5.3., dependent variables are the actual values of the new business amount, amount in force, new business case count, and in force case count; explana- tory variables are population and the number of households. The simple regression was executed on each explanatory variable. The null hypothesis states that the regression coefficient is zero. As for the section 5.3., I used 42 samples from the period between 1954 and 2000. The regression analysis results are demonstrated in Table 10. Therefore, the null hypothesis is rejected.
The business amount in-force and in-force case count have high determi- nation coefficients of 0.9 or above, which indicates a considerable impact of the number of households. On the contrary, the determination coefficients of new business and NB case count are low at 0.6051 and 0.7144, respectively, which suggests that factors other than population and households affect these. For all of the dependent variables, the regression coefficient is larger than 2, as for the case outlined in the section 5.3., which shows that both the actual amount and the actual case count have increased per person. As for business in-force, both the amount and the case count show lower regression coefficients than those of population, and the determination coefficient and p-value are both high. In other words, in-force business is more strongly cor-
related with the increase in the number of households than with the increase in population.
In addition, the determination coefficient of the number of households on the actual premium and on the in-force case count are 1.2137 and 2.3075, respectively, which means the increase of per-household policy count is larger than the increase in actual premium amount paid by a household. In conclu- sion, Hypothesis 5, "The actual business amount and the number of policies increase more quickly than the expansion of premium income," is valid for business in force.
It is difficult to say that penetration is the only reason for the increase in the in-force case count exceeding the increase in the actual premium. On top of the penetration, I believe that another reason is development and dissemi- nation of insurance products that are low cost and addressing diversified needs, for example, medical insurance and cancer insurance. In 1959, at the beginning year of my analysis, per-household policy count is 1.4, which means if averaged, all households already had insurance.
Table 10. Cross-sectional Analysis of New Business and Business in force with Population and the Number of Households as Explanatory Variables (1959 ‒ 2000)
D.V. E.V. R.C. R2 Std Error T-ratio P-value
nInd.NB PPL 2.4090 0.6453 0.2824 8.53 1.53E-10
Household 0.7221 0.6051 0.0922 7.83 1.35E-09
NB+ CV PPL 5.7660 0.7144 0.5765 10.00 1.92E-12
Household 1.7046 0.6516 0.1971 8.65 1.07E-10
nInd.BiF PPL 7.3860 0.9123 0.3622 20.39 9.57E-23
Household 2.3075 0.9292 0.1007 22.92 1.29E-24
Ind. BIF PPL 19.8135 0.9000 1.0442 18.98 1.31E-21
Household 6.2349 0.9301 0.2703 23.06 1.02E-24 (Note) 1959 values are defined as 1. Each year's value for NB+CV and Ind. BIF are divided by the GDP growth rate.
In addition, the determination coefficient of the number of households on the NB case count is 0.7221. The reason for this low number needs to be ana- lyzed in conjunction with the reason for the decreased in-force case count, such as surrender or lapse, as well as policy conversion. I analyze the rela- tionship between the face amount and the number of policies in the section 5.5.
5.5 Trend of Average Face Amount
Finally, I verify Hypothesis 6. In the cross-sectional analysis, dependent variables are the actuals of new business amount and in-force business amount, explanatory variables are new business case count and in-force case count, and the null hypothesis states that the regression coefficient is zero.
The result of the regression analysis is demonstrated in Table 11. All regression coefficients are positive for all dependent variables, and the p-value is extremely small, with significance. Therefore, the null hypothesis is rejected. However, as for the section 5.4., I will conduct the analysis only on business in force, because the determination coefficient on new business is low at 0.7251.
Since the regression coefficient is 2.6509 and greater than 1, the average face amount in actual in reality increases. In conclusion, Hypothesis 6, "The actual in-force amount has increased," is valid.
During the analysis period, the ratio of determination coefficients Table 11. Cross-sectional Analysis of Business Amount with Number of Policies
as the Explanatory Variable
D.V. E.V. R.C. R2 Std Error T-ratio P-value
NB+ CV nInd.NB 1.2699 0.7251 0.1236 10.27 8.84E-13
Ind. BIF nInd.BiF 2.6509 0.9634 0.0817 32.46 2.33E-30 (Note) 1959 values are defined as 1. Each year's value for NB+CV and Ind. BIF are divided by the GDP growth rate.