Does CEO learning improve takeover success?
Nguyen Duc Giang (Waseda University)
JSPS Core-to-Core Program Waseda Institute for Advanced Studies
Waseda, Corporate Governance Research
WORKING PAPER Series
WCG WP #2016-005
ABOUT JSPS CORE-TO-CORE PROGRAM
This work was supported by “Core-to-Core Program, A. Advanced Research Networks” of Japan Society for the Promotion of Science (JSPS).
The main objectives of “Core-to-Core Program” are to create world-class research hubs in the research fields, and to foster young researchers through building sustainable collaborative relations among research/education institutions in Japan and around the world.
As a research hub in Japan for the project titled “Creation of a Research Hub for Empirical Analysis on the Evolving Diversity of Corporate Governance: Multidisciplinary Approach Combining Economics, Legal Studies and Political Science” which was selected for “Core-to-Core Program”, Waseda Institute for Advanced Studies (WIAS) works together with its overseas counterparts: University of Oxford (UK), Ecole des Hautes Etudes en Sciences Sociales (EHESS) (France), University of British Columbia (UBC) (Canada). Through strengthening the research networks, developing analysis methods, adopting a multifaceted international approach and promoting the joint use of basic data, this project aims to achieve remarkable advancements in empirical analysis of the economic systems associated with corporate governance.
Does CEO learning improve takeover success?1 Nguyen Duc Giang2
Graduate school of Economics Waseda University
1102, Building No. 3, 1-6-1, Nishi-Waseda, Shinjuku, Tokyo, Japan Email: [email protected]
Tel: +81-90-8891-6889 This draft: September, 2016
ABSTRACT
CEO learning theory suggests that by completing more acquisitions and improving bidding skills, CEO completes the prospective bid more successfully. This paper tests the CEO’s learning process in acquisition programs. Empirical evidence uncovers a positive relation between CEO’s accumulated learning experience and the takeover probability of success. And the effect of CEO learning on transaction outcome remains economically and statistically significant after controlling for CEO’s inherent abilities. I also confirm that CEO listens to the market reactions when making acquisition decisions, but the effect of listening during acquisition is lower when CEO is more experienced. Importantly, the cross-section analysis of deal announcement returns and bid premiums suggests that CEOs tend to select deals that create more wealth to shareholders and pay higher premium to takeover targets when they have higher levels of experience.
JEL: G34
Keywords: CEO learning; competence; the probability of success; deal announcement returns;
acquisitions programs.
1 I would like to thank Yoshiaki Ogura, Yishay Yafeh, Kazunori Suzuki, Vikas Mehrotra, Chih- Wei Peng, Hideaki Miyajima, and seminar participants at The 28th Asian Finance Association meeting and JSPS Core-to-Core Program workshop (INCAS-2nd workshop) for helpful comments.
I also thank Konari Uchida for his important and supportive discussion at the 40th Japan Finance Association meeting. I gratefully acknowledge the travelling grant from Waseda Institute for Advanced Study (WIAS).
2 Corresponding author
1. Introduction
Academic literature frequently discusses the central role of Chief Executive Officers (CEOs) in merger and acquisition (M&A) process. CEO’s personal characteristics have been recognized as important determinants of firms’ management style (Bertrand & Schoar, 2003; Kaplan, Klebanov, & Sorensen, 2012), especially in the management of large investments such as M&As (Bao & Edmans, 2011; Custodio & Metzger, 2013; Park, 2003; Yim, 2013). CEOs are believed to learn during the process of making serial acquisitions (Aktas, de Bodt, & Roll, 2009, 2011, 2013; Kau, Linck, & Rubin, 2008; Luo, 2005). Intuitively, they draw more accurate inferences about takeover targets based on experience gained from previously completed transactions, and as a result, they complete potential bids successfully and profitably (Aktas et al., 2009).
CEO gains different sources of benefits when takeover bids succeed, such as fame (Avery, Chevalier, & Schaefer, 1998), empire building or compensation (Grinstein & Hribar, 2004). They also face threats of being disciplined for undertaking poor quality bids (Lehn & Zhao, 2012) and failing to acquire desired takeover targets. For example, Ed Krell, who has been the CEO of Destination Maternity for over a decade, will be stepping down as the CEO of the maternity and kid’s wear retailer after a sequence of failed attempts to take over Mothercare.3 Zurich Insurance’s chief, Martin Senn, has resigned under pressure of the failed takeover of Britain's RSA and stumbling performance in its core business.4 Electrolux reports that its Chief Executive Keith
3 Strydom, Martin “Ed Krell quits as Destination Maternity chief after failed Mothercare approach and profits warning.” The Telegraph, August 11, 2014, Business.
4 Armstrong, Ashley. “Zurich Insurance chief executive Martin Senn steps down”. The Telegraph, December 1, 2015, Business.
---
McLoughlin will be forced to step down after the Swedish company's bid to take over the appliance division of General Electric failed.5 Strict penalties and appealing compensation packages motivate CEO to learn and complete potential transactions.
Empirical investigation of CEO learning in M&A process is challenging because its associated influence is not directly observable; it is a latent variable in econometric modelling. To overcome this problem, I utilize the CEO learning model of Aktas et al. (2009) in the context of serial acquisitions. The model assumes that financial market reflects investor reactions in stock price during the announcement of M&A transactions. CEO receives such feedback and revises his own prediction about potential synergies with other targets. Given that CEO learns from completed transactions through market feedback, the model indicates a positive relation between the number of previously consummated transactions, which represents CEO’s accumulated learning experience (ALE), and the outcome of prospective transactions.
In order to capture the effect of CEO learning on the takeover probability of success, I examine CEOs who announce serial transactions, i.e., acquisition programs at firm-CEO level. This sample of multiple transactions allows us to hold characteristics of the acquirer constant while examining the effect of CEO’s accumulated learning experience on the outcome of takeover transactions. We, therefore, can infer the causal relation between CEO learning and transaction outcome without being affected by the new information from the acquirer.
I collect a sample of 2785 serial transactions during the period 1992-2012. Probit regressions uncover a positive and statistically significant relation between CEO learning and the takeover
5 Chopping, Dominic and Zander, Christina. “Electrolux CEO Keith McLoughlin Quits A Month After Collapse of GE Deal.” The Wall Street Journal, January 11, 2016, Business.
probability of success. Specifically, holding all other factors at mean, the likelihood of success increases 29% when CEO’s accumulated learning experience increases from zero to five. I separate the effect of CEO learning from CEO competence by decomposing the outcome of the first transaction of acquisition programs into predicted success and success residuals which represent a proxy for CEO’s unobservable competence. Empirical evidence shows that CEO competence is an important determinant of transaction outcome; however, it does not affect the significant effect of CEO learning. I also confirm the learning during acquisition hypothesis that CEO listens to the market reactions when making a takeover decision. However, the positive effect of deal announcement returns on transaction outcome is lower when CEO has a higher level of experience.
Additional analyses of deal announcement return and bid premium suggest that CEOs tend to pay higher premium to takeover targets and select deals that create more synergy wealth when they more experienced. Specifically, CEO pays 1,2%(0.5%) more premium to the prospective target when he completes one more transaction. This finding supports the learning theory that CEO bids more accurately after completing more transactions, as a result, he pays higher premium to the target due to its lower valuation risk. In addition, as ALE increases by one, the total cumulative abnormal returns of the target and the acquirer around the announcement date increase by 0.7%(0.3%), suggesting that higher experienced CEOs choose deals that generate higher synergy.
I contribute to the literature of M&A in three aspects. Firstly, I identify the influence of CEO’s accumulated learning experience on the outcome of prospective transactions by testing the empirical prediction of Aktas et al. (2009)’s model. I support the channel through which CEO improves the transaction success by analyzing bidding premiums. Secondly, I separate the effect of CEO learning from the effect of CEO’s unobservable competence which can also cause the
--- --
persistence of success in acquisitions programs. Thirdly, literature documents two types of learning, learning during acquisition (Kau et al., 2008; Luo, 2005) and learning from past acquisitions (Aktas et al., 2009, 2011, 2013; Hayward, 2002). These two types of learning can simultaneously affect the transaction outcome. I, therefore, distinguish the latter from the former by employing the empirical approach of Luo (2005) to control for deal announcement returns.
I organize the remaining part of the paper as follows. I present the review of literature and hypothesis development in Section 2. In Section 3, I describe econometric modeling and sample selection procedure. Section 4 provides main empirical results. Various robustness tests are conducted in Section 5. Section 6 concludes the paper.
2. Literature review
2.1 Determinants of takeover success
Following M&A literature, I identify a set of target characteristics that affect the transaction outcome including target size (Ambrose & Megginson, 1992; Baker, Pan, & Wurgler, 2012;
Comment & Schwert, 1995; Luo, 2005; Palepu, 1986), bidding premium (Heron and Lie, 2006, 2015), sales growth rate (Comment & Schwert, 1995; Field & Karpoff, 2002; Schwert, 2000;
Sokolyk, 2011), leverage (Daines, 2001; Schwert, 2000; Sokolyk, 2011), similar industry classification (Flanagan, D'Mello, & O'Shaughnessy, 1998; Henry, 2004).
Deal characteristics also affect the takeover probability of success. Specifically, the deterrence effect of takeover defense tactics is consistently identified (Ambrose & Megginson, 1992; Field &
Karpoff, 2002; Sokolyk, 2011). In addition, competition from other bidders is likely to reduce the probability of success (Flanagan et al., 1998; Holl & Kyriazis, 1997; Walkling, 1985). However, tender offer strategy effectively increases the takeover probability of success (Baker et al., 2012;
Bates & Lemmon, 2003; Betton, Eckbo, Thompson, & Thorburn, 2014; Kau et al., 2008).
Financing structure of the deal is also identified as an important determinant of the transaction outcome (Baker et al., 2012; Luo, 2005; Sokolyk, 2011). Some authors examine the importance of market reactions in the CEO’s decision process to complete a takeover transaction (Kau et al., 2008; Luo, 2005). To my knowledge, the effect of CEO learning from past acquisitions remains
unexplored.
2.2 Review of CEO learning in M&A context
The learning-by-doing terminology refers to the hypothesis that accumulated work experience, especially the repetition of the same type of action, improves workers’ productivity and adds to technical knowledge. According to the management literature, CEO of acquiring firms has abilities to learn from past acquisition experience (Harding & Rovit, 2004; Hayward, 2002). By completing takeover transactions, CEO forecasts the potential synergy of prospective deals more precisely, and targets turn to be less risky (Aktas et al., 2009). Deighton (2006) finds that CEO bids more accurately when he has higher levels of experience, i.e., the CAR’s variance significantly falls from deal to deal.
Researchers postulate two types of CEO learning in M&A process. The first type is learning from past transactions. Hayward (2002) supposes that the relationship between the current acquisition’s performance and similarities of its businesses with the prior acquisition’s businesses shows an inverted-U shape. According to the hypothetical inverted-U shape, Aktas et al. (2013) derive a theoretical model predicting that under experience building curve, the time between deals strictly decreases with deal orders while under memory loss effect, elapses between consecutive deals increase significantly. Using a massive data set, they show evidence of CEO learning through repetitive acquisitions, especially when successive deals share significant similarities. In addition, Aktas et al. (2009) theoretically predict that CEO’s past experience has a correlation with his
---
current experience. Aktas et al. (2011) then empirically find that price premium or short-run CARs of the previous deal positively relates to the CARs of the current deal.
The second type of CEO learning is learning during the acquisition process. This type of learning refers to CEO who listens to the response of outsiders and decides whether a transaction should be consummated. Luo (2005)’s model implies that if CEO acts in the interests of shareholders, when stock market reacts positively, the transaction will be completed. He then uses the aggregate stock returns of both target and acquirer as an explanatory variable for the transaction outcome. Kau et al. (2008) confirm that managers listen to the market when making major investment decisions, although they only use bidders’ returns. They show that managers’
propensity to learn is high when their interests are aligned with stockholders.
My paper is different from Aktas et al. (2011) in the sense that it concentrates on the takeover likelihood of success to test the learning theory of Aktas et al. (2009) rather than focusing on the serial correlation of acquisition premiums. In addition, my paper examines CEO’s accumulated learning experience rather than the learning during acquisition period identified by Luo (2005) and Kau et al. (2008), and the learning by observing hypothesis of Francis, Hasan, Sun, and Waisman (2014) in that observing actions of other acquiring peers will help firms make better acquisition decisions and create values to shareholders.
2.3 CEO learning model
The CEO learning model of Aktas et al. (2009) presumes that financial market reflects investor reactions in stock price during the announcement of acquisition transactions. CEO gains experience from such signals and subsequently updates his bidding strategy. Particularly, CEO receives market feedback and revises his predictions about the synergistic value with other takeover targets. I define !", the number of previously completed deals (from time 0 to time # −
1), as accumulated learning experience. CEO forecasts more accurately about the synergy of prospective acquisitions after completing more transactions, asymptotically, the variance of synergy, &',") , decreases when !" increases. I define:
&',") = 1
&',+) + !" 1
&-)
./
(1) where &-) is the variance of the signals received from the financial market. Taking derivation of &',") with respect to !", we have:
01052,34
3 = − 1/
2,64 + !"1/
74
.) /
174 < 0 (2)
The probability of success of :;<= = >?(:;<= wining a bid) = >? :;<= valuation>
:;<B valuation = CD::EF∗ H=∗ H=∗ , where CD::EF∗ H=∗ H=∗ is the distribution of :;<B′J reservation value, HB∗, conditional on :;<=’s reservation value. KEF H=∗ H=∗ is the corresponding density function.
The probability of winning the competition with respect to !" is:
LCD::EF∗ H=∗ H=∗
L!" = KEF H=∗ H=∗ LH=∗
L&',") L&',")
L!" (3)
One direct result from the optimal H=∗: LH=∗
L&',") < 0 (4)
The intuition behind Equation 4 is that for a risk averse CEO, when the perceived variance of his expected bonus increases, his reservation value will decrease. In other words, CEO pays higher price for a takeover target when the valuation risk of the bid is low.
From (2), (4) and KEF H=∗ H=∗ > 0, Equation 3 implies:
---
LCD::EF∗(H=∗|H=∗)
L!" > 0 (5)
Equation 5 proposes that the number of previously completed transactions (ALE) positively influences the likelihood of success of the prospective bid, and this theoretical relation can be tested in the context of repetitive acquisitions at firm-CEO level.
3. Methodology and sample selection 3.2 Econometric modelling
I employ a binary bivariate probit model to specify the functional relationship between the probability of success, CEO learning, and target and deal characteristics. I model the underlying transaction outcome as a linear function of CEO’s learning experience and other explanatory variables:
CD::="∗ = P!="+ Q="R + S=", (6)
where !=" represents CEO’s accumulated learning experience. Q=" is a set of variables representing deal and target characteristics. S=" is assumed to have a standard normal distribution.
Although CD::="∗ is unobservable, the bidding outcome is fully observed. I define CD::=" as
CD::=" = 1 TK CD::="∗ > 0
0, U#ℎW?XTJW
I utilize the binary probit model to estimate the probability of success:
>?UY=" = >?U CD::=" = Z(P!="+ Q="β) (7) in that P reflects the effect of CEO learning on the takeover probability of success.
3.2 Sample selection
I follow Fuller, Netter, and Stegemoller (2002), Billett and Qian (2008), and Antonio, Rau, and Aris (2013) to collect a sample of repetitive acquisitions announced by U.S. acquirers during the period 1992-2012. I require that both targets and acquirers are public firms. I drop all firms operated in financial and utility industry.6 I then exclude all deal duplications identified by deal number in the SDC database. In order to identify acquisition programs at firm-CEO level, I match the acquisition database with the ExecuComp database using company identifier, CUSIP.
Specifically, I first merge the SDC database with CRSP daily database using announcement dates and historical CUSIP, i.e., NCUSIP to identify CUSIP and PERMNO identifier. Subsequently, I match the merged dataset with ExecuComp database.
I define an acquisition program as CEO announces at least two transactions within five years, starting from the first deal. I exclude all programs that belong to the period 1992-2012 and have transactions between 1990-1992 and 2012-2014. After cleaning data, I obtain a comprehensive sample of 2785 observations which belong to 844 acquisition programs, spanning the period 1992- 2012. I also keep the remaining sample of 1161 single transactions that do not belong to any programs in order to compute the industry year rate of success in Section 4. The description of all variables are shown in Appendix 1. I winsorize all continuous variables representing target characteristics at 1% and 99% to minimize the impact of outliners.
Insert Table 1 here
6 I classify bidders and targets into 48 industry portfolios defined by Fama and French (1997) based on 4-digit SIC codes. Definition of the industry groups can be retrieved from Kenneth French’s website.
---
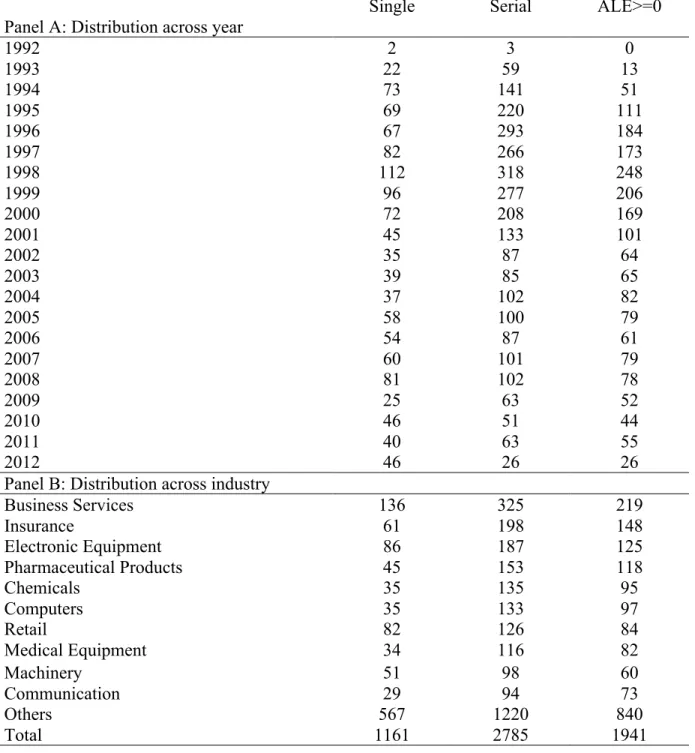
Table 1 provides the sample distribution of takeover transactions announced during the period 1992-2012 across year and industry. Column 3 shows that, M&A activity is intense during the period 1995-2000. Particularly, each year witnesses more than 200 transactions announced by serial bidders, and this intensity is consistent with the M&A wave recognized by Arikan and Stulz (2016). Of all transactions, a vast majority is announced by serial acquirers, which accounts for approximately 71% of all transactions. Table 1 also presents the distribution of top ten industries ranked by the number of transactions including Business Services, Insurance, Electronic Equipment, Pharmaceutical Products, Chemicals, Computers, Retail, Medical Equipment, Machinery and Communication. The Business Services industry has the highest number of serials acquisitions which accounts for 8.24% of all transactions.
Insert Table 2 here
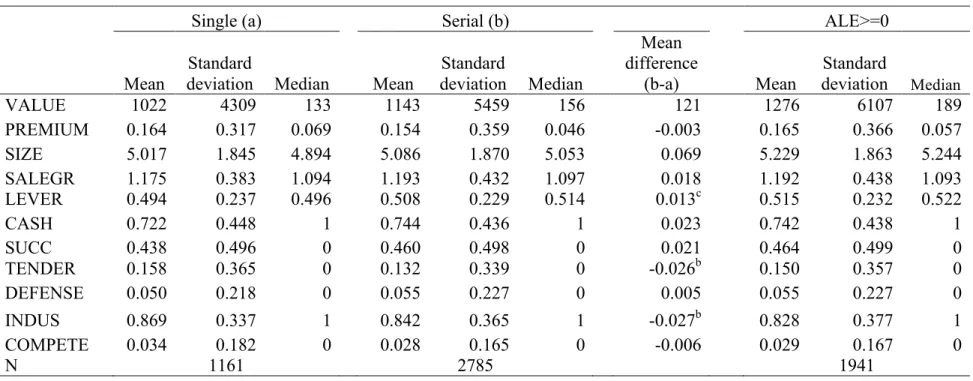
Table 2 compares statistics between the sample of single and serial transactions. It also presents the descriptive statistics of 1941 transactions that have information of historical CEO learning experience. About target characteristics, single transactions have deal size, on average, of 1022 million (4309). Transactions conducted by serial bidders have similar size of 1143 million on average, but they show a substantially higher standard deviation of 5459 million. Single and serial bidders share similar sales growth rate of 17.5% and 19.3%, respectively. However, serial bidders target firms that have a high level of debts. Specifically, deals announced by serial bidders has a debt ratio of 0.51, while those firms targeted by single bidders has a debt ratio of 0.49.
Serial bidders are less likely to diversify. Table 2 shows that 84% of bidders operate in similar industries with the target. Tender offer strategy is used more popularly by single bidders. 16% of single transactions receives a tender offer compared to the ratio of 13% in the sample of multiple transactions. 74% of serial acquisition is financed by cash. 46% of them is successfully completed,
and 5.5% adopts at least one defensive tactic against the acquirer, while 2.8% has more than one bidder. The sample that has complete information of CEO learning experience shows similar summary statistics with the sample of serial transactions.7
Insert Table 3 here
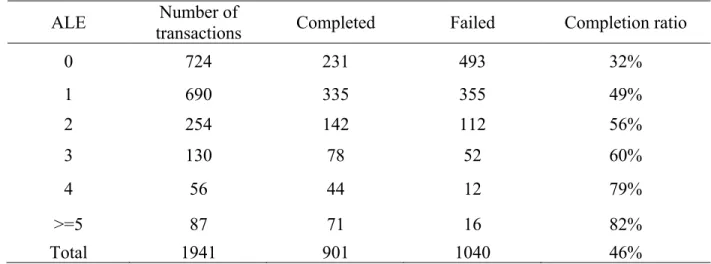
Table 3 summarizes the outcome of serial acquisitions according to different levels of CEO learning experience. It appears that the more deals CEO completes, the higher the unconditional probability of success is. CEO, who has no historical experience, has the unconditional probability of success of 32%, while CEO, who previously completes equal or more than five bids, has a success ratio of 82%. The steady increase of the completion rate across each level of ALE is consistent with the prediction of CEO learning theory. Remarkably, the success rate of serial bidders who have no experience is significantly lower than that of single bidders.
4. Results
4.1 CEO learning and takeover success
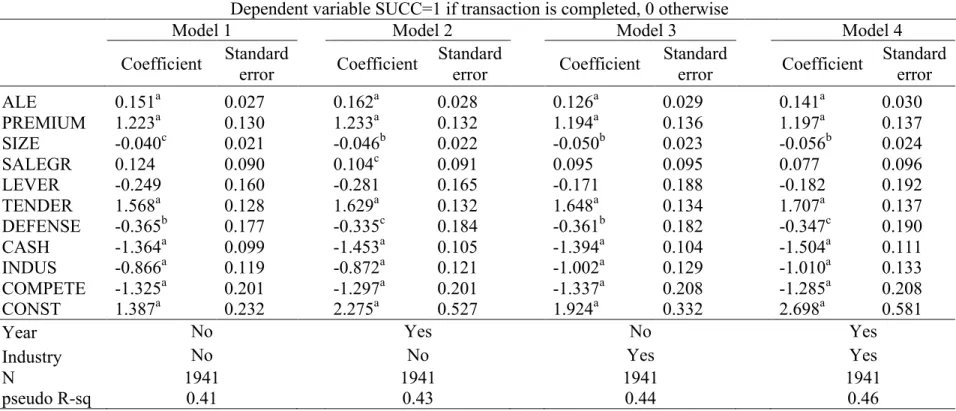
Table 4 provides probit regressions of transaction outcome on ALE and other control variables representing firm-deal characteristics. The key explanatory variable, ALE, is the number of transactions CEO previously completes in acquisition programs. The dependent variable, SUCC, equals one if the transaction status is defined as “Completed” in the SDC M&A database.
Definition of all control variables is shown in Appendix 1. My hypothesis predicts that ALE positively affects the success probability of M&A transactions, i.e., the more transactions CEO
7 It is noted that of 844 programs, 844 transactions ranked 1st have missing information about CEO’s historical learning experience.
--- --
consummates, the more experience they gain, and the more likely that the prospective transaction is completed.
Model 1 does not control for year and industry. Model 2 controls for year. Model 3 controls for industry. Model 4 controls for both year and industry. The coefficient of ALE in Model 1 is 0.151 (0.027) and statistically significant at 1%, suggesting that CEO learning increases the takeover probability of success. This evidence coheres with the increase of completion ratio across levels of ALE shown in Table 3. In addition, the effect of ALE remains positive and statistically significant to the inclusion of year and industry despite a slight reduction in Model 2, 3, and 4. To understand the economic significance of ALE, I compute the marginal effect of all variables at means for Model 1 (see Appendix 2). It suggests that when ALE increases one, the predicted probability of success increases by 6%(1.1%), holding other factors at mean. Similar calculation also shows that the estimated difference is 29% when ALE changes from zero to five. Although, it is difficult to tell how this significant increase transfers into actual transaction outcome, the evidence strongly supports the CEO learning theory in that ALE positively affects the outcome of the prospective transaction.
Insert Table 4 here
As expected, Table 4 shows that the likelihood that a takeover is completed is higher if the offer premium increases. SIZE is statistically significant at 1%, suggesting that targets with larger size are less vulnerable to takeovers (Field & Karpoff, 2002). In addition, probit regressions indicate no evidence supporting the argument that targets add debts to avoid takeovers (Schwert, 2000).
Tender offer strategy is identified as an effective method to increase the probability of success.
However, defensive tactics effectively deter takeover attempts. Consistent with Luo (2005), I find a negative and statistically significant effect of cash on transaction outcome. In addition,
transactions within industries are less likely to be completed. This evidence suggests that anti-trust authorities may have special interests in preventing anti-competitive combinations. Alternatively, the target’s management board might deter all bids that come from rivals because they already own sufficient knowledge to manage the target (Flanagan et al., 1998). Additional bidders for a given takeover target also reduce the likelihood that the current offer is close.
4.2 CEO learning and competence
From the empirical evidence in Table 4, we interpret the positive effect of ALE on the takeover probability of success as evidence of CEO learning from previous acquisitions. However, CEO’s inherent abilities could also generate persistence of success in acquisition programs. In order to differentiate between the effect of ALE and CEO competence, I utilize Gompers, Kovner, Lerner, and Scharfstein (2010)’s two-stage methodology. I decompose the success probability of the first transaction in acquisition programs into two parts. The first part is predicted by the observable firm-deal characteristics and industry year rate of success, and the second part is the remaining residuals (first-staged regression). The latter can be interpreted as a factor including CEO competence. I then regress the outcome of the later transactions in acquisition programs on CEO learning and competence, as well as an interaction between them (second-staged regression).
Insert Table 5 here
In order to estimate CEO competence, I first generate industry year rate of success (IYRS) as the average completion ratio of takeover transactions of each year and industry during the period 1992-2012. It is noted that the first transaction in acquisition programs is properly excluded from the calculation of IYRS to prevent any sort of “hard-wiring relationship”. I regress the outcome of the first transaction in acquisition programs on the industry year rate of success and other target- deal characteristics. The residuals of this regression are considered as an indirect measurement of
--- -
CEO competence (INABS). It represents a part of takeover success that cannot be explained by being involved in an easy takeover market or selecting right targets.
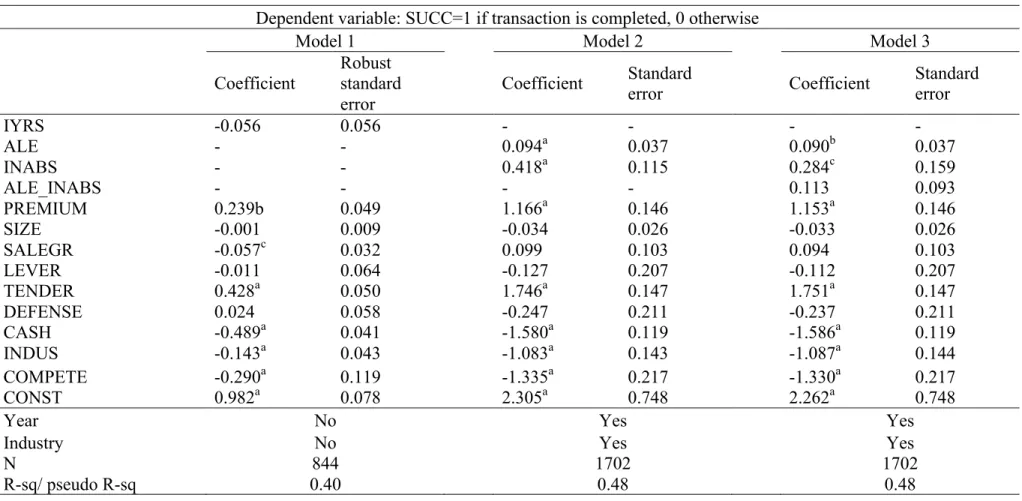
Table 5 shows the estimation results of the first-staged and the second-staged regressions.
Model 1 presents OLS estimation of the first transaction’s outcome with heteroskedasticity-robust standard errors. IYRS is negative and statistically insignificant. This means participating in an easy market with good timing skills does not increase the takeover likelihood of success. Model 2 displays the output of the probit regression of SUCC on INABS, ALE and other control variables.
INABS is positive and statistically significant at 1%, indicating that CEO competence is an important determinant of takeover success. However, the effect of the CEO learning experience remains positive and statistically significant, even after controlling for CEO competence. Model 3 includes an interaction term between INABS and ALE to capture the effect of CEO learning conditional on different levels of competence. The interaction term of 0.113(0.093) is not statistically significant. In addition, the coefficient of ALE in Model 3 decreases slightly compared to that in Model 2; however, it remains statistically significant and strongly supports the CEO learning theory.
4.3 Types of CEO learning
Luo (2005) and Kau et al. (2008) provide evidence that CEO decides to consummate a takeover transaction according to market reactions. In order to distinguish between this of CEO learning and learning from past experience, I employ the method of Luo (2005) to control for deal announcement returns (DCAR). DCAR is generated as the total cumulative abnormal returns (CAR) around the announcement date of both target and acquirer. This empirical strategy can properly exclude the probability-feedback that comes from investors’ forecasts about the outcome of the transaction. I compute CAR by adding up stock abnormal returns from day -1 to 1 (day 0 is
the announcement date). Abnormal returns are calculated as the difference between normal returns and benchmark returns predicted from the market model of which parameters are estimated based on daily stock returns and CRSP value-weighted returns during the period of 252 trading days (- 262, -10).
Insert Table 6 here
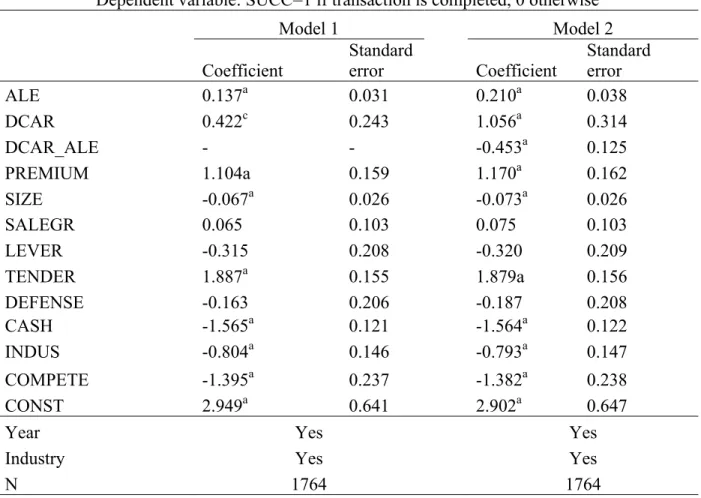
Model 1 in Table 6 indicates that DCAR is positive and statistically significant at 10%. This finding supports the learning during acquisition hypothesis that CEO consummates a deal when the outsiders react favorably to the deal announcement. Also noted that the effect of ALE remains positive and statistically significant after controlling for DCAR. Moreover, experienced CEO may be less likely to be affected by the abnormal response of the outsiders. In short, CEO depends less on the abnormal returns generated by the transaction announcement to make a completion decision when he is more experienced. I, therefore, add an interaction between deal announcement returns and CEO learning experience in Model 3. The interaction term (DCAR_ALE) is negative and statistically significant at 1%, suggesting that the effect of CEO learning during acquisitions is lower when he has a higher level of ALE.
4.4 Bid premiums, deal announcement returns and CEO learning experience
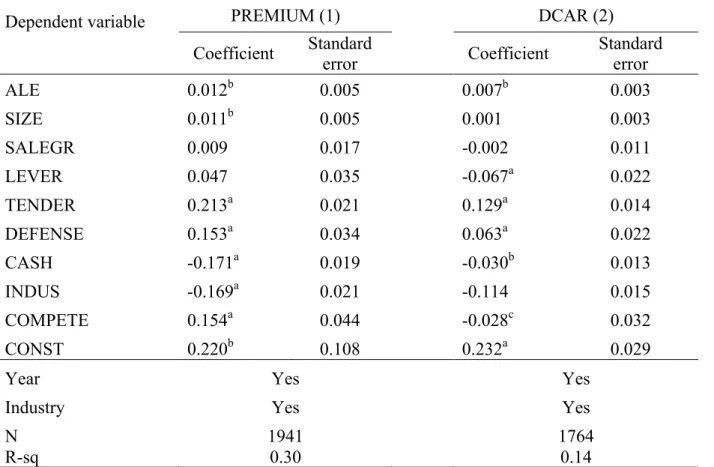
CEO learning theory suggests that the decreasing variance of CEO’s perception on synergy effects enables him to pay a higher price for the target, therefore increases the probability of completing the transaction (Aktas et al., 2009). In addition, learning improves the target selection skills of the CEO, and the subsequent deal becomes less risky and more valuable. I, therefore, examine the effect of CEO’s accumulated learning experience on the offer premium and the potential synergy of the prospective deal. I regress the takeover premium (PREMIUM) and deal announcement returns (DCAR) on ALE and other firm-deal characteristics. PREMIUM is the ratio
---
between the offer price and target stock price four weeks prior to the announcement date, minus one. DCAR is defined as in the previous subsection. The coefficient of CEO learning experience in Model 1, Table 7 is positive and statistically significant at 1%, suggesting that when CEO completes one more takeover transaction, he pays 1.2%(0.5%) more premium to the takeover target. In addition, Model 2 shows a statistically significant and positive relation between CEO’s experience and the deal announcement returns. Specifically, when ALE increases by one, the total cumulative abnormal returns of the target and the acquirer around the announcement date increase by 0.7%(0.3%).
Insert Table 7 here 5 Robustness checks
5.1 Unobserved Heterogeneity
Econometricians warn us about the “cluster problem” (Gibbons & Hedeker, 1994). CEO within acquisition programs have characteristics that could cause the persistence of success in acquisition programs. Estimating probit models without corrections for the correlation of the error terms will lead to imprecise results because the standard errors of the coefficients are biased (Guilkey &
Murphy, 1993). I, therefore, set up a panel data with two dimensions of CEO identifier and deal orders. I then use random-effects probit models to control for the unobserved effects. Model 1 in Table 8 provides estimation results of the random-effects probit models. The likelihood ratio test does not reject the null hypothesis that the pool estimator is the same as the panel estimator at 1%
significance level. In addition, the coefficient of ALE of 0.141(0.030) is statistically significant at 1%, which strongly supporting the hypothesis that CEO learns from past experience.
5.2 Alternative definition of acquisition program
It is possible that different definitions of acquisition program will affect the measurement of CEO learning and cause inconsistent results in predicting transaction outcome. A typical example is the Aktas et al. (2011)’s definition of acquisition program is a group of two successive transactions announced by the same firm and CEO. According to my baseline hypothesis with the new definition of acquisition program, the success of the prior transaction (PRSUCC) has a positive effect on the completion of the current transaction. Model 2 in Table 8 shows that coefficient of PRSUCC is 0.47 (0.08) and statistically significant at 1%, confirming that the effect of CEO learning is robust to the alternative of definition acquisition program.
Insert Table 8 here 5.3 Missing variables
Although in Section 4.2, I control for CEO’s inherent abilities and firm-deal characteristics, CEO’s preferences and incentives indeed affect the transaction outcome (Agrawal & Walkling, 1994; Bliss & Rosen, 2001; Grinstein & Hribar, 2004; Harford & Li, 2003). As a result, besides personal characteristics of CEO, such as tenure, gender, and age, I control for compensation factors including CEO pay slice (SLPAY), CEO variable pay (VRPAY) and CEO equity pay (EQPAY).
SLPAY represents the relative ranking of the CEO’ compensation, and his abilities to extract rents (Bebchuk, Cremers, & Peyer, 2011); VRPAY and EQPAY control for the alignment between CEO’s wealth and the benefits of stockholders. Model 3 and 4 confirm the robust effect of CEO learning on transaction outcome. In Model 3, CEO’s personal characteristics including AGE, TENURE, and GENDER have no significant influence on the transaction outcome. EQPAY and SLPAY are also not statistically significant at 10%. However, Model 4 shows a positive but weak relation between VRPAY and the probability of success, suggesting that the higher alignment between CEO and shareholders, the greater efforts he spends to acquire potential targets.
--- --
5.4 CEO continuity
CEO can be replaced and become CEO of other firms. The historical experience of doing acquisitions in one firm, therefore, can affect the learning in the other. I, therefore, track the identification of CEO in all acquisition programs. Subsequently, I search for the historical number of deals that CEO previously completes in other firms. I document that only seven CEOs have records of announcing M&As in other firms, and four of them complete at least one transaction. I do a probit regression which controls for the CEO’s historical experience in other firms.
Specifically, I include a dummy indicator equal to one if CEO completes at least one takeover in the other firm. The effect of CEO learning experience, however, remains unchanged.8
6 Conclusion
Learning theory suggests that CEO accumulates experience from previously completed transactions and transfers it into completion of the prospective. In this paper, I model transaction outcome as a function of ALE and other firm-deal characteristics. I then collect a sample of 2785 serial transactions announced between 1992 to 2012 from the SDC M&A database. Probit regressions identify a clear and significant relation between ALE and the outcome of takeover transactions. Specifically, the probability of success increases by 29% when ALE increases from zero to five, holding other factors at mean. In addition, CEO pays more premium to the takeover target when he is more experienced, which consistent with the hypothesis that CEO values the target higher when it becomes less risky. CEO competence significantly explains the persistence of success in acquisition programs, it does not affect the robustness of CEO learning effect. Probit
8 In the interest of brevity, I do not present the estimation output of this probit regression because it is similar to the results presented in Table 4.
regressions reveal strong evidence supporting the effect of learning during acquisition; however, it is lower when CEO has a higher level of historical experience.
References
Agrawal, A., & Walkling, R. A. (1994). Executive Careers and Compensation Surrounding Takeover Bids. The Journal of Finance, 49(3), 985-1014. doi:10.1111/j.1540- 6261.1994.tb00085.x
Aktas, N., de Bodt, E., & Roll, R. (2009). Learning, Hubris and Corporate Serial Acquisitions.
Journal of Corporate Finance, 15(5), 543-561. doi:10.1016/j.jcorpfin.2009.01.006
Aktas, N., de Bodt, E., & Roll, R. (2011). Serial Acquirer Bidding: An Empirical Test of the Learning Hypothesis. Journal of Corporate Finance, 17(1), 18-32.
doi:10.1016/j.jcorpfin.2010.07.002
Aktas, N., de Bodt, E., & Roll, R. (2013). Learning from Repetitive Acquisitions: Evidence from the Time between Deals. Journal of Financial Economics, 108(1), 99-117.
doi:10.1016/j.jfineco.2012.10.010
Ambrose, B. W., & Megginson, W. L. (1992). The Role of Asset Structure, Ownership Structure, and Takeover Defenses in Determining Acquisition Likelihood. Journal of Financial and Quantitative Analysis, 27(4), 575-589. doi:10.2307/2331141
Antonio, J. M., Rau, P. R., & Aris, S. (2013). How do serial acquirers choose the method of payment? Erasmus Research Institute of Management. Retrieved from http://www.erim.eur.nl/fileadmin/erim_content/documents/Rau_Sep26.pdf
Arikan, A. M., & Stulz, R. M. (2016). Corporate Acquisitions, Diversification, and the Firm's Life
Cycle. Journal of Finance, 71(1), 139-193.
doi:http://onlinelibrary.wiley.com/journal/10.1111/%28ISSN%291540-6261/issues
Avery, C., Chevalier, J. A., & Schaefer, S. (1998). Why Do Managers Undertake Acquisitions?
An Analysis of Internal and External Rewards for Acquisitiveness. Journal of Law, Economics, and Organization, 14(1), 24-43. doi:10.1093/oxfordjournals.jleo.a023398
--- --
Baker, M., Pan, X., & Wurgler, J. (2012). The Effect of Reference Point Prices on Mergers and Acquisitions. Journal of Financial Economics, 106(1), 49-71.
doi:10.1016/j.jfineco.2012.04.010
Bao, J., & Edmans, A. (2011). Do Investment Banks Matter for M&A Returns? Review of Financial Studies, 24(7), 2286-2315. doi:10.1093/rfs/hhr014
Bates, T. W., & Lemmon, M. L. (2003). Breaking Up Is Hard to Do? An Analysis of Termination Fee Provisions and Merger Outcomes. Journal of Financial Economics, 69(3), 469-504.
doi:10.1016/S0304-405X(03)00120-X
Bebchuk, L. A., Cremers, K. J. M., & Peyer, U. C. (2011). The CEO pay slice. Journal of Financial Economics, 102(1), 199-221. doi:10.1016/j.jfineco.2011.05.006
Bertrand, M., & Schoar, A. (2003). Managing with Style: The Effect of Managers on Firm Policies.
Quarterly Journal of Economics, 118(4), 1169-1208. doi:10.1162/003355303322552775 Betton, S., Eckbo, B. E., Thompson, R., & Thorburn, K. S. (2014). Merger Negotiations with Stock
Market Feedback. Journal of Finance, 69(4), 1705-1745. doi:10.1111/jofi.12151
Billett, M. T., & Qian, Y. (2008). Are Overconfident CEOs Born or Made? Evidence of Self- Attribution Bias from Frequent Acquirers. Management Science, 54(6), 1037-1051.
doi:10.1287/mnsc.1070.0830
Bliss, R. T., & Rosen, R. J. (2001). CEO Compensation and Bank Mergers. Journal of Financial Economics, 61(1), 107-138. doi:10.1016/s0304-405x(01)00057-5
Comment, R., & Schwert, G. W. (1995). Poison or Placebo? Evidence on the Deterrence and Wealth Effects of Modern Antitakeover Measures. Journal of Financial Economics, 39(1), 3- 43. doi:10.1016/0304-405x(94)00823-j
Custodio, C., & Metzger, D. (2013). How Do CEOs Matter? The Effect of Industry Expertise on Acquisition Returns. Review of Financial Studies, 26(8), 2007-2047. doi:10.1093/rfs/hht032
Daines, R. (2001). Does Delaware law improve firm value? Journal of Financial Economics, 62(3), 525-558. doi:10.1016/S0304-405X(01)00086-1
Deighton, E. (2006). Patterns in the performance of successive acquisitions: Evidence from individual CEO acquisition track records. Helsinki School of Economics.
Fama, E. F., & French, K. R. (1997). Industry Costs of Equity. Journal of Financial Economics, 43(2), 153-193. doi:10.1016/s0304-405x(96)00896-3
Field, L. C., & Karpoff, J. M. (2002). Takeover Defenses of IPO Firms. Journal of Finance, 57(5), 1857-1889. doi:10.1111/0022-1082.00482
Flanagan, D. J., D'Mello, J. P., & O'Shaughnessy, K. C. (1998). Completing the Deal:
Determinants of Successful Tender Offers. Journal of Applied Business Research, 14(3), 21- 32. doi:10.19030/jabr.v14i3.5700
Francis, B. B., Hasan, I., Sun, X., & Waisman, M. (2014). Can Firms Learn by Observing?
Evidence from Cross-Border M&As. Journal of Corporate Finance, 25, 202-215.
doi:http://www.sciencedirect.com/science/journal/09291199
Fuller, K., Netter, J., & Stegemoller, M. (2002). What Do Returns to Acquiring Firms Tell Us?
Evidence from Firms That Make Many Acquisitions. Journal of Finance, 57(4), 1763-1793.
doi:10.1111/1540-6261.00477
Gibbons, R. D., & Hedeker, D. (1994). Application of random-effects probit regression models.
Journal of consulting and clinical psychology, 62(2), 285. doi:10.1037/0022-006X.62.2.285 Gompers, P., Kovner, A., Lerner, J., & Scharfstein, D. (2010). Performance Persistence in
Entrepreneurship. Journal of Financial Economics, 96(1), 18-32.
doi:http://www.sciencedirect.com/science/journal/0304405X
Grinstein, Y., & Hribar, P. (2004). CEO Compensation and Incentives: Evidence from M&A Bonuses. Journal of Financial Economics, 73(1), 119-143. doi:10.1016/j.jfineco.2003.06.002
--- --
Guilkey, D. K., & Murphy, J. L. (1993). Estimation and Testing in the Random Effects Probit Model. Journal of Econometrics, 59(3), 301-317. doi:10.1016/0304-4076(93)90028-4
Harding, D., & Rovit, S. (2004). Building deals on bedrock. Harvard Business Review, 82(9), 121- 128.
Harford, J., & Li, K. (2003). Corporate Takeovers and CEO Compensation. Unpublished working paper, University of Washington.
Hayward, M. L. A. (2002). When do firms learn from their acquisition experience? Evidence from 1990 to 1995. Strategic Management Journal, 23(1), 21-39. doi:10.1002/smj.207
Henry, D. (2004). Corporate Governance and Ownership Structure of Target Companies and the Outcome of Takeovers. Pacific-Basin Finance Journal, 12(4), 419-444.
doi:10.1016/j.pacfin.2003.09.004
Holl, P., & Kyriazis, D. (1997). Agency, Bid Resistance and the Market for Corporate Control.
Journal of Business Finance & Accounting, 24(7-8), 1037-1066. doi:10.1111/1468-5957.00150 Kaplan, S. N., Klebanov, M. M., & Sorensen, M. (2012). Which CEO Characteristics and Abilities
Matter? Journal of Finance, 67(3), 973-1007. doi:10.3386/w14195
Kau, J. B., Linck, J. S., & Rubin, P. H. (2008). Do Managers Listen to the Market? Journal of Corporate Finance, 14(4), 347-362. doi:10.1016/j.jcorpfin.2008.03.002
Lehn, K. M., & Zhao, M. (2012). CEO Turnover after Acquisitions: Are Bad Bidders Fired? In J.
H. Mulherin (Ed.), Mergers and Acquisitions (pp. 209-261): Elgar Research Collection.
International Library of Critical Writings in Economics, vol. 270. Cheltenham, U.K. and Northampton, Mass.: Elgar. (Reprinted from: [2006]).
Luo, Y. (2005). Do Insiders Learn from Outsiders? Evidence from Mergers and Acquisitions.
Journal of Finance, 60(4), 1951-1982. doi:10.2139/ssrn.361520
Palepu, K. G. (1986). Predicting takeover targets. Journal of Accounting and Economics, 8(1), 3- 35. doi:10.1016/0165-4101(86)90008-X
Park, K. (2003). CEO leadership, motivation, and mobility in large mergers and acquisitions.
Paper presented at the Proceeding of the IASTED International Conference on Alliances, Mergers, and Acquisitions, Canada.
Schwert, G. W. (2000). Hostility in Takeovers: In the Eyes of the Beholder? Journal of Finance, 55(6), 2599-2640. doi:10.1111/0022-1082.00301
Sokolyk, T. (2011). The effects of antitakeover provisions on acquisition targets. Journal of Corporate Finance, 17(3), 612-627. doi:10.1016/j.jcorpfin.2010.10.005
Walkling, R. A. (1985). Predicting Tender Offer Success: A Logistic Analysis. Journal of Financial and Quantitative Analysis, 20(4), 461-478. doi:10.2307/2330762
Yim, S. (2013). The Acquisitiveness of Youth: CEO Age and Acquisition Behavior. Journal of Financial Economics, 108(1), 250-273. doi:10.2469/dig.v43.n2.59
--- -
Appendix 1: Definition of variables
Variable definition Source
SUCC equals one if the transaction status is classified as “Completed” in the
SDC database. SDC database
VALUE is the value of transaction quoted in million dollars. SDC database PREMIUM equals the ratio between the offer price and target stock price four
weeks before prior to announcement, minus one. SDC database
SIZE is the natural logarithm of the transaction value. SDC database LEVER equals the ratio between the target’ total liabilities and its total assets. SDC database SALEGR equals the growth rate of sales in the most recent fiscal year. SDC database TENDER is a binary indicator equal to one the acquirer launched a tender
offer for the target.
SDC database DEFENSE is a binary indicator equal one if the target employs at least one
defensive tactic against the acquirer. SDC database
CASH is a binary indicator equal to one if the transaction is 100% financed by cash.
SDC database INDUS is a binary indicator equal to one if the target shares the same industry
classification with the acquirer (Industry classification is based on 48 industry portfolios defined by Fama and French (1997)).
SDC database
COMPETE is a binary indicator equal to one if there is more than one entity
bidding for the target. SDC database
GENDER is a binary indicator equal to one if CEO’s gender is male, and zero otherwise.
ExecuComp TENURE is the period (years) holding CEO title in the acquirer. ExecuComp
AGE is the natural logarithm of CEO’s age. ExecuComp
EQPAY is the sum of CEO’s restricted stock grants and stock option grants scaled by his total compensation.
ExecuComp VRPAY is generated as the difference between CEO’s total compensation and
salary scaled by his total compensation.
ExecuComp SLPAY is the proposition of CEO’s compensation as of the sum of the top-
five executive team (Bebchuk et al., 2011).
ExecuComp
Appendix 2: Marginal effect
The table shows the probit regression analysis of the transaction outcome and the corresponding marginal effect. I compute marginal effects for each continuous regressor as L; [ \ /L(\), and
∆;([|\) for each dummy indicator, evaluated at \ = \.
Dependent variable SUCC=1 if transaction is completed, 0 otherwise Probit regression Marginal effect
ALE 0.151a 0.060a
(0.027) (0.011)
PREMIUM 1.223a 0.488a
(0.130) (0.052)
SIZE -0.040c -0.016c
(0.021) (0.008)
SALEGR 0.124 0.0493
(0.090) (0.036)
LEVER -0.249 -0.099
(0.160) (0.064)
TENDER (d) 1.568a 0.496a
(0.128) (0.025)
DEFENSE (d) -0.365b -0.143b
(0.177) (0.068)
CASH (d) -1.364a -0.478a
(0.099) (0.027)
INDUS (d) -0.866a -0.320a
(0.119) (0.038)
COMPETE (d) -1.325a -0.422a
(0.201) (0.039)
Year No No
Industry No No
N 1941 1941
Standard errors in parentheses
(d) for discrete change of dummy variable from 0 to 1
--- ----
Table 1: Distribution of M&A transactions
Table 1 provides sample distribution of 2785 serial transactions announced during the period 1992- 2012 across year and industry. All acquirers are listed in the SDC M&A database and have CEOs identified in Standard and Poor’s ExecuComp database. Serial transactions are defined as transactions that belong to an acquisition program. Single transactions include all remaining transactions. The industry codes are classified as Fama and French (1997)’s 48 industry portfolios.
Single Serial ALE>=0
Panel A: Distribution across year
1992 2 3 0
1993 22 59 13
1994 73 141 51
1995 69 220 111
1996 67 293 184
1997 82 266 173
1998 112 318 248
1999 96 277 206
2000 72 208 169
2001 45 133 101
2002 35 87 64
2003 39 85 65
2004 37 102 82
2005 58 100 79
2006 54 87 61
2007 60 101 79
2008 81 102 78
2009 25 63 52
2010 46 51 44
2011 40 63 55
2012 46 26 26
Panel B: Distribution across industry
Business Services 136 325 219
Insurance 61 198 148
Electronic Equipment 86 187 125
Pharmaceutical Products 45 153 118
Chemicals 35 135 95
Computers 35 133 97
Retail 82 126 84
Medical Equipment 34 116 82
Machinery 51 98 60
Communication 29 94 73
Others 567 1220 840
Total 1161 2785 1941
Table 2: Descriptive statistics
Table 2 shows descriptive statistics single and serial transactions during the period 1992-2012. Acquirers are listed in the SDC M&A database and have CEO identified in Standard and Poor’s ExecuComp database. All acquirers are publicly traded firms, and targets can be private, public or subsidiary. Serial transactions belong to acquisition programs which are constructed by acquirers who announce at least two transactions within five years. The remaining transactions belong to the sample of single transactions. All variables are defined in Appendix 1. a, b, and c denote statistically significant at 1 %, 5 %, and 10 % level, respectively.
Single (a) Serial (b) ALE>=0
Mean
Standard
deviation Median Mean
Standard
deviation Median
Mean difference
(b-a) Mean
Standard
deviation Median
VALUE 1022 4309 133 1143 5459 156 121 1276 6107 189
PREMIUM 0.164 0.317 0.069 0.154 0.359 0.046 -0.003 0.165 0.366 0.057
SIZE 5.017 1.845 4.894 5.086 1.870 5.053 0.069 5.229 1.863 5.244
SALEGR 1.175 0.383 1.094 1.193 0.432 1.097 0.018 1.192 0.438 1.093
LEVER 0.494 0.237 0.496 0.508 0.229 0.514 0.013c 0.515 0.232 0.522
CASH 0.722 0.448 1 0.744 0.436 1 0.023 0.742 0.438 1
SUCC 0.438 0.496 0 0.460 0.498 0 0.021 0.464 0.499 0
TENDER 0.158 0.365 0 0.132 0.339 0 -0.026b 0.150 0.357 0
DEFENSE 0.050 0.218 0 0.055 0.227 0 0.005 0.055 0.227 0
INDUS 0.869 0.337 1 0.842 0.365 1 -0.027b 0.828 0.377 1
COMPETE 0.034 0.182 0 0.028 0.165 0 -0.006 0.029 0.167 0
N 1161 2785 1941
---
Table 3: CEO learning and takeover success
Table 3 summarizes the average success rate across levels of CEO learning experience (ALE).
ALE equals the total number of transactions CEO previously completes in acquisition programs.
Completion ratio is the ratio between the total number of completed transaction and the total number of transactions in each level of experience. A transaction is completed if its status in SDC M&A database is “Completed”.
ALE Number of
transactions Completed Failed Completion ratio
0 724 231 493 32%
1 690 335 355 49%
2 254 142 112 56%
3 130 78 52 60%
4 56 44 12 79%
>=5 87 71 16 82%
Total 1941 901 1040 46%
Table 4: Probit models on completed and withdrawn transactions.
Table 4 provides probit regressions of transaction outcome on CEO learning and other control variables representing firm-deal characteristics. The dependent variable, SUCC, equals one if the transaction is completed, and zero otherwise. ALE equals the total number of transactions CEO previously completes in acquisition programs. Other variables are defined in Appendix 1. a, b, and c denote statistically significant at 1 %, 5 %, and 10 % level, respectively.
Dependent variable SUCC=1 if transaction is completed, 0 otherwise
Model 1 Model 2 Model 3 Model 4
Coefficient Standard
error Coefficient Standard
error Coefficient Standard
error Coefficient Standard error
ALE 0.151a 0.027 0.162a 0.028 0.126a 0.029 0.141a 0.030
PREMIUM 1.223a 0.130 1.233a 0.132 1.194a 0.136 1.197a 0.137
SIZE -0.040c 0.021 -0.046b 0.022 -0.050b 0.023 -0.056b 0.024
SALEGR 0.124 0.090 0.104c 0.091 0.095 0.095 0.077 0.096
LEVER -0.249 0.160 -0.281 0.165 -0.171 0.188 -0.182 0.192
TENDER 1.568a 0.128 1.629a 0.132 1.648a 0.134 1.707a 0.137
DEFENSE -0.365b 0.177 -0.335c 0.184 -0.361b 0.182 -0.347c 0.190
CASH -1.364a 0.099 -1.453a 0.105 -1.394a 0.104 -1.504a 0.111
INDUS -0.866a 0.119 -0.872a 0.121 -1.002a 0.129 -1.010a 0.133
COMPETE -1.325a 0.201 -1.297a 0.201 -1.337a 0.208 -1.285a 0.208
CONST 1.387a 0.232 2.275a 0.527 1.924a 0.332 2.698a 0.581
Year No Yes No Yes
Industry No No Yes Yes
N 1941 1941 1941 1941
pseudo R-sq 0.41 0.43 0.44 0.46
---
Table 5: CEO learning experience and competence
Table 5 presents two-stage regressions distinguishing the effect of CEO learning and competence on transaction outcome. Model 1 shows the OLS estimation of the success of the first deal in acquisition programs on the industry rate of success (IYRS) and firm-deal characteristics. INABS is the estimated residuals in Model 1. Model 2 provides probit regression of the transaction outcome on ALE and INABS. Model 3 adds an interaction term between ALE and INABS as an explanatory variable. The dependent variable, SUCC, equals one if the transaction is completed, and zero otherwise. ALE equals the total number of transactions that CEO previously completes in acquisition programs. IYRS is the average completion rate of each year and industry. Other variables are defined in Appendix 1. a, b, and c denote statistically significant at 1 %, 5 %, and 10 % level, respectively.
Dependent variable: SUCC=1 if transaction is completed, 0 otherwise
Model 1 Model 2 Model 3
Coefficient Robust standard error
Coefficient Standard
error Coefficient Standard
error
IYRS -0.056 0.056 - - - -
ALE - - 0.094a 0.037 0.090b 0.037
INABS - - 0.418a 0.115 0.284c 0.159
ALE_INABS - - - - 0.113 0.093
PREMIUM 0.239b 0.049 1.166a 0.146 1.153a 0.146
SIZE -0.001 0.009 -0.034 0.026 -0.033 0.026
SALEGR -0.057c 0.032 0.099 0.103 0.094 0.103
LEVER -0.011 0.064 -0.127 0.207 -0.112 0.207
TENDER 0.428a 0.050 1.746a 0.147 1.751a 0.147
DEFENSE 0.024 0.058 -0.247 0.211 -0.237 0.211
CASH -0.489a 0.041 -1.580a 0.119 -1.586a 0.119
INDUS -0.143a 0.043 -1.083a 0.143 -1.087a 0.144
COMPETE -0.290a 0.119 -1.335a 0.217 -1.330a 0.217
CONST 0.982a 0.078 2.305a 0.748 2.262a 0.748
Year No Yes Yes
Industry No Yes Yes
N 844 1702 1702
R-sq/ pseudo R-sq 0.40 0.48 0.48
Table 6: Types of CEO learning
Table 6 provides probit regressions of transaction outcome on different types of CEO learning.
The dependent variable, SUCC, equals one if the transaction is completed, and zero otherwise.
ALE equals the total number of transactions CEO previously completes in acquisition programs.
DCAR is the total of cumulative abnormal returns between from day -1 to day 1 of both target and acquirer, with day 0 defined as the announcement date. Other variables are defined in Appendix 1.
a, b, and c denote statistically significant at 1 %, 5 %, and 10 % level, respectively.
Dependent variable: SUCC=1 if transaction is completed, 0 otherwise
Model 1 Model 2
Coefficient
Standard
error Coefficient
Standard error
ALE 0.137a 0.031 0.210a 0.038
DCAR 0.422c 0.243 1.056a 0.314
DCAR_ALE - - -0.453a 0.125
PREMIUM 1.104a 0.159 1.170a 0.162
SIZE -0.067a 0.026 -0.073a 0.026
SALEGR 0.065 0.103 0.075 0.103
LEVER -0.315 0.208 -0.320 0.209
TENDER 1.887a 0.155 1.879a 0.156
DEFENSE -0.163 0.206 -0.187 0.208
CASH -1.565a 0.121 -1.564a 0.122
INDUS -0.804a 0.146 -0.793a 0.147
COMPETE -1.395a 0.237 -1.382a 0.238
CONST 2.949a 0.641 2.902a 0.647
Year Yes Yes
Industry Yes Yes
N 1764 1764
---
Table 7: Bid premium, deal announcement returns, and CEO experience
Table 7 provides linear regressions of takeover premium and deal announcement returns on CEO’s accumulated learning experience. PREMIUM is the ratio between the offer price and target stock price four weeks prior to the announcement date, minus one. DCAR is the total of cumulative abnormal returns between from day -1 to day 1 of both target and acquirer, with day 0 defined as the announcement date. ALE equals the total number of transactions CEO previously completes in acquisition programs. Other variables are defined in Appendix 1. a, b, and c denote statistically significant at 1 %, 5 %, and 10 % level, respectively.
Dependent variable PREMIUM (1) DCAR (2)
Coefficient Standard
error Coefficient Standard
error
ALE 0.012b 0.005 0.007b 0.003
SIZE 0.011b 0.005 0.001 0.003
SALEGR 0.009 0.017 -0.002 0.011
LEVER 0.047 0.035 -0.067a 0.022
TENDER 0.213a 0.021 0.129a 0.014
DEFENSE 0.153a 0.034 0.063a 0.022
CASH -0.171a 0.019 -0.030b 0.013
INDUS -0.169a 0.021 -0.114 0.015
COMPETE 0.154a 0.044 -0.028c 0.032
CONST 0.220b 0.108 0.232a 0.029
Year Yes Yes
Industry Yes Yes
N 1941 1764
R-sq 0.30 0.14
Table 8: Robust checks
Table 8 provides various robust checks to unobserved heterogeneity, alternative definitions of acquisition program, and missing variables.
The dependent variable, SUCC, equals one if the transaction is completed, and zero otherwise. Model 1 provides random-effects probit regressions of transaction outcome on CEO learning experience. Model 2 tests an alternative definition of acquisition program. Model 3 and 4 control for CEO’s personal characteristics and compensation factors. ALE equals the total number of transactions CEO previously completes in acquisition programs. PRSUCC is a dummy indicator which equals one if the prior bid is completed in programs of two successive transactions, zero otherwise. AGE is the natural logarithm of CEO’s age. EQPAY is the sum of CEO’s restricted stock grants and stock option grants scaled by his total compensation. VRPAY is generated as the difference between CEO’s total compensation and salary scaled by his total compensation. SLPAY is the proposition of CEO’s compensation as of the sum of the top- five executive team. Other variables are defined in Appendix 1. a, b, and c denote statistically significant at 1 %, 5 %, and 10 % level, respectively.
---