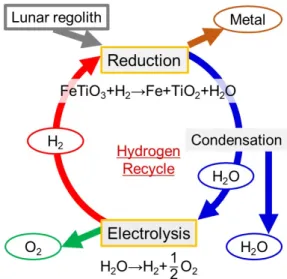
A Continuous Hydrogen Reduction Process for the Production of Water on the Moon
9
0
0
全文
図
+3
関連したドキュメント
It is suggested by our method that most of the quadratic algebras for all St¨ ackel equivalence classes of 3D second order quantum superintegrable systems on conformally flat
We describe the close connection between the linear system for the sixth Painlev´ e equation and the general Heun equation, formulate the Riemann–Hilbert problem for the Heun
Keywords: Lévy processes, stable processes, hitting times, positive self-similar Markov pro- cesses, Lamperti representation, real self-similar Markov processes,
Next, we prove bounds for the dimensions of p-adic MLV-spaces in Section 3, assuming results in Section 4, and make a conjecture about a special element in the motivic Galois group
Transirico, “Second order elliptic equations in weighted Sobolev spaces on unbounded domains,” Rendiconti della Accademia Nazionale delle Scienze detta dei XL.. Memorie di
It turns out that the symbol which is defined in a probabilistic way coincides with the analytic (in the sense of pseudo-differential operators) symbol for the class of Feller
Using the batch Markovian arrival process, the formulas for the average number of losses in a finite time interval and the stationary loss ratio are shown.. In addition,
Keywords: Hydrodynamic scaling limit, Ulam’s problem, Hammersley’s process, nonlinear conservation law, the Burgers equation, the Lax formula.. AMS subject classification:
