0
Analysis of the Gut Microbiota of
Japanese Alzheimer’s Disease Patients and
Characterization of Their Butyrate-Producing Bacteria
2018, July
NGUYEN THI THUY TIEN
Graduate School of Environmental and Life Science (Doctor’s Course)
OKAYAMA UNIVERSITY
1 I. GENERAL INTRODUCTION
1. Overview of Alzheimer’s disease a. Description/Definition
Alzheimer’s disease (AD) is the most common type of age-related disease (aged over 65 years old), accounting for about 55 – 70% of dementia (Bertram, 2007; Bu et al., 2015;
Mandell and Green, 2011). AD is characterized by progressive loss of memory and neurodegeneration of the central nervous system, leading to disorder in cognition and behavior of AD patients (Bertram, 2007; Mandell and Green, 2011). The life span of AD patients from onset may last about 10 years but can be as long as 20 years.
b. Stages and symptoms of Alzheimer’s disease
Stages of AD vary among individual and determination of stages that patients are suffering from is the most importance of AD treatment. The standard approach to classify AD stages relies on a mental status examination, the Mini-Mental State Examination (MMSE) (Folstein et al., 1975; Knopman). AD manifestations can be categorized into three stages with symptoms (López and DeKosky, 2008) presented in Table 1.
2 Table 1. MMSE scores and symptoms of each stage of AD (López and DeKosky, 2008) Stage by
MMSE scores
Cognitive Behavioral Neurological
Mild (score ≥ 20)
Cognitive function is still in fairly good condition. In this stage, IADL of patients may be affected, but not ADL
Apathy and heavy stresses may occur.
However, their mood is still stable.
The neurological exam cannot detect the changes.
However, mild
parkinsonism may have in some patients.
Moderate (score 10 – 19)
All cognitive domains are affected. All IADL and some ADLs are disabled.
Apathy is prominent. A depressive disorder is less frequent than in early stages. Their mood is more aggressive;
psychosis is more frequent.
The neurological exam can be normal. More parkinsonism in some patients.
Severe (score ≤ 9)
Severe deterioration of all cognitive domains.
All IADL and ADLs were affected.
Apathy is prominent.
Major depression is less frequent than in other stages. Psychosis, aggression, and agitation are more frequent.
The neurological exam is nonfocal but mild to moderate. Parkinsonism can be present in the majority of the patients.
Myoclonic movements can be observed during the day.
Note: IADL, instrumental activities of daily living (e.g., job performance, managing finances); ADL, activities of daily living (e.g., getting dressed, control of sphincters).
Furthermore, according to Alzheimer’s Association (https://www.alz.org/), symptoms of AD’s stages can be described as following:
Mild stage (early-stage):
They can work most of the activities by themselves. However, they may have difficulties in:
- Remembering of words or names
3 - Performing plans or tasks
- Forgetting or misplacing important things
Moderate stage (middle-stage):
This is the longest stage during the AD progress, with typical symptoms:
- Forgetting most of events or information of someone’s, such as phone numbers or schools from which they graduated
- Confusing of places, direction and time
- Changing in sleeping, sleep at daytime and restless at night - Feeling moody and decreasing suspiciousness
Late stage (severe stage)
At this stage, AD patients need much assistance with all activities, with symptoms such as:
- Losing awareness of their surrounding activities
- Getting difficulties with daily physical abilities, walking, sitting, swallowing or communicating.
- Being sensitive to infectious factors, especially pneumonia (https://www.alz.org/- alzheimers_disease_stages_of_alzheimers.asp)
c. Prevalence of Alzheimer’s disease: mainly depends on age, geography and gender.
Age: Prevalence of AD increases with age and depends on the ethnicity.
+ In Europe, the prevalence of AD was described in Table 2.
Table 2. Prevalence of AD in Europe (Niu et al., 2017)
Age 65 – 74 75 – 84 > 85 < 79 > 80
Prevalence, % 0.97 7.66 22.35 3.18 14.04
+ In America: the prevalence of AD was described in Fig 1.
Fig 1. Ages of people with AD in the United States, 2018 (Alzheimer's Association, 2018)
> 85 years, 38%
75 – 84 years, 43%
65 – 74% years, 15%
< 65 years, 4%
4 The highest risk of AD incidence belonged to a group of older than 85 years old, up to 22.35%. The lowest prevalence was people in the age of 65 – 74. In America, the people with AD accounted for up to 43% at the age of 75 – 84.
Geography:
+ Europe: 6.88% and 4.31% in Southern European countries (Spain, Italy, and Greece) and in northern European countries (France, the Netherlands), respectively (Niu et al., 2017).
+ America: 10% of people aged over 65 has AD. Approximate 5.7 million Americans of all ages are suffering from AD in 2018, with 5.5 million people age over 65 and the remaining age under 65 (Alzheimer's Association, 2018).
Gender: Women have a higher risk at AD than men, with two-thirds of Americans with AD are women. With aged more than 71 years old, 16% of women suffer from AD or other dementia compared with 11% of men in America in 2018 (Alzheimer's Association, 2018).
d. Risk factors for Alzheimer’s disease
The etiology of AD is consequences of multiple factors, including some typical factors such as:
Age: AD is an age-specific disease. Age is the highest risk of AD with most of AD patients are over 65 years old (Alzheimer’s Association, 2018; Mandell and Green, 2011).
Family history: This factor is unclear to lead to the onset of AD but people who have a parent, brother or sister have three- to four-fold higher risk than other individuals (Mandell and Green, 2011). This may come from a shared environmental and/or lifestyle factors in the same families ( Alzheimer'sAssociation, 2018).
Apolipoprotein E (APOE)- ε4 gene: APOE is an important protein that takes part in many physiological functions inside the bodies. There is three form of the APOE gene, ε2, ε3, and ε4 and each individual inherits one form from their parents encoding for APOE. People who carry ε4 form have a higher risk at AD than others who carry other forms.
People do not contain ε4 form have threefold and eight to twelve-fold lower risk of generating AD than those who inherit one copy and two copies of the ε4 form, respectively (Alzheimer’s Association, 2018; Mandell and Green, 2011).
5
Education: The higher education people obtain; the lower AD risk they may have. This may be explained by their career since those who have higher education need more mentally stimulating to perform their cognition tasks (Alzheimer’s Association, 2018).
e. Pathophysiology
There are two hypotheses have been used to explain for AD pathology, amyloid β (Aβ) and tau hypotheses. These hypotheses were given based on the deposition of two kinds of abnormal structures in the brain of AD patients: senile plaques and neurofibrillary tangles, respectively (Kametani and Hasegawa, 2018). Senile plaque deposition consists of amyloid fibrils composed of the amyloid β (Aβ) peptide, a product of cleavages of amyloid β precursor protein (APP) by β-secretase and γ-secretase, which is densely accumulated outside neurons. Neurofibrillary tangles aggregation of hyperphosphorylated tau protein, a microtubule-associated protein which helps microtubule polymerization and stabilization, deposited inside nerve cell bodies (Karran et al., 2011; Selkoe and Hardy, 2016).
According to the amyloid hypothesis, an imbalance of formation and clearance of Aβ causes the accumulation of Aβ in the brain of aged subjects or pathological conditions. Aβ contains Aβ 40 and Aβ 42 (more hydrophobic than Aβ 40) which consists of 40 and 42 amino acid residues, respectively. A higher level of Aβ 42 or the ratio of Aβ 42 induces Aβ amyloid fibril formation. This leads to the deposition of Aβ into senile plaque, stimulating tau pathology and causing neuronal cell death and neurodegeneration (Kametani and Hasegawa, 2018).
Amyloid hypothesis has been used as a mainstream theory to explain for AD pathogenesis (Hardy and Selkoe, 2002). However, evidence from mouse models experiments indicated that mice with Aβ accumulation did not have nerve cell death as well as tau protein formation (Kametani and Hasegawa, 2018). This means Aβ is not a cytotoxic factor cause the degeneration of the nerve cell. The deposition of Aβ is a common phenomenon of aging because amyloid deposits of elderly non-demented patients are as much as dementia patients (Kametani and Hasegawa, 2018). Meanwhile, other evidence demonstrated that AD onset is associated with tau protein accumulation, unrelated to amyloid (Kametani and Hasegawa, 2018).
f. Changes in the brain of AD patients
Alzheimer’s brain may be distinguished with the healthy brain by the expression of some typical hallmarks:
6 - Whole brain: AD patients’ brain is smaller than healthy people because of the dramatically shrinking of brain tissue losses (Fig. 3) (https://www.alz.org/alzheimers- dementia/what-is-alzheimers/brain_tour_part_2).
Fig 2. Changes in brains of AD patients. a) A healthy brain; b) A brain with severe AD;
c) Comparison of the two whole brains, and d) Comparison of a crosswise "slice" through the middle of the brain between the ears of healthy brain and AD brain (https://www.alz.- org/alzheimers_disease_4719.asp).
- Brain tissues: Brain tissue of healthy people has more nerve cells and synapses than that of AD patients. Tangles which made by dead and dying nerve cells in healthy people are also less than in AD patient’s brain. Furthermore, the transport system of nutrients and other materials to the cells is destructed by tangles. When protein tau, which assists strands for delivering essential material to cells in parallel straightness, is collapsed into twisted strands, tangles are forming. This formation leads to the disorder of strands, they become disintegrated. Consequently, nutrients and other essential compounds cannot move through the cells, causing cell’s death (Fig. 3) (https://www.alz.org/alzheimers-dementia/what-is- alzheimers/brain_tour_part_2).
a b
c
Advanced Alzheimer’s brain Healthy
brain
d
7 Fig 3. Brain tissue of AD patient and healthy people under the microscope. Plaques were shown in yellow circles, beta-amyloid was shown in green circles, tangles inside dying death and dying cell were indicated by arrows. Areas where tangles are forming were shown in red arrows with straight parallel strands of protein tau in healthy people (small red rectangle) and dying cell were indicated by arrows.
At the early step, the changes may start about 20 years before diagnosis by the formation of plaques and tangles in learning and memory, and thinking and planning areas of the brain. The middle stage generally lasts from 2 – 10 years and develop with more plaques and tangles in mentioned areas. Moreover, speaking and understanding speech and positions where make sense in relation to objects are also affected. At the late stage, most of the cortex is covered by plaques and tangles, caused dying of brain cell (Fig. 4.) (https://www.alz.org/alzheimers-dementia/what-is-alzheimers/brain_tour_part_2).
- The progress of plaques and tangles deposition at different stages of Alzheimer’s brain was showed in Fig. 4.
Fig 4. Changes in brain at different stages of AD patient’s. Early stage (left), mild stage (middle) and severe stage (right). Areas where plaques and tangles formed (the blue-shaded areas) are in learning and memory (blue circle) and thinking and planning (brown circle) areas at early stage, in speaking and understanding speech (red circle) and sense of place in
8 relation to objects areas (green circle) at middle stage, and in most of the cortex at late stage.
(https://www.alz.org/alzheimers-dementia/what-is-alzheimers/brain_tour_part_2) 2. Overview of human gut microbiota
a. Definition
The human gut microbiota is a microorganism community that lives in the human gastrointestinal tract, estimating 1×10¹³ to 1×10¹⁴ individuals. A number of these organisms is believed to be 10 times higher than the number of human cells (Cryan and Dinan, 2012).
The density of gut microbiota in the gastrointestinal tract is shown in Fig. 6. Colon is a known ecosystem contains the highest cell densities (O'Hara and Shanahan, 2006) (Fig. 5).
The human gut microbiome is the collective genomes of all gut microbiota. It is estimated containing 150 times as many genes as the human genome and is referred to as a forgotten organ (Cryan and Dinan, 2012).
Fig 5. Bacteria density in the human gastrointestinal tract (increasing from stomach, duodenum, jejunum, to colon (O'Hara and Shanahan, 2006)).
b. Roles of gut microbiota in human health and disease
Along with our growth and maturation from baby to senescence, the human gut microbiota gradually develops and changes. Their composition and nature are influenced by a number of factors including ethnicity, age, sex, and diet intake of the individual (Hollister et al., 2014; Wang et al., 2017). The gradual development of the gut microbiota is essential for channelizing the process of immune system priming which includes development of immunological memory by patter recognition property of the immune cells. This process is also important to define reaction towards infection, inflammatory diseases and autoimmunity in the host system (Nieuwdorp et al., 2014). The commensal gut microbiota establishes a
Duodenum 101 – 103 cfu/ml
Colon 1011 – 1012 cfu/ml
Stomach 101 – 103 cfu/ml
Jejunum/ileum 104 – 107 cfu/ml
9 symbiotic relationship with the human host and plays essential roles like energy regulation, metabolism and priming immune system in order to improve the quality of life of the host (Clemente et al., 2012; Wang et al., 2017). The gut microbiota colonization in newborn is affected by the nature of delivery which can be noted as abundance of skin-like microbial communities in the caesarean section and vaginal-like microbial communities in the vaginal delivery. The nature of the gut immune system also varies between a newborn and an adult.
This signifies the importance of relationship between physiological state of the body and gut microbiota composition. As a newborn move onto further developmental stages the initial gut microbial community gives way to a diverse gut microbial community. At these stages, the gut microbiota helps in priming the immune system of the body by utilizing the characteristic ‘memory’ feature of the immune cells (Clemente et al., 2012) (Fig 6).
Furthermore, considered as a “forgotten organ”, gut microbiota takes part in processes of vitamin synthesis, bile salt metabolism, and xenobiotic degeneration. All of their final biochemical output is called as “metabolome” (O'Hara and Shanahan, 2006). It has been reported widely that the gut microbiota contains more versatile metabolic genes as compared to human genome. Therefore, they play a key role in energy and metabolism of the host by providing specific enzymes and biochemical pathways which in turn increases the rate of energy extraction, nutrient harvest as well as alters the appetite signaling (Wang et al., 2017).
In addition to this, various metabolic processes that are carried out by the microbiota in the human gut are either associated with nutrient acquisition or xenobiotic processing such as the metabolism of undigested carbohydrate and biosynthesis of vitamins.
10 Fig 6. Developmental stages of the gut microbiota in the human life.
As the food is treated by various salivary amylases in the mouth of the host and is further acted upon by the gastric and bile juices, indigestible carbohydrates are amongst the substrates which are available to the gut microbiota for further energy generation. Depending on the bacterial communities colonized in the gut, these substrates are reduced to various simpler hydrocarbons like short chain fatty acids (SCFAs), carbon dioxide, ammonia, choline, amines, phenols, indoles, mercaptanes, hydrogen sulfide and hydrogen gas. These products are essential for both the host as well as the commensal gut microbiota (Nieuwdorp et al., 2014). The human gut microbiome is responsible for producing about 50-100 mmol/l per day of SCFAs. These SCFAs, which can be instantly absorbed by the gut, are starting material for various metabolic pathways which produce energy for the host intestinal epithelium (Duncan et al., 2009). In addition to energy production, the SCFAs has various other health promoting benefits such as regulation of gut motility, anti-inflammation, and glucose homeostasis (Flint et al., 2012). Altered SCFA production by intestinal microbiota leads to perturbations in bile acid, lipid, and glucose metabolism as well as increased intestinal permeability, resulting in aggravated metabolic endotoxemia and subsequent low- grade inflammation (Fig 7). Furthermore, glycine, taurine or sulfate conjugates constitute the bile acid, which accompanies the indigested food as it enters the intestine of the host.
These conjugates are broken down into simpler components that can be absorbed and recycled to bile, by the intestinal microbial community (Jones et al., 2008).
11 In addition, the commensal gut microbiota plays an indispensable role in maintaining the immunological homeostasis by creating a bridge between the pathogen recognition and development of immune system. The bacterial cell wall has components like lipopolysaccharides, gangliosides, pili or flagella which act as microbe-associated molecular patterns which can be recognized by Toll-like receptors (TLRs) on the host cell as antigens (O'Hara and Shanahan, 2006; Round et al., 2011). The microbe-associated molecular patterns (MAMPs) of commensal bacteria in the gut interact with TLRs and thus aid in immunological tolerance, reduction of inflammatory reactions and maintain the immunological homeostasis of the host. The gut microbiota also influences the adaptive immune system of the host by initiating self-/non-self-discrimination in the T-cell differentiation process as well as by priming the adaptive immunological cells (Lathrop et al., 2011; Lee and Mazmanian, 2010).
12 3. The bidirectional communication between the gut microbiota and the central
nervous system
The human central nervous system (CNS) and intestinal microbiota together constitute microbiota-gut-brain-axis, with emphasis on the multi-factorial relationship (Forsythe et al., 2012; Thakur et al., 2014). Multiple potential direct and indirect pathways exist through
Fig 7. Metabolism of bile acid and SCFA in the (A) healthy physiological and (B) pathophysiological state (Nieuwdorp et al., 2014).
13 which the gut microbiota can modulate the gut–brain axis. They include endocrine (cortisol), immune (cytokines) and neural (vagus and enteric nervous system) pathways (Cryan and Dinan, 2012). The vagus nerve is a significant bridge that establishes the gut-brain axis (Bravo et al., 2011). Some metabolites that are produced as a result of various microbial metabolic pathways in the gut, such as tryptophan, butyrate, serotonin and SCFAs, act as neurotransmitters (Gruninger et al., 2007). Prior studies have reported that SCFAs produced by gut commensals when paired with enteroendocrine receptors lead to parallel increase of a circulating peptide YY which is associated with appetite stimulation. Thus higher production of SCFAs are often associated with binge eating habits of the host (Samuel et al., 2008). An example of the gut-brain communication under stress conditions is represented in Fig 8.
Fig 8. Gut-brain-microbiota axis: a multi-factorial relationship. ACTH, adrenocorticotropic hormone; CRF, corticotropin-releasing factor.
The hypothalamus–pituitary–adrenal axis regulates cortisol secretion, and cortisol can affect immune cells (including cytokine secretion) both locally in the gut and systemically.
Furthermore, cortisol can alter gut permeability and barrier function, and change gut microbiota composition. On the other hand, the gut microbiota and probiotic agents can alter the levels of circulating cytokines, and this can have a marked effect on brain function. Both the vagus nerve and modulation of systemic tryptophan levels are strongly implicated in relaying the influence of the gut microbiota to the brain. In addition, SCFAs can also
14 modulate brain and behavior. The abnormal gut microbiota may lead to the abnormal CNS function and vice versa (Fig 9).
Fig 9. Impact of the gut microbiota on the gut–brain axis in health and disease (Cryan and Dinan, 2012).
A stable gut microbiota contributes to maintain a normal behavior or cognitions with its appropriate regulation along the gut-brain axis while an abnormal gut microbiota can adversely influence gut physiology, leading to inappropriate gut–brain axis signaling and associated consequences for CNS functions and resulting in disease states. Conversely, stress at the level of the CNS can affect gut function and lead to perturbations of the microbiota (Cryan and Dinan, 2012).
4. Motivation, objectives and hypotheses a. Motivation
Ageing population has become a big social-economic burden of each country because of high pressure in healthcare service associated with old age diseases, especially dementia.
Japan is home to the world’s most aged population with 33 per cent were aged 60 years or over in 2015. (http://www.un.org/en/development/desa/population/publications/pdf/ageing- /WPA2015_Report.pdf). In 2018, Japan has more than 4.6 million people are living with dementia, causing the most concerned issue in terms of diseases which associate with elderly in this country (https://www.alz.org/jp).
As aforementioned, the human gut microbiota has bidirectional communication with the central nervous system. Various studies have reported the interaction between the gut
15 microbiota and neurodegenerative diseases (AD, Parkinson’s disease (PD), Huntington’s disease…) as well as other mental dysfunction disease (autism) (De Angelis et al., 2015; Hu et al., 2016; Mancuso and Santangelo, 2018; Sharon et al., 2016). Scheperjans et al. reported a strong reduction of Prevotellaceae abundance in feces of PD patients compared with that of control volunteers (Scheperjans et al., 2015). Reduced Prevotella, Coprococcus and unclassified Veillonellaceae were found in autism (Kang et al., 2013) and Clostridium tetani may stimulate this disease (Bolte, 1998). In multiple sclerosis disease, clostridial species considered as main candidates were responsible for the differences in gut microbiota between patients and controls (Miyake et al., 2015). Especially, a study which compared the gut microbiota of American who diagnosed with AD and the gut microbiota of healthy controls indicated a decline in Firmicutes and an increase in Bacteroidetes in AD participants (Vogt et al., 2017). These findings confirmed a theory claims gut microbiota may implicate in a wide range of brain diseases.
However, the human gut microbiota depends on ethnicity, referring citizens of each country over the world may have their own gut microbiota (Hollister et al., 2014). Japanese has their unique gut microbiota thanks to the specific dietary culture and habits. Their gut microbiomes have more genes for aquatic plant-derived polysaccharide-degrading enzymes than those of Americans (Nishijima et al., 2016). Thus, although the study which reported the alteration of the gut microbiota in AD patients in comparison with healthy persons were carried out in American, we still wanted to know whether the similar changed direction happens to the gut microbiota composition of AD patients and healthy persons in Japan or not. Furthermore, we also wanted to compare the gut microbiota structure of Japanese and American who were both diagnosed with AD to understand the different in their gut microbiota.
Besides, within the community of human gut microbiota, the group of butyrate- producing bacteria attracts particular attention because of the specific health-promoting effects they provide to their hosts (Vital et al., 2014). Their major metabolic end-product, butyrate, is not only a preferred energy source for colonocytes but also a major contributor to the preservation of intestinal epithelial permeability and the protection of the host from carcinogenic, inflammatory, and oxidative factors (Hamer et al., 2008). Butyrate or butyrate- producing bacteria may have positive effects on memory improvement in mouse models of dementia-related diseases, including AD (Govindarajan et al., 2011; Liu et al., 2015). Thus, here we wanted to determine if butyrate-producing bacteria are at all present or completely
16 absent in the gut microbiota of AD patients by investigating their phylogenetic diversity and butyrate-producing ability. The application of single or mixtures of butyrate producers in studies associated with dementia-related disease emphasizes the importance of identifying butyrate-producing bacteria and to assess their rate of butyrate production.
b. Objectives and hypotheses
With the described motivations, in the study presented here, we aimed to:
- Compare the gut microbiota composition of Japanese AD patients (AD group) and Japanese healthy controls (HC group).
- Compare the gut microbiota composition of Japanese AD patients (Japanese group) and American AD patients (American group).
- Characterization of butyrate-producing bacteria isolated from feces of Japanese Alzheimer’s disease patients.
Based on these objectives, firstly, we hypothesized that there are changes in gut microbiota of AD group in comparison with HC group in terms of their composition, diversity, and predicted metabolic pathways. Secondly, differences in microbial population of Japanese AD patients and American AD patients was speculated based on the same criteria. And thirdly, we hypothesized the AD gut microbiota is characterized by low phylogenetic diversity of butyrate-producing bacteria.
II. CHARACTERIZATION OF GUT MICROBIOTA OF JAPANESE ALZHEIMER’S DISEASE PATIENTS
Abstract
AD is the most common type of age-related disease, characterized by progressive loss of memory and neurodegeneration of the central nervous system. This degenerative disorder disease is thought to be associated with their gut microbiota. In this study, the comparison of the gut microbiota of 17 Japanese AD group with that of 17 Japanese HC were carried out. The hypervariable regions V3–V4 of 16S rRNA gene of bacterial genome which were purified from all fecal samples of Japanese were sequenced with primers Tru357F and Tru806R using MiSeq platform (Illumina). The resulting sequences were analyzed with QIIME 1.9.1 and the outputs were used to assess the bacterial compositions, diversities, and metabolic pathways. Total sequences of 181,580 reads were assigned to 2,583 OTUs (operational taxonomic units), consisted of 12 phyla, 22 classes, 33 orders, 70 families and 147 genera. The phyla of Actinobacteria, Verrucomicrobia, Cyanobacteria, and TM7
17 contributed to the differences in phylum level between the two groups with p < 0.05%.
Notably, a higher abundance of Cyanobacteria in AD group was an interesting result since this group of bacteria is believed to be correlated with AD due to their production of (Banack et al., 2010) neurotoxins, such as -N-methylamino-L-alanine, anatoxin-a and saxitoxin.
These compounds may contribute to the onset and development of cognitive dysfunctions, a signal of AD invasion. The Faith’s phylogenetic diversity was significantly reduced in the HC group, reached 12.66 ± 2.1 in the HC group and 15.99 ± 2.29 in AD group (p<0.05). The weighted and unweighted UniFrac distances between AD and HC groups were significant differences at p < 0.001. Predicted metabolic pathways of these gut microbiota indicated that the AD group was enriched in 10 pathways as compared to the HC group, especially AD pathway of the neurodegenerative disease pathway. The gut microbiota of 17 Japanese AD and 25 American AD group was also evaluated. The hypervariable regions V4 of 16S rRNA gene of the purified DNA of AD group were sequenced. The total reads were 4,000,035 reads which were grouped into 14,593 OTUs, comprised 12 phyla, 26 classes, 30 orders, 79 families, and 180 genera. The phylum Proteobacteria was specifically enriched in Japanese group than the American group. Hence, this is the most important finding and may explain the alteration of this community in the human gut microbiota according to the variation in geographical location and health status. The microbial richness, characterized by observed OTU and Chao1 index, of American group was higher than those of Japanese group. The beta diversity of the gut microbiota of AD group in American differed from that in Japanese AD group. These findings may help to clarify the differences in the gut microbiota between the Japanese AD patients and Japanese healthy people as well as the differences in the gut microbiota of American AD patients and Japanese Ad patients.
1. Introduction
AD is the most popular type, accounting for 60 – 80% of all dementia type (Alzheimer’s Association, 2017). AD is characterized by a gradual loss of memory and cognition, a progressive neutron-degenerative disorder of a central nervous system. The original cause leads to AD has been unknown but age and history family were blamed for two main risk factors. According to the amyloid cascade hypothesis of AD pathogenesis, deposition in the brain of extracellular protein fragments called beta-amyloid plaques and an intracellular abnormal form of protein tau were considered as two hallmarks of the AD. Up to now, there is no treatment or effective and appropriate therapy for the AD (Alzheimer’s Association, 2017).
18 Recently, there has been increasing evidence indicating that etiology of diseases associated with the central nervous system (CNS) has relationship with gut microbiota, creating a complex gut-brain-axis (Thakur et al., 2014; Wang et al., 2017). The bidirectional communication between gut flora and CNS plays a key role in physiological as well as mental health, influencing the immune system, the gastrointestinal tract and the CNS function. In AD, many studies have carried out to discover the correlation between AD and microorganism. By using next-generation sequencing (NGS), a method allows to identify almost bacteria in samples, a bacterial community in the extracted postmortem brain tissue of AD patients was shown a higher abundance of Propionibacteriaceae and Corynebacteriaceae in AD brain tissues than that of controls (Emery et al., 2017).
Helicobacter pylori, Clamydophila pneumoniae and spirochetes or Herpes simplex virus were found to be related to AD (Miklossy, 2011). Oral microbiota was richer density in AD postmortem brain, indicating the correlation between AD and oral hygiene situation (Miklossy and McGeer, 2016). The risk of the AD or other neurodegenerative diseases might be enhanced by the elevated proportion of Cyanobacteria in the intestinal flora (Banack et al., 2010). A study which compared the gut microbiota of American with AD and the gut microbiota of American healthy controls indicated a decline in Firmicutes and an increase in Bacteroidetes in AD participants (Vogt et al., 2017). These findings confirmed a theory claims gut microbiota may implicate in a wide range of brain diseases.
Japan is home to the world’s most aged population with 33 per cent were aged 60 years or over in 2015. In 2018, Japan has more than 4.6 million people are living with dementia, causing the most concerned issue in term of diseases which associate with elderly in this country (https://www.alz.org/jp). Although the relationship between the gut microbiota and AD was investigated in American participants (Vogt et al., 2017), this interaction is still necessary to study in Japan since Japanese has their own gut microbiota. The findings may help to clarify the modification in the gut microbiota of Japanese when they are diagnosed with AD. Furthermore, the gut microbiota of Japanese and American AD patients were also compared to have an insight of the gut microbiota of AD patients in different geographical locations.
2. Materials and Methods a. Materials
19 Fresh fecal samples from 17 Japanese Alzheimer’s disease patients (86.29 6.48 years old) were collected. Samples were immediately sealed in a plastic bag containing an AnaeroPack-Anaero (Mitsubishi, Japan) and then transported to the laboratory at 4ºC within two days. In the laboratory, 1 g of feces was treated with 1 ml of phosphate buffer saline (PBS, Life Technologies, Japan) and 2 ml of 40% glycerol (Nacalai Tesque, Japan) in an anaerobic chamber (Bactron, Shel Lab, USA) to generate a fecal stock sample. Subsequently, the fecal stock samples were quickly frozen in liquid nitrogen and stored at 80ºC until use (Nishijima et al., 2016). The study was approved by the Ethics Committee of Okayama University, Japan (Approval number 1610-025). Written informed consents were obtained from all participants or their relatives.
b. Methods
Bacterial DNA extraction
Bacteria from fecal samples were collected following the previous study with a minor modification (Morita et al., 2007). 0.5 g of wet fecal samples was mixed with 45 ml of PBS and then the mixture was divided into three equal parts. Each 15 ml suspension was filtered through a 100-µm-mesh nylon filter using agitation with a plastic bar. The debris on the filter was washed twice with 10 ml PBS. Repeated with the two remaining aliquots with the same method by using new filters and new tubes. The three filtrates were centrifuged at 5000×g for 10 min at 4°C, and each precipitate was washed with 35 ml of PBS. All precipitates were combined and washed again with 35 ml of TE buffer (pH 8.0) and centrifuged again. The precipitate was re-suspended in 800 µl of TE 10 and used for DNA extraction (Morita et al., 2007).
The suspension was incubated at 37ºC for 1 h with 15 mg/ml lysozyme (Sigma- Aldrich). Next, purified achromopeptidase (Wako, Japan) was added to the suspension to obtain 2000 units/ml and incubated at 37ºC for 30 min. The enzymatic treatment was continued by adding 1 mg/ml proteinase K (Merck, Germany) and 100 μl of 10% sodium dodecyl sulfate (Nacalai Tesque, Japan) and kept at 55ºC for 1 h. The bacterial DNA was separated with phenol:chloroform:isoamyl alcohol (25:24:1) (Nacalai Tesque, Japan) and precipitated with 99.5% isopropanol (Wako, Japan) and sodium acetate 3 M. The DNA pellet was obtained by washing twice with 75% ethanol, dried and dissolved in TE buffer overnight.
RNA was removed by incubating the solution with 1 μl RNase A (Novagen, USA) at 37ºC for 1 h. The genomic DNA was recovered by precipitation with 26% PEG (Polyethylene
20 glycol, Nacalai Tesque, Japan) in 1.6 M NaCl (Nacalai Tesque, Japan) on ice for 30 min and followed by centrifugation at 15,000 g for 15 min at 4ºC. The pellet was rinsed with 75%
ethanol, dried and dissolved in 10 mM Tris-HCl buffer (pH 8) (Invitrogen), and stored at
20ºC until subjected to identification of genes involved in butyrate formation in bacteria (Morita et al., 2007)
16S rRNA library preparation and pair-end sequencing
The fecal DNA was sequenced by using Illumina Miseq platform. First, 16S rRNA amplicon libraries were prepared by subjecting the purified DNA to two-steps polymerase chain reaction (PCR). At the first step, there are two primer sets were used to amplify different region of 16S rRNA gene of the genomic DNA of AD group.
- Primer set 1: Tru357F (5′-CGCTCTTCCGATCTCTGTACGGRAGGCAGCAG-3′) and Tru806R (5′-CGCTCTTCCGATCTGACGGACTACHVGGGTWTCTAAT-3′) (Odamaki et al., 2016) aimed to amplify the V3 – V4 region of 16S rRNA gene of AD group’s DNA.
- Primer set 2: (forward: 5′-ACACTCTTTCCCTACACGACGCTCTTCCGATCTG- TGCCAGCMGCCGCGGTAA-3′; reverse: 5′-GTGACTGGAGTTCAGACGTGTGCTCT- TCCGATCTGGACTACHVGGGTWTCTAAT-3′) aimed to amplify the V4 region of 16S rRNA gene of AD group’s DNA (Kozich, 2013; Vogt et al., 2017).
The PCR protocol was started at 95°C for 3 minutes for initial denaturation, followed by 25 cycles of denaturation at 95°C for 30 seconds, annealing at 55°C for 30 seconds, elongation at 72°C for 30 seconds and a final elongation at 72°C for 5 minutes and then hold at 4oC. The PCR product’s size was measured by Agilent 2100 Bioanalyzer (Agilent Technologies). Next, AMPure XP beads (Beckman Coulter, Inc., USA) were used to purify the amplicon of the 16S rRNA gene away from free primers and primer dimer species. The purified amplicons were moved to an index PCR to attach dual indices and sequencing adapters using the Nextera XT Index Kit (Illumina, Inc., San Diego, CA, USA). The PCR running program was performed as above protocol but the cycles were 8 cycles. Again, AMPure XP beads (Beckman Coulter, Inc., USA) were used to clean up the final library before quantification. Finally, the resulting library was checked the length on Agilent 2100 Bioanalyzer (approximately 630 bp) (Illumina, 2013; Klindworth et al., 2013).
DNA concentration of each purified library was diluted with 10 mM Tris pH 8.5 and adjusted to 4 nM using Qubit 3.0 Fluorometer (Life technologies, USA) with Qubit dsDNA
21 HS Assay Kit (Life technologies, USA). Aliquot 5 μl of each diluted library was mixed to make unique indices. The pooling library was pair-ends sequenced using Illumina Miseq platform with MiSeq v3 reagent kits (Illumina, USA) at BioBank, Okayama University, Japan.
Study design
With primer set 1, the gut microbiota of 17 Japanese AD participants (AD group, mean
± SD, 86.29 6.48 years old, Female/Male: 14/3) was compared with that of 17 Japanese healthy participants (HC group, mean ± SD, 85.47 ± 2.72 years old, Female/Male: 12/5) (p
= 0.64). DNA sequences of these controls were downloaded from a public data (accession number DRA004160). They were also amplified with primers, Tru357F and Tru806R, and sequenced by using Illumina Miseq sequencer (Odamaki et al., 2016).
For V4-specific primers: DNA sequences of Japanese gut microbiota in AD group (Japan group) were compared with those of American Alzheimer’s patients (American group, mean ± SD, 71.26 ± 7.13 years old; Female/Male: 17/8) (p<0.001). These reference sequences, which were provided by Dr. Volt (Vogt et al., 2017), were DNA sequences of the gut microbiota of American who were diagnosed with AD. The V4-specific primer was used to amplify the V4 region of the 16S rRNA gene. The resulting product was sequenced with the Illumina Miseq sequencer.
16S rRNA gene-sequencing analysis
Raw sequences of all samples were analyzed using QIIME software package version 1.9.1 (http://qiime.org/) (Caporaso et al., 2010). Pair-end sequences assembled with 50 bp overlapping were used for subsequence analysis. Chimeras were identified and eliminated from joined sequences by using USEARCH 6.1 (http://www.metagenomics.wiki/tools- /qiime/install/usearch61) (Edgar, 2010). After quality filtering, sequences were assigned into Operational Taxonomic Units (OTUs) using the Greengenes reference database (ftp://green- genes.microbio.me/greengenes_release-/gg_13_5/gg_13_8_otus.tar.gz, May 2013) with 97% similarity threshold. OTUs < 0.001% of the total sequence reads were filtered out from the dataset to account for sequencing errors.
Relative abundance of OTUs existing in each group was evaluated at different levels.
The linear discriminate analysis (LDA) effect size (LEfSe) (http://huttenhower.sph.- harvard.edu/galaxy/) was used to analyze the differences in taxonomies of the two groups.
Alpha value for the factorial Kruskal-Wallis test among each group was 0.05. The threshold
22 on the logarithmic LDA score for discriminative features was 2.0. LDA scores (log 10) of significantly different pathways and taxonomies were plotted as bars (Segata et al., 2011).
Chao1, observed species, phylogenetic diversity and Shannon diversity index were calculated to estimate alpha diversity. Beta diversity metrics, weighted and unweighted UniFrac, were generated using normalized OTUs-level data in QIIME. Weighted and unweighted UniFrac distances were evaluated to compare the microbial diversity between AD group and HC group by using t-test (𝛼 = 0.05).
PICRUst (Phylogenetic Investigation of Communities by Reconstruction of Unobserved States) (Langille et al., 2013) was used to analyze metagenome predicted functions in microbial communities. OTUs which were picked using the open reference database (gg_13_8) were re-picked up using a close reference database (gg_13_5) for PICRUst analysis. The OTU table was normalized by the 16S rRNA copy number. The resulting normalized OTUs table was used to create the final metagenome functional predictions of KEGG (Kyoto Encyclopedia of Genes and Genomes) (Kanehisa and Goto, 2000) based on bacterial composition. Predicted metabolic pathways were collapsed into hierarchical KEGG pathways using the categorized by function command in PICRUst. The LEfSe was used to analyze the differences at level 1, 2 and 3 of these pathways. Primer 7 (http://www.primer-e.com/) was used to create box plots which presented to compare relative abundances of different taxonomies in this study. The datasets used and/or analyzed during our study are available from the author of this dissertation.
3. Results
a. Comparison of the gut microbiota of Japanese AD patients and Japanese healthy controls
Taxonomic analysis
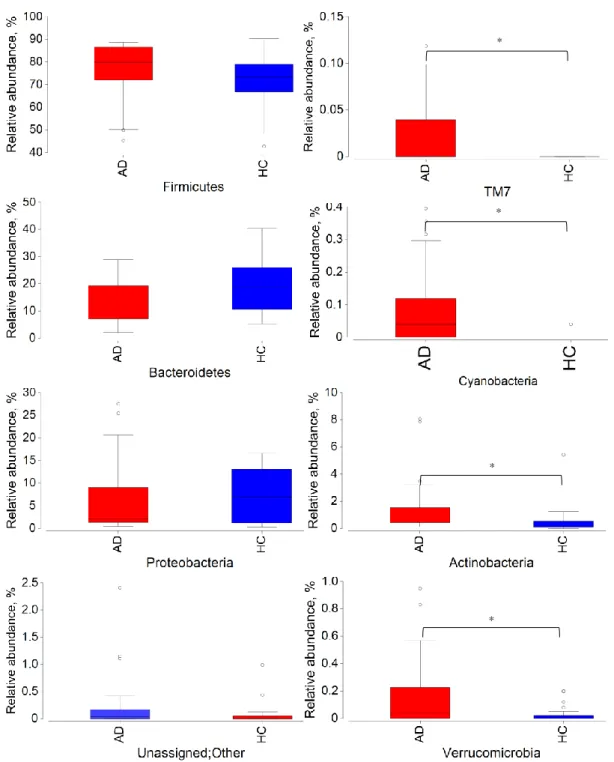
There were 181,580 (5,340.59 ± 3,018.08) reads were assigned to 2,583 OTUs, consisted of 10 phyla, 22 classes, 33 orders, 70 families and 147 genera. At the phylum level, in both groups, the most abundant phylum was Firmicutes with 71.94 ± 11.70 % and 77.06
± 12.71%, in HC and AD groups, respectively. The second abundant phylum was Bacteroidetes with 19.32 ± 9.96% and 13.06 ± 7.31% in HC and AD groups, respectively.
The less abundant phyla included Proteobacteria (7.77 ± 5.60%, 6.18 ± 8.19%), Actinobacteria (0.63 ± 1.23%, 1.81 ± 2.38%), Fusobacteria (0.14 ± 0.45%, 0.74 ± 2.60%), Verrucomicrobia (0.03 ± 0.07%, 0.17 ± 0.28%), and Cyanobacteria (0.002 ± 0.009%, 0.095
23
± 0.134%), corresponding to HC and AD group, respectively. The box plots showed in figure 10 displayed compared relative abundances between the two group.
The phyla of Actinobacteria, Verrucomicrobia, Cyanobacteria, and TM7 made the differences at phylum level between the two groups with p < 0.05%. Two phyla of Cyanobacteria and TM7 seemed to disappear in HC group, reached 0.095% and 0.02%
relative abundance in HC group, respectively. There were no significant differences in major phyla of Firmicutes, Bacteroidetes, and Proteobacteria.
The dissimilarity in different taxonomic levels between the two groups based on statistical and biological significance, ranking them according to the effect size was shown in the bar plot (Fig. 11.). A cladogram was also created to show the differences in the known hierarchical structure of their phylogeny (Fig. 12). On the two figures, the red color indicated for AD group and the green color presented for HC group. On the bar plot, the length of the bar represented a log 10 transformed LDA score of the relative abundance of the nearest taxonomies which made the differences between the two groups. The green bars on the right side indicated the order Turicibacterales, families Bacteroidaceae, Lacnospiracea, and Turicibactericeae, and genera Bacteroides, Faecalibacterium, Coprococcus, Turicibacter, and Christensenella were more abundant in HC group than in AD group. Others with red bars indicated they were more abundant in AD group than those in HC group, included 14 genera, 12 families, 2 classes, 4 orders, and 3 phyla. The cladogram showed the differences according to phylogeny so that it was easy to understand which phylotypes contributed to the differences between the two groups. As indicated on the cladogram, at the phylum level, the phyla Actinobacteria, Verrucomicrobia, Cyanobacteria, and TM7 abundances were higher in AD group than that in HC group.
24
*
*
*
*
Fig 10 . Box plots indicate relative abundance at the phylum level of the two groups.
AD group represents with red boxes and HC group represents with blue boxes
25 Fig 11. Bar plot from LEfSe analysis indicating significant changes in taxonomies between AD and HC groups. The related bacteria names of each column are listed at the bottom of Y-axis, and the score number is shown on the X-axis. HC group-enriched taxa are indicated with a positive LDA score (green), and taxa enriched in AD have a negative score (red) (p < 0.05, LDA score 10).
26 Fig 12. Cladogram plotted from LEfSe analysis showing the taxonomic levels represented by rings with phyla in the outermost the ring and genus in the innermost the ring. Each circle is a member within that level. Those taxa in each level are colored by the group for which it is more abundant, with the green color indicated HC group and red color indicated AD group (p < 0.05; LDA score 2).
The bar plot and cladogram showed the differences between the two groups in terms of distinct taxonomies but relative abundances of each different feature were not clearly indicated. In order to know how different their abundances were, box plots (Fig. 13) which figured out their relative abundances at the family level. There were 15 distinct families contributed to the differences in gut microbiota between the two group. As shown in the Fig 13, the first three families were more prevalent in HC group than those in the diseased group, included Bacteroidaceae, Turicibacteraceae, and Lachnospiraceae. Families which were richer in AD group were 12, with Verrucomicrobiaceae, Actinomycetaceae, Micrococcaceae, Propionibacteriaceae, Rikenellaceae, Carnobacteriaceae, Ruminococcaceae, Leptotrichiaceae, Neisseriaceae, Dehalobacteriaceae, Christensenellaceae, and Veillonellaceae. Especially, Actinomycetaceae Carnobacteriaceae, Dehalobacteriaceae, Neisseriaceae, Leptotrichiaceae, and Propionibacteriaceae seemed to disappear in the HC group. The three most abundant
27 families were Bacteroidaceae, Lachnospiraceae, and Ruminococcaceae, with relative abundances of 14.82% and 7.59%, 29.97% and 24.92%, and 23.48% and 24.69%, corresponded with HC and AD group, respectively.
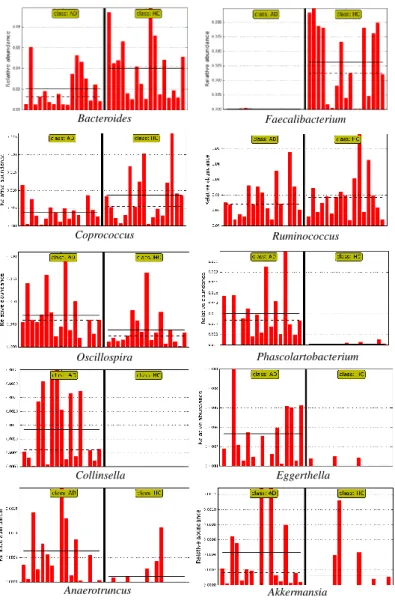
At the genus level, the top ten most abundant genera which showed the significant differences between the two groups were displayed as histograms in detail for each genus (Fig 14), included Faecalibacterium, Bacteroides, Ruminococcus, Eggerthella, Coprococcus, Anaerotruncus, Oscillospira, Phascolarctobacterium, Akkermansia, and Collinsella. The genus Faecalibacterium, one of the important genus in the gut microbiota ecosystem, seemed to disappear in the AD group. While Anaerotruncus, Phascolarctobacterium, Akkermansia, Eggerthella, and Collinsella were more dominant in AD group.
28
29 Fig 13. Box plots indicating the significant differences in relative abundance at the family level of the gut microbiota of AD compared to HC group. The upper and lower quartile with the median is displayed, whiskers are extended to 1.5 times the interquartile range and the circles show outliers.
30
Faecalibacterium Bacteroides
Coprococcus Ruminococcus
Phascolartobacterium Oscillospira
Collinsella Eggerthella
Akkermansia Anaerotruncus
Fig. 14. Histograms showing genus that are more abundant in each group ranked by linear discriminant analysis (LDA) score 2. Values of all participants in each group are displayed. The top four genera were more abundant in the HC group while the bottom six genera were more abundant in the AD group. The mean and median relative abundance of these genera are indicated with solid and dashed lines, respectively.
Diversity analysis
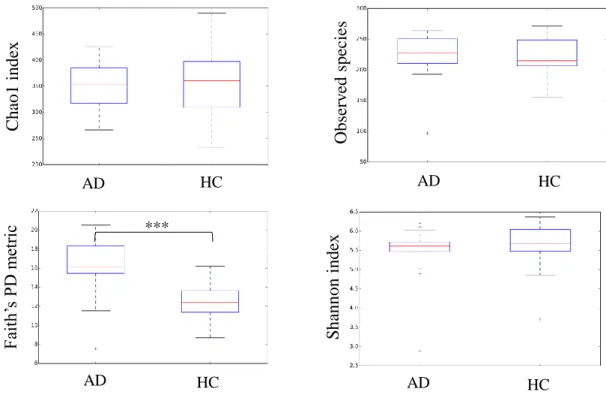
The diversity of gut microbiota of AD and HC groups were evaluated based on alpha diversity and beta diversity. Alpha diversity was evaluated to assess the species richness and evenness within gut microbiota community diversity of the two groups (Fig. 15). The Chao1 was calculated to estimate richness based on the observed number of species (Hughes et al., 2001). Shannon index was used to assess the diversity by considering both species richness and evenness (Magurran, 2004). Faith’s phylogenetic diversity (PD) was used to estimate their diversity based on the minimum total length of all the phylogenetic branches required
31 to span a given set of taxa on the phylogenetic tree (Faith, 1992; Faith and Baker, 2006).
And observed OTUs counted the number of observed species in a given sample with non- phylogenetic richness.
Chao1 index Observed speciesShannon index
Faith’s PD metric
AD HC AD HC
AD HC
AD HC
***
Fig 15. Box plots showing comparisons of alpha diversity of gut microbiota between Japanese AD and HC groups.
There were no significant differences in the number of observed OTU, Shannon index and diversity of the species estimated by Chao1. In HC and AD group, observed species were 216.89 ± 34.99 and 223.00 ± 38.37, respectively; Shannon index were 5.58 ± 0.63 and 5.46 ± 0.72, and Chao1 were 353.32 ± 71.02 and 350.84 ± 43.22, respectively. However, interestingly, Faith’s PD whole tree was significantly reduced in the HC group, reached 12.66 ± 2.1 in the HC group and 15.99 ± 2.29 in AD group (p<0.05).
The gut microbiota community was not only measured based on the diversity within each group but also between the two groups to provide an overview of gut microbiota structure. Unweighted and weighted UniFrac Principle Coordinate Analysis (PCoA) and their UniFrac distance of the gut microbiota community in both groups were analyzed (Fig.
16). Unweighted UniFrac was calculated based only on sequence distances (phylogenetic tree) (does not include abundance information) and weighted UniFrac: branch lengths are weighted by relative abundances (includes both sequence and abundance information) (Lozupone and Knight, 2005).
32 On the unweighted plot the points were closer to each other than those on the weighted plot. The largest principle coordinates, PC1 and PC2, were 14.36% and 8.18% of total variation, respectively, in the unweighted plot, while they were 26.11% and 18.22%, respectively, in the weighted plot. The shifting of the gut composition of AD patients was indicated in bar plots of unweighted and weighted UniFrac distance analysis (Fig. 16). The UniFrac distances between AD and HC groups were significant different at p < 0.001, except for HC-AD and AD-AD distances in the weighted plot.
HC AD
0 0.2 0.4 0.6 0.8
HC-HC HC-AD AD-AD
***
*** ***
PC1 – P ercent variation explained 14.36%
PC2 –Percent variation explained 8.18%
P CoA – P C1 vs PC2
PC1 – Percent variation explained 26.11%
P CoA – P C1 vs PC2
PC2 –Percent variation explained 18.22% Weighted UniFracdistance
0 0.1 0.2 0.3 0.4
HC-HC HC-AD AD-AD
***
***
Unweighted UniFracdistance
Fig. 16. Multidimensional scaling (MDS) plots of unweighted UniFrac and weighted UniFrac. Each dot represents a scaled measure of the composition of a given sample, color- coded by cohort with the blue dots code for HC samples and the red dots code for AD samples.
Comparison of predicted metabolic pathways associated with the gut microbiome between the HC and AD groups
The gut microbiota plays a key function in the host’s health due to its effect on their metabolic pathways. Between HC and AD group, the significant differences in metabolic
33 pathways generated from the gut microbiota community were shown in figure 17 at first, second, and third level which were classified according to the KEGG database. At the second level, the HC group was more enriched in 5 pathways than those in AD group, included carbohydrate metabolism, unclassified metabolism, amino acid metabolism, nervous system and endocrine system. However, the AD group was enriched in 10 pathways, listed as glycan biosynthesis and metabolism, metabolism of other amino acids, xenobiotics biodegradation and metabolism, neurodegenerative disease, digestive system, folding, sorting and degradation, genetic information processing, lipid metabolism, membrane transport, and cellular processes and signalling.
At the lower level, third level of metabolic pathways, 14 pathways included starch and sucrose metabolism, amino sugar and nucleotide sugar metabolism, phenylalanine, tyrosine and tryptophan biosynthesis, bacterial chemotaxis, cytoskeleton proteins, alanine, aspartate and glutamate metabolism, thiamine metabolism, carbohydrate metabolism, lipid metabolism, amino acid metabolism, epithelial cell signaling in Helicobacter pylori infection, linoleic acid metabolism, glutamatergic synapse, and insulin signaling pathway were higher in HC group than those in AD group. On the other hand, the intestinal bacteria of AD group were enriched with metabolic pathways involving taurine and hypotaurine metabolism, protein digestion and absorption, vitamin B6 metabolism, Alzheimer's disease, mineral absorption, protein export, lipoic acid metabolism, bacterial secretion system, lipid biosynthesis proteins, cell motility and secretion, tryptophan metabolism, protein folding and associated processing, membrane and intracellular structural molecules, oxidative phosphorylation, lipopolysaccharide biosynthesis, lipopolysaccharide biosynthesis proteins.
34 Fig 17. Differences in predicted KEGG functional pathways at first, second, and third levels between AD (red) and HC (green) participants. Pathway differences plotted as LDA scores (log 10). Bars which locate on the right of zero line represent bacterial functions enriched in the microbiome of AD participants, while bars which locate on the left of zero line represent bacterial functions enriched in the microbiome of HC participants.
b. Comparison of the gut microbiota of Japanese AD patients and American AD patients
35
Taxonomic comparison
The gut microbiota of 17 Japanese AD and 25 American AD patients was evaluated.
The total reads were 4,000,035 reads (95,238.93 ± 71,613.29 reads/sample) which were grouped into 14,593 OTUs, comprised of 12 phyla, 26 classes, 30 orders, 79 families, and 180 genera. An overall gut bacterial of the American group and Japanese group at phylum level was displayed on a stacked bar plot (Fig. 18).
Fig 18. Gut bacterial compositions of American and Japanes groups at the phylum level The phyla Firmicutes and Bacteroidetes were two major phyla in both groups, with the relative abundance of 75.97 ± 8.20 %, and 68.94 ± 11.70% of Firmicutes, and 17.78 ± 7.93%, and 14.60 ± 8.33% of Bacteroidetes in American and Japanese AD groups, respectively. Lower contributors were Actinobacteria, Verrucobacteria, Proteobacteria, and Cyanobacteria. Only the two phyla Proteobacteria and Archaea made the differences in the gut microbiota of these two groups, they were richer in Japanese group than in American group. For Proteobacteria, the relative abundance of America group was 1.56 ± 3.69% while it accounted for 6.04 ± 7.66% in Japanese group. Relative abundance of the phylum Euryarchaeota were 0.23 ± 0.40% and 2.39 ± 4.71% in American and Japanese groups, respectively.
A bar plot (Fig. 19) and a cladogram (Fig. 20) were generated to compare the differences in taxonomy at many levels from phylum to genus between the two groups. The bar plot displayed the differences in bacterial taxonomies based on relative abundance
0 20 40 60 80 100
American AD Japanese AD
Relative abundance, % Verrucomicrobia
Tenericutes Synergistetes Proteobacteria Fusobacteria Firmicutes Cyanobacteria Euryarchaeota Actinobacteria Bacteroidetes
36 between the two groups while the cladogram indicated the differences based on the color and classification of their phylogeny. On the bar plot, bars lie on the left of zero indicated taxonomies that were more abundant in Japanese group than in American group and vice versa.
As indicated on the two figures, within Proteobacteria, the classes Betaproteobacteria and Gammaproteobacteria, the orders Burkholderiales, Enterobacteriales, families Alcaligenaceae, Oxalobacteraceae and Enterobacteriaceae and genus Sutterella were the factors which were less abundant in American than in Japanese group. For Euryarchaeota of kingdom Archaea, class Methanobacteria, order Methanobacteriales, family Methanobacteriaceae and genus Methanobrevibacter contributed to the imbalance, they were higher in Japanese group than those in American group.
Although the phylum Firmicutes did not make the differences between the two group, some its lower hierarchies made the differences. While class Clostridia was richer in American group, classes Bacilli and Erysipelotrichi was poorer in American group than those in Japanese group. Within the class Clostridia, families Dehalobacteriaceae, Christensenellaceae, Clostridiaceae, Lachnospiraceae, and Ruminococcaceae, and genus Anaerotruncus, Faecalibacterium, Ruminococcus, Blautia, Lachnospira, and Coprococcus created the imbalance. In the class Bacilli, order Lactobacillales, family Streptococcaceae, and genus Streptococcus brought the differences with higher abundant in Japanese group.
And within the class Erysipelotrichi, order Erysipelotrichales, family Erysipelotrichaceae, and genus Eubacterium had a higher rate in Japanese group than those in American group.
Furthermore, the phylum Bacteroidetes abundance was not different between the two groups but two their families Porphyromonadaceae and Bacteroidaceae made the differences, with higher Porphyromonadaceae and lower Bacteroidaceae abundances in Japan group than those in America group. Differences in relative abundances of families and genera which figured out by the cladogram were plotted in box plots (Fig. 21) and histograms (Fig. 22, 23) to have clearer and detailed dissimilarities between the two groups.
At the family level, notably, the family Bacteroidaceae in American AD patients were higher than those in Japanese AD patients, reached 13.95% and 8.89% in, respectively. The most abundant family, Lachnospiraceae, had 37.76% and 22.36% in American and Japanese group, respectively. The family Oxalobacteraceae seemed to disappear in Japanese AD
37 Fig 19. Bar plot from LEfSe analysis indicating significant changes in taxonomies between America and Japan groups. The related bacteria names of each column are listed at the bottom of the Y-axis, and the score number is shown on the X-axis. Japan group- enriched taxa are indicated with a positive LDA score (green), and taxa enriched in America group have a negative score (red) (p < 0.05, LDA score 10).
38 Fig. 20. Cladogram plotted from LEfSe analysis showing the taxonomic levels represented by rings with phyla in the outermost the ring and genus in the innermost the ring. Each circle is a member within that level. Those taxa in each level are colored by the groups for which it is more abundant, with the green color indicates Japan group and the red color indicates America group (p < 0.05; LDA score 2).
patients while accounted for 0.008% in American group. The Methanobacteriaceae family was richer in Japan group than that in America group.
39 Fig 21. Box plots indicating the significant differences in relative abundance at the family level of gut microbiota of participants between the two countries are shown. The upper and lower quartile with the median are shown, whiskers are extended to 1.5 times the interquartile range, and the circles show outliers.
40
Blautia
Paraprevotella Faecalibacterium
Lachnospira Ruminococcus
Coprococcus Sutterella
Bacteroides
Fig. 22. Histograms showing genus that are more abundant in American group ranked by LDA score 2. Values of all participants in each group are displayed. The mean and median relative abundance of these genera are indicated with solid and dashed lines, respectively.
As indicated in Fig. 22, the genus Sutterella, Blautia, Paraprevotella, Faecalibacterium, Ruminococcus, Lachnospira, Bacteroides and Coprococcus had higher relative abundance in American group than those in Japanese group. The genus Paraprevotella did not evenly distribute amongst all participants in the American group. The lower relative abundance of Faecalibacterium in Japanese group was an interesting result since this genus also decreased in Japanese AD group in comparison with Japanese HC group.
41
Methanobrevibacter
Butyricimonas Actinomyces
Parabacteroides
Steptococcus
Anaerotruncus
Eubacterium
Fig. 23. Histograms showing genus that are more abundant in Japanese group ranked by LDA score 2. Values of all participants in each group are displayed. The mean and median relative abundance of these genera are indicated with solid and dashed lines, respectively.
Fig. 23 showed the falling relative abundance of Actinomyces, Butyricimonas, Methanobrevibacter, Parabacteroides, Streptococuss, Eubacterium, and Anaerotruncus in American group compared to those in Japanese group.
Diversity analysis
42 The alpha diversity of the gut microbiota between Japanese AD and American AD patients were different in richness, included observed OTU and Chao1 index (Fig. 24). The observed OTU were 351.48 ± 71.11 and 449.90 ± 72.68 (p < 0.001) in Japanese and American groups, respectively. The Chao1 index reached 606.42 ± 160.43 and 1006.40 ± 217.52 (p < 0.001), corresponding to Japanese and American groups. However, there was a similarity in their diversity, consisted of Shannon index and Faith’s phylogenetic diversity.
Shannon index were 5.77 ± 0.70 in Japanese group and 5.88 ± 0.47 in American group (p = 0.56) and Faith’s PD were 22.79 ± 4.38 and 22.28 ± 4.77 (p = 0.73), respectively.
Shannon index
Japanese American Japanese American
Observed OTU
Japanese American
Chao 1
Japanese American
Faith’s PD
***
***
Fig. 24. Box plots showed comparisons of alpha diversity of gut microbiota between Japanese AD and American AD groups.
In terms of beta diversity, as indicated on PCoA plots (Fig 25), the principle components, PC1 and PC2, in unweighted UniFrac plot were 12.78% and 8.31% while they were 28.10% and 19.47% of total variation in weighted UniFrac plot, respectively. Both unweighted and weighted UniFrac analyses showed significant differences (p<0.001) in the
43 overall gut microbiota structure between American and Japanese subjects (Fig. 25). The data also revealed significantly higher inter-individual variability in the gut microbiota of Japanese subjects compared to American subjects in weighted plot. However, the inter- individual variability of Japanese group was lower than those of American group as indicated in unweighted plot.
0.10 0.20 0.30 0.40 0.50 0.60 0.70
Japan-Japan Japan-America America-America
***
***
0 0.1 0.2 0.3 0.4 0.5
Japan-Japan Japan-America America-America
*** ***
***
Unweighted UniFracdistance Weighted UniFracdistance
Fig. 25. MDS plots of unweighted UniFrac and weighted UniFrac. Each dot represents a scaled measure of the composition of a given sample, color-coded by cohort with the blue dots code for American samples and the red dots code for Japanese samples.
Metabolic pathway analysis
Different composition and diversity of gut microbiota leaded to the different metabolic pathways which generated from the gut microbiome between American and Japanese group.
The Japanese group was enriched pathways of lipopolysaccharide biosynthesis protein, butanoate metabolism, tryptophan metabolism, Staphylococcus aureus infection, geraniol degeneration, fatty acid metabolism, mineral absorption, biosynthesis of unsaturated fatty