INVITED PAPER
Special Section on Electronic DisplaysElectrostatic Tactile Display Using Beat Phenomenon for Stimulus Localization
Hiroshi HAGA†a), Kazuhide YOSHINAGA†, Jiro YANASE†, Daisuke SUGIMOTO†, Kenichi TAKATORI†, andHideki ASADA†,Nonmembers
SUMMARY We present an electrostatic tactile display for stimulus lo- calization. The 240-Hz electrostatic force was generated by the beat phe- nomenon in a region where excited X electrodes cross excited Y electrodes, which presents localized tactile sensation out of the entire surface. A 10.4- in. visual-tactile integrated display was successfully demonstrated.
key words: tactile display, electrostatic force, beat phenomenon, multi touch, user experience
1. Introduction
The success of multi-touch touchscreens has enabled intu- itive human-display interaction through touch surfaces. We have been interacting with displays via not only the visual sensory channel but also the tactile sensory channel. This meets user demand for rich tactile feedback. There are three types of tactile displays with visual information: (I) one in which the touch surface vibrates with mechanical actuators such as coil-type actuators[1]or piezoelectric devices[2], (II) an electrostatic tactile display in which the electrode is located under an insulator layer[3],[4], and (III) an electro- tactile display that directly activates sensory nerves via an electrical current[5]. In type (II), when a high AC voltage is applied to the electrode, the skin is attracted by electro- static force. The sensation is presented when a finger slides across the surface by detecting the horizontal deformation of the skin produced by dynamic friction variation transformed from electrostatic force variation. This effect is known as
“electrovibration”[6].
An important issue underlying these three types is multi-touch tactile interaction. Types (I) and (II) present the same sensation over the entire surface. Thus, all fingers that come into contact with the surface sense the same sensation.
The tactile display in type (III) contains segment electrodes to localize stimuli presented on the surface. However, this is not scalable as the number of electrodes increases because each electrode is connected to a wire. Thus, the spatial res- olution tends to be low.
From this background, our objective was to develop a novel tactile display that presents regional stimulation to ac- commodate multi-touch or multi-person tactile interaction.
This paper proposes an electrostatic tactile display featuring Manuscript received February 25, 2015.
Manuscript revised June 5, 2015.
†The authors are with NLT Technologies, Ltd., Kawasaki-shi, 211–8666 Japan.
a) E-mail: [email protected] DOI: 10.1587/transele.E98.C.1008
regional stimulation and presents a visual-tactile integrated display.
2. Related Work
Electrostatic tactile displays use the electrovibration ef- fect. Electrovibration was discovered in 1953 by accident.
Mallinckrodt et al.[7]reported that if a dry finger is moved gently over a metal surface covered with a thin insulating layer and the metal is excited with a 110 V AC power line, the surface has a characteristic rubbery feeling. They ex- plained the effect by suggesting that the insulating layer or the dry outer skin forms the dielectric of a parallel plate ca- pacitor with the metal as one plate and the conducting fluids of the finger as the other. When an alternating voltage is applied to the metal, there is an intermittent electrostatic at- tractive force between the skin and the metal. While this force is too weak to be perceived when the finger is static, it modulates friction between the surface and the skin of the moving finger, creating the rubbery sensation.
The first attempt to use electrovibration for tactile ap- plication was reported by Strong in 1970[8]. He buried an array of metal pins into plastic body, whose flat heads are insulated with a thin layer of dielectric. Different voltage signals were applied to different pins so that users could feel various tactile shapes. A similar configuration was reported by Tang et al. in 1998[9], where he fabricated an electrode array covered with an insulating layer on a silicon wafer us- ing lithographic microfabrication.
The combination of electrostatic tactile display and vi- sual display was first reported by Bau et al. in 2010[3]. The tactile display was composed of a glass plate and an opti- cally transparent electrode sheet formed on the glass plate, where the electrode was coated with an insulator layer. The visual image was projected onto a diffuser plane using a projector that was installed behind the glass plate. Tactile stimuli were formed in accordance with the visual informa- tion. Radivojevic et al.[4] reported on the combination of electrostatic tactile display and liquid crystal display (LCD) for mobile use, where the tactile display was placed over the LCD. Since these electrostatic tactile displays combined with visual displays present the same tactile sensation over the entire surface, they are not suitable for multi-touch or multi-person tactile interaction.
Copyright c2015 The Institute of Electronics, Information and Communication Engineers
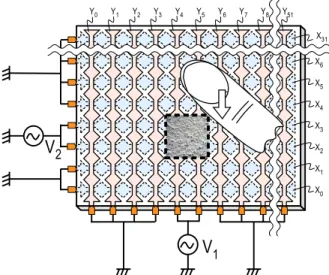
trix arrangement, and an acrylic insulator layer that covers the electrodes. This display panel presents localized stimu- lus at the region where excited X electrodes cross excited Y electrodes. The stimulus is presented when a finger slides across the region. Users experience the tactile texture of fine roughness in the region. By selecting electrodes to be excited, this display panel presents the stimulus at arbitrary positions around which the X electrode crosses the Y elec- trode. Our display uses the beat phenomenon of voltage waveforms between the electrodes to present the stimulus.
4. Principle
Figure 2 shows how our display presents tactile sensation to the finger. It is a cross-sectional view of our display in
Fig. 1 Electrostatic tactile display using beat phenomenon of voltage waveforms between electrodes.
Fig. 2 Principle of tactile display using beat phenomenon of voltage waveforms.
electrode P (Vp) can be estimated as Vp=(V1+V2)/2 when resistance R is large.
In this case, the electrostatic force Fe1induced between electrodes P and Xa is obtained using the formula for the electrostatic force of the parallel plate capacitor.
Fe1= 1 2εS
CV2−V1
2 2
, (1)
whereε=ε0εr,ε0andεr are the permittivity of free space and the relative permittivity respectively, and S is the elec- trode area of the parallel plate capacitor.
In the same way, the electrostatic force Fe2induced be- tween electrodes P and Ybis
Fe2= 1 2εS
CV1−V2
2 2
. (2)
When the pitch between the electrodes is so minute that the electrostatic force Fe1and the electrostatic force Fe2can- not be distinguished by a finger, it can be considered that the total force, which is the sum of the individual forces Fe1and Fe2, works on the finger in a macroscopic manner.
The total electrostatic force of electrode P is Ftotal = 2(Fe1 +Fe2) in the case of the figure. By substituting Acos2πf1t for V1and substituting Acos2πf2t for V2, we ob- tain Ftotal:
Ftotal
=A2εS
2d2 {1−cos 2π(f1+f2)t} {1−cos 2π(f1−f2)t}, (3) where A is the voltage amplitude, d is the thickness of the insulator and f1 and f2 are the frequencies of V1 and V2, respectively.
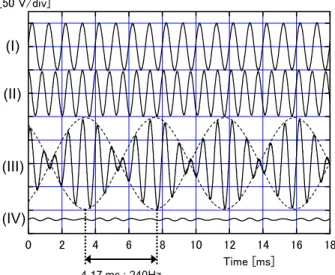
Fig. 3 Calculated waveforms of V1, V2, Vp, and Ftotal.
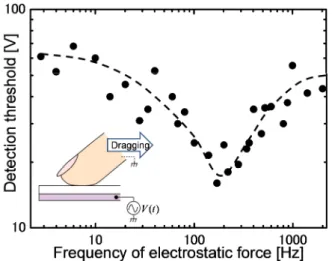
Fig. 4 Measured detection threshold voltage for different frequencies.
To understand the meaning of Formula (3), the wave- forms of V1, V2, Vp, and Ftotal are shown in Fig. 3. The envelope of Ftotal has a frequency of 240 Hz, which is the beat frequency of f1 and f2. When the finger slides across the surface in this region, the sensation is presented by de- tecting horizontal deformation of the skin produced by dy- namic friction variation transformed from electrostatic force variation of this beat frequency.
5. Design of Signal Frequency
The design of signal frequency is crucial for realizing re- gional stimulation. The sensitivity of our tactile sensory system depends on frequency. Figure 4 shows the mea- sured detection threshold voltage for different frequencies using a conventional electrostatic display, in which the elec- trode was not patterned. The detection threshold voltage is defined as the minimum voltage amplitude that creates a barely detectable sensation. Figure 4 indicates that the de- tection threshold voltage is small around a 200 Hz of elec- trostatic force. This means our tactile sensory system has high sensitivity around 200 Hz. On the other hand, we have low sensitivity over 1000 Hz.
From these findings, we selected a frequency of 1000 Hz for f1 as the Y electrode excitation and 1240 Hz for f2as the X electrode excitation. An example of the driv- ing scheme is illustrated in Fig. 5, where the electrodes in region A and B were excited by AC voltages sources whose frequencies were 1000 Hz and 1240 Hz, respectively. In this case, in region C, 240 Hz of electrostatic force at which we have high sensitivity occurs by the beat phenomenon. In contrast, in region A and B, but not in region C, there occur 2000 Hz and 2480 Hz of electrostatic force respectively, at which we have low sensitivity. Thus, users perceive tactile sensation only in region C out of all the other regions of the surface.
6. 4.1-in. Prototype Device
Figure 6 shows a schematic of the mask layout of our tactile
Fig. 5 Driving scheme example.
Fig. 6 Mask layout of our electrostatic tactile display.
Table 1 Specifications of electrostatic tactile display.
display prototype, and Table 1 lists its specifications. The important parameters to intensify the stimulus generated by the beat phenomena are electrode pitch and lateral space be- tween the X and Y electrodes. In this prototype, the elec- trode pitch is set to be small, around 1.7 mm, compared with the electrode pitch in projected capacitive touchscreens. The lateral space between the X and Y electrodes is minimized by adopting a diamond-shaped electrode. The thickness (d) of the insulator covering the electrode is 1.5μm and the rel- ative permittivity (εr) of it is 3.0.
tor of the display. The prism was connected to a conduc- tive wire, which was grabbed using an oscilloscope voltage- probe with a load of 10 MΩ/8 pF.
Figure 8 shows the display driving configuration for this measurement. A group of Y electrodes, which con- sists of Y20 to Y32, was excited by applying an AC voltage V1 with a frequency of 1000 Hz. A group of X electrodes, which consists of X10 to X21, was excited by applying an AC voltage V2with a frequency of 1240 Hz. The electrodes, except those excited electrodes, were connected to ground.
The square prism was placed in the following four positions and waveforms were measured.
• Position (I), where Y electrodes were excited by an AC voltage of 1000 Hz and X electrodes were connected to ground.
Fig. 7 Setup for electrical potential measurement.
Fig. 8 Display driving configuration for electrical potentials measure- ment.
The measured waveforms of each position are shown in Fig. 9. The frequencies of 1000 and 1240 Hz were observed at positions (I) and (II), respectively. The beat waveform was observed at position (III), which agrees fairly well with the calculated waveform of electrode P, as shown in Fig. 3.
These results confirm the validity of the principle of our dis- play.
8. Stimulus Perception Tests
To verify the performance of our tactile display, stimulus perception tests were carried out. Ten males in their 20’s to 50’s participated in the tests. The display driving config- uration for these tests creates three regions where the beat phenomenon occurs selectively (Fig. 10). The 12 excited X electrodes were X10 to X21. The Y electrodes to be excited were divided into three groups with each group consisting of 13 electrodes, Y4to Y16, Y20to Y32, and Y36to Y48, and were connected to the AC voltage source V1 through three switches. The electrodes, except those to be excited, were connected to ground. The operator selected one of three re- gions (B, D, and F) where the beat phenomenon will oc- cur by turning on the corresponding switch. This configura- tion and operation were hidden from the participants. They were asked to indicate a perceptually different region on the touch surface. They began by gently running their fingers across the surface in any way they liked and indicated if they sensed a perceptually different region. If they could not sense a perceptual difference, they indicated that there was no perceptual difference. Figure 11 shows a photograph of
Fig. 9 Measured waveforms for electrical potentials.
Fig. 10 Display driving configuration for stimulus perception tests.
Fig. 11 Photograph of participant undergoing stimulus perception tests.
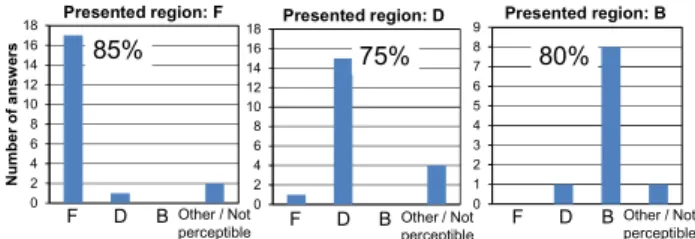
Fig. 12 Number of answers from stimulus perception tests.
a participant undergoing a stimulus perception test.
The tests results are summarized in Fig. 12. When an operator selected region F, 85% of the answers indicated region F as a perceptually different region from the entire surface. When an operator selected region D, 75% of an- swers indicated region D. When an operator selected region B, 80% of answers indicated region B. The overall average of correct answers was 80%.
Two participants out of ten failed to detect any dis- tinctive sensation on the surface. The correct answer ratio of these two participants was nearly 0%. The other eight participants scored nearly 100% of the correct answer ra- tio. Thus, the dominant factor of each correct answer ratio
Fig. 13 Finger trace examples of two participants during perception tests.
in Fig. 12 was interperson vriability. It has been reported that electrostatic tactile displays are quite sensitive to skin humidity, resulting in stimulus instability. The shielding ef- fect of the sweat layer results in an electric field formed be- tween the electrodes and the sweat layer rather than between the electrodes and the skin. Consequently, the electrostatic force on the skin decreases significantly. Furthermore, the physical characteristics of the sweat layer may prevent the production of a shear force[9]. Actually, one of our par- ticipants who failed to detect any distinctive sensation had sweaty fingers. We couldn’t find specific reason for the other participant who failed to detect any distinctive sensation.
Some participants who could detect distinctive sensa- tion described it as a surface with fine roughness at the re- gion where the beat phenomenon occurred. Other some par- ticipants described it as gummy. These sensations were per- ceived only when the participants were running their fingers.
Moreover the perceived strength of the sensation varied by the running speed. Thus the sensation was quite different from the vibration created by mechanical actuators.
Figure 13 shows finger trace examples of two partici- pants during these tests when the beat phenomenon occurred in region D, the center of the display. These results show that most participants perceived localized tactile stimulus where the beat phenomenon occurred.
9. 10.4-in. Visual-Tactile Integrated Display
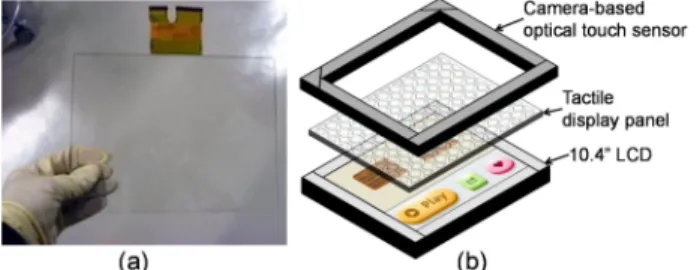
We fabricated a 10.4-in. tactile display and developed a visual-tactile integrated display as well. Figure 14 (a) shows the 10.4-in. tactile display panel, and Fig. 14 (b) shows the configuration of our visual-tactile integrated display. The 10.4-in. tactile display is mounted on the surface of a 10.4- in. LCD and the camera-based optical touch sensor is placed on the tactile display at the bezel area.
The visual-tactile integrated display operates with a PC. Figure 15 shows the system configuration. The visual image data is transmitted to the visual display block in the visual-tactile integrated display via VGA connection. The tactile mapping data which corresponds to the visual image is transmitted to the tactile display block via USB connec- tion. The touch sensor is connected to the PC via another USB port. The user can interact with the visual-tactile inte- grated display via both visual sensation and tactile sensation
Fig. 14 (a) Fabricated 10.4-in. tactile display panel. (b) Configuration of visual-tactile integrated display.
Fig. 15 System configuration of Visual-tactile integrated display.
Fig. 16 (a) “A crawling tortoise”. (b) “Ten Key” software.
simultaneously.
The processing flow of the system of our visual-tactile integrated display is quite simple and is composed of two steps: (I) writing visual-image data to the graphic frame buffer and (II) writing tactile-mapping data, which corre- sponds to the visual-image data, to the tactile frame buffer.
Owing to the feature of our tactile display, which presents localized tactile stimulus designated by tactile-mapping data written in the tactile frame buffer, the processing flow is quite different from the conventional one. That is, neither the step detecting the finger position by touch sensor nor the step generating an activate signal for an actuator related to the finger position is necessary. Thus, the system configura- tion of our visual-tactile integrated display is simple.
User experiences were confirmed on our visual-tactile integrated display by using some demonstration software.
Figure 16 (a) shows a piece of demonstration software named “A crawling tortoise”. The tactile texture is being presented on the crawling tortoise’s back limitedly; thus, multiple fingers feel reasonable tactile texture simultane- ously. If multiple fingers touch the display at the same time, the fingers sliding on the tortoise can feel the appro-
the user can rely on familiar haptic cues to accomplish even the most basic interactive tasks.
As shown above, the feature of regional stimulation could be useful in many applications including smart de- vices, cockpit displays in automobiles and aircraft to pre- vent the driver/pilot from being visually distracted, and in devices for the visually impaired.
10. Conclusion
We proposed an electrostatic tactile display for stimulus lo- calization that uses the beat phenomenon of voltage wave- forms between adjacent electrodes. We demonstrated the functionality of our display with a prototype with which most participants perceived the localized tactile stimulus where the beat phenomenon occurred. Because the stimu- lus can be localized on the touch surface, each finger should sense its own stimulus. This feature could be useful in many applications such as smart devices, devices for visually im- paired people and cockpit displays in a situation where a pi- lot or a driver should not fix their eyes on it due to attention to their way. This paper contributes to enhance user expe- rience through multi-touch tactile interaction with visual in- formation and opens up new possibilities for human-display interaction.
References
[1] M. Fukumoto and T. Sugimura, “Active Click: Tactile Feedback for Touch Panels,” CHI’ 2001, Extended Abstracts 2001: ACM, pp.121–122, 2001.
[2] I. Poupyrev and S. Maruyama, “Tactile Interface for Small Touch Screens,” UIST 2003: ACM, pp.217–220, 2003.
[3] O. Bau, I. Poupyrev, A. Israr, and C. Harrison, “TeslaTouch: Electro- vibration for Touch Surfaces,” UIST 2010: ACM, pp.283–292, 2010.
[4] Z. Radivojevic, P. Beecher, C. Bower, D. Cotton, S. Haque, P. Andrew, B. Henson, S.A. Wall, I.S. Howard, J.N. Ingram, D.M. Wolpert, A.O.
Salo, and T. Xue, “Programmable Electrostatic Surface for Tactile Perceptions,” SID 2012 Digest, pp.407–410, 2012.
[5] H. Kajimoto, “Skeletouch: Transparent Electro-Tactile Display for Mobile Surfaces,” SIGGRAPH Asia 2012, pp.1–3, 2012.
[6] K.A. Kaczmarek, K. Nammi, A.K. Agarwal, M.E. Tyler, S.J. Haase, and D.J. Beebe, “Polarity Effect in Electrovibration for Tactile Dis- play,” IEEE Biomedical Engineering, vol.53, no.10, pp.2047–2054, Oct. 2006.
[7] E. Mallinckrodt, A. Hughes, and W. Sleator, “Perception by the Skin of Electrically Induced Vibrations,” Science, 1953, vol.118, no.3062, pp.277–278, 1953.
[8] R. Strong and D. Troxel, “An Electrotactile Display,” IEEE Man-Ma- chine System, vol.11, no.1, pp.72–79, March 1970.
[9] H. Tang and D.J. Beebe, “A Microfabricated Electrostatic Haptic Dis- play for persons with Visual Impairments,” IEEE Rehabilitation En- gineering, vol.6, no.3, pp.241–248, Sept. 1998.
Hiroshi Haga received his B.E. degree in image science and technology from Chiba Uni- versity, Japan, in 1994. He then joined NEC Corporation, where he was engaged in the re- search and development of polycrystalline sili- con TFT circuits and their application devices.
In 2011 he joined NLT Technologies, Ltd. and has been developing human-display interaction technologies.
Kazuhide Yoshinaga is a member of the Development Division, NLT Technologies, Ltd., Kanagawa, Japan, where he is developing touch screen technologies.
Jiro Yanase received his B.S. and M.S.
degree in electronic physics from Tokyo Insti- tute of Technology, Japan, in 1999 and 2001, respectively. He then joined NEC Corporation, where he was engaged in the research and devel- opment of poly-silicon TFT process. He joined NLT Technologies, Ltd. and his development is poly-silicon TFT circuits and their application devices.
Daisuke Sugimoto received his M.E. degree in information processing from Tokyo Institute of Technology, Japan, in 2011. He then joined NLT Technologies, Ltd. and has been develop- ing human-display interaction technologies.
Kenichi Takatori received the Bachelor of Liberal Arts degree in pure and applied sciences from the University of Tokyo, Japan, in 1990.
He joined NEC Corporation to develop the next- generation LCDs and LTPS applications. Dur- ing 2001-2002, he stayed in the Microelectron- ics Laboratory at Universit´e catholique de Lou- vain, Belgium. He is now with NLT Technolo- gies, Ltd.
Hideki Asada received his B.E. and M.E.
degrees in electrical engineering from Keio Uni- versity in 1985 and 1987, respectively. He then joined NEC Corporation, where he was engaged in the research and development of polycrys- talline silicon TFT circuits and their applica- tion devices. He received the Special Recogni- tion Awards from the SID in 2006. In 2011, he joined NLT Technologies, Ltd. and has been in charge of the R&D Department.