INTRODUCTION
Recently, Japanese cedar pollinosis, a major factor in air pollution, has come to affect nearly 20% of the Japanese population (1), and deterioration of their QOL has become a social issue. Its onset at lower ages has also been suggested (2). About 84% of Kochi Prefecture is covered by forests, and, according to the data of the Kochi Forest Bureau, about 21% of the field area of the prefecture consists of privately owned cedar forest, and about 48% by cedar and cy-press forests combined. The Kochi Prefecture
Japa-nese Cedar and Cypress Pollen Information System was established in January, 1991 to improve the QOL of pollinosis patients by letting them understand that “pollinosis is a self-manageable disorder” and pro-viding them with information concerning preventive methods and appropriate treatments. The system was developed secondarily in the whole country as a pub-lic organization according to the investigation of Kochi Prefecture. It was also very important to pro-mote people’s understanding that pollinosis is the most striking example of a relation between the en-vironment and allergic disorders. This article reports the background of the development and the future of P-Net Kochi, which has provided varied informa-tion concerning cedar pollinosis directly or through mass media (such as television, radio, newspaper) for more than 11 years.
The development of a pollen information system for the
improvement of QOL
Hiroki Moriguchi
1, Michiaki Matsumoto
2, Yasuo Nishimoto
3, Keizo Kuwada
4 1Division of Medical Informatics, University Hospital, The University of Tokushima School of Medi-cine, Tokushima Japan ;2Environmental Preservation Division, Department of Culture and
Environ-ment,3Public Health Policy-Making Division, Department of Public Health and Welfare, Kochi
Pre-fectural Government ; and4Mitsubishi Electric Information Systems Corporation, Shikoku Branch
System Section, Takamatsu, Kagawa, Japan
Abstract: The Kochi Prefecture Japanese Cedar and Cypress Pollen Information System (P-Net Kochi) was established in 1991 on the initiative of the Pharmaceuticals and Sani-tation Division to improve the quality of life of people in Kochi Prefecture, particularly patients with pollinosis. Kochi Prefecture has the highest forests percentage (84%) in Japan. In addition, 40% of the population of the prefecture is concentrated in Kochi City. The average pollen count at 10 observation points an one year was about 20,000/cm2during the observation period, but it exceeded 110,000/cm2in 1995, when it was also high nationwide. Kochi Prefecture organized a system to promote people’s understanding of pollinosis in connection with environmental problems, and to enlighten people on appropriate preven-tive measures. The system has been improved in the rapid and efficient transmission of information over the years with technological advances. The introduction of an automatic monitoring system not dependent on human labor and the support of the users proved to be indispensable for the maintenance of the system. J. Med. Invest. 48 : 198-209, 2001
Keywords : Japanese cedar, pollen, pollinosis, information system, Kochi Prefecture, QOL.
Received for publication July 9, 2001 ; accepted July 31, 2001.
Address correspondence and reprint requests to Hiroki Moriguchi, M.D., Division of Medical Informatics, University Hospital, The University of Tokushima School of Medicine, Kuramoto-cho, Tokushima 770 - 8503, Japan and Fax : +81- 88 - 633 - 9410.
ORIGINAL
The Journal of Medical Investigation Vol. 48 2001
198 198
Background of the development of P-Net
Kochi
The suspended cedar and cypress pollen counts are determined by the Durham sampling method, i.e. collecting pollen using a glass slide coated with petrolatum, staining the slide, and counting the pol-len. In Kochi Prefecture, information covering such a wide area had never been provided on a daily basis before or without interruption. A new system was developed with the understanding that its establish-ment would be a turning point from the conventional pharmaceutical administration dependent on regu-lations by law to a scientific administration focused on environmental problems. The development of the system was prompted by two factors. The first was the limitation of pharmaceutical administration in the early 90’s based on the Pharmaceutical Affairs Law. The patient may have better contact with pharmacies if the pharmacies play advisory roles in addition to giving an explanation of drug effects. The second was an urge to create an environment in which people understand pollinosis as an allergic and self-control disorder. In 1990, ‘The Life Fund’ sponsored by the Kochi Newspaper invited contributions of articles on this subject, and my paper attracted the attention of a judge from the Kochi Prefectural Government, who made inquiries on the contents and feasibility of such a system. The prefecture secured a nation-al budget for the project, and assumed it as a pre-fectural project. Being commissioned by the prefec-ture, I started detailed evaluation in cooperation with my colleagues, and established a system for pollen monitoring, drafted a program, made arrangements for guidance in pollen counting by experienced clini-cal examination engineers of the National Hospital, and requested cooperation with the mass media. The pollen information system was named Kochi Prefec-ture Japanese Cedar and Cypress Pollen Information System, nicknamed P-Net Kochi (“P” standing for “pollen”), to make the system popular among the people in Kochi Pref., and to incorporate similar sys-tems for the collection and distribution of pollen in-formation that was expected to be established as a network covering a wide area for exchange of infor-mation among such systems under the same name. We used the term “cedar and cypress”, because the cedar and cypress have a common antigen (3, 4). Distinction between cedar and cypress pollen was impractical, because the observers were not fixed, were able to allot only limited time for daily observa-tion, and operated in shifts.
Details of the system composition
1. System composition between 1991-1997
The observations were made daily at 10 public health centers and 2 medical institutions in the pre-fecture except on Sundays and national holidays from January through April each year, and the infor-mation was provided to the inhabitants of the prefec-ture via mass media. The contents of information were the state of cedar and cypress pollen dispersion, temperature, wind direction, wind velocity, and pre-cipitation. The meteorological data were AMeDAS (Automated Meteorological Data Acquisition System by NTT*
) data at 8 observation points near the public health centers purchased daily from the Kochi Branch of the Japanese Meteorology Association through fax. The observation points were 10 public health cen-ters and 2 medical institutions (National Higashi Kochi Hospital (presently National Kochi Hospital) and Kochi Nokyo General Hospital). The observation period was 24 hours a day (9:00 a.m.-9:00 a.m.) generally from January through April, and the data were provided as the pollen count/cm2
. As for the data on holidays, the mean value between those was used. The data at each observation point were first transmitted to the Pharmaceuticals and Sanitation Division of Kochi Prefecture by telephone at about 9:30 a.m. and were input with meteorological data into spreadsheet soft-ware, which displayed the pollen count and meteoro-logical data at each point. Furthermore, a weekly chart was prepared, sent to NTT halo dial*
, F-NET* , and the Kochi Branch of the Japan Meteorology Associa-tion between January and April, and were made avail-able to users through F-NET at a particular fax num-ber. Between February and April, simple comments concerning the state of pollen dispersion and pre-ventive measures in daily living were made by a staff member (initially the staff of the Pharmaceuticals and Sanitation Division only) on the basis of the weath-er conditions of the day and knowledge about pollen dispersion. Material, which was a map of Kochi Pre-fecture on which the wind direction, pollen count, and comments were indicated, was prepared with a word processor and was sent to the mass media and NTT halo dial. This was for the convenience of some mass media that carried our material directly. Cedar and cypress pollen are counted by the method of the Committee for Standardization of the Measurement of Air-Borne Pollens and Pollen Information. Con-cerning the risk level of pollinosis, the alarm range was set tentatively at 10/cm2
/day or higher in 1991, 199
The Journal of Medical Investigation Vol. 48 2001 199
but the following 3-level criteria derived from the relation between the results of patient surveys and the pollen counts have been used since 1992.
Safe (0 count/cm2 ) Attention (0-30 count/cm2 ) Precaution (31- count/cm2 )
2. System composition after 1998
With the increased the use of the Internet, we began to distribute our information through an in-formation web site of Kochi Prefecture in 1998. Dis-tribution of pollen information at web sites has be-come common nationwide (Table 2) to the advan-tage of exchange of information with patients and alleviation of their symptoms (5). In 1999, the data of pollen counts were stored in a database created on a newly purchased server, and a system to
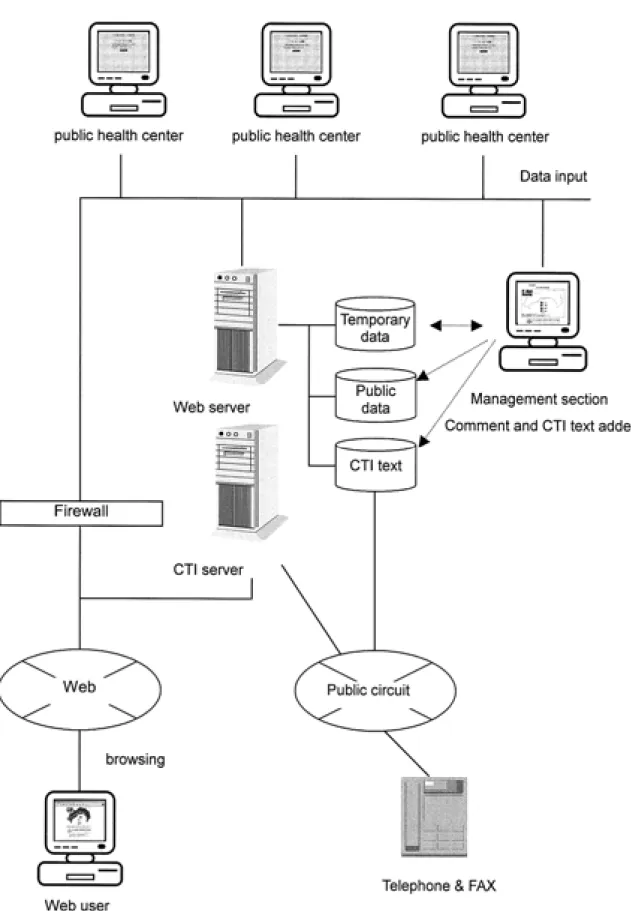
pro-vide information on demand vocally and by fax, in addition to a web site, was introduced by means of CTI*
. The pollen counts began to be sent to the pol-len information page of the Homepage for Healthy Living/Virtual Health City of Kochi Prefecture from web terminals, leading to a reduction in the staff’s duty of answering telephone inquiries. As Internet users increased rapidly, and as automatic distribu-tion of informadistribu-tion through fax and telephone became possible by CTI, we stopped providing information through NTT F-NET and halo dial in January, 1999, and the mass media and the homepage became the primary channels for transmission of our informa-tion. CTI is a computer with built-in audio board and switchboard that converts defined sentences to synthetic voice and fax, and sends them to the users on demand. Users can request the service by send-ing a pre-determined 3-digit number by operatsend-ing telephone keys (pulse or tone signals ; INS*
4×2=8
lines available). In 1998, data files on the web serv-er wserv-ere named by the date (e.g. 119990221.TXT), data were prepared sequentially using ASP+VBScript in such an arrangement as pollen count-temperature-wind direction-wind velocity-precipitation-repeat, and the
Table 1. System composition
Investigation item Investigation point Kind of information For press Contents Usage For general Contents Access OS Application Language DB
pollen dispersion number, temperature, wind direction, wind velocity, precipitation, number of patients with pollinosis*
pollen counts : 10 public health centers, 2 medical institutions weather : 8 AMeDAS points near public health center
comment corresponding to the pollen count measured at ten public health centers and wind direction at 9 : 00 a.m.
each press release by F-NET*, NTT halo dial*, FAX from the beginning of February.
pollen counts at ten public health centers and two cooperation medical institutions and AMeDAS data : temperature.wind direction,wind velocity, precipitation at 9 : 00 a.m.
Telephone service 0888-73-8600* #8886* 9 : 00 a.m. - 8 : 00 p.m. (only by touch tone)
NTT F-NET number 182・#284088825286901#*
Web, CTI MS-DOS*
Windows NT Server 4.0 + ServicePack 4 Lotus1-2-3*, Ichitaro*, Hanako*
macro*, MS-DOS BASIC*(for making graphs of pollen counts of various points and the
weath-er), ASP, Java and JavaScript Oracle Workgroup Server 8.04 Note
*is currently used. - MS : Microsoft Co. IIS4.0 : MS internet Information Server 4.0 ASP : Active Server Pages. Microsoft,
MS-Windows, MS-DOS, ASP, and IIS are registered trademarks in the United States of Microsoft Corporation and other countries. Lotus1-2-3 is the registered trademark of Lotus Development Corporation in the United States and other tries. Oracle Workgroup Server is the registered trademark of Oracle Corporation in the United States and other coun-tries. Trademark, which contains Java and other Java, is the trademark of United States Sun Microsystems, Inc.. Ichitaro and Hanako are registered trademarks of Justsystem Corporation in Japan.
H. Moriguchi et al. The development of pollen information system 200 H. Moriguchi et al. The development of pollen information system 200
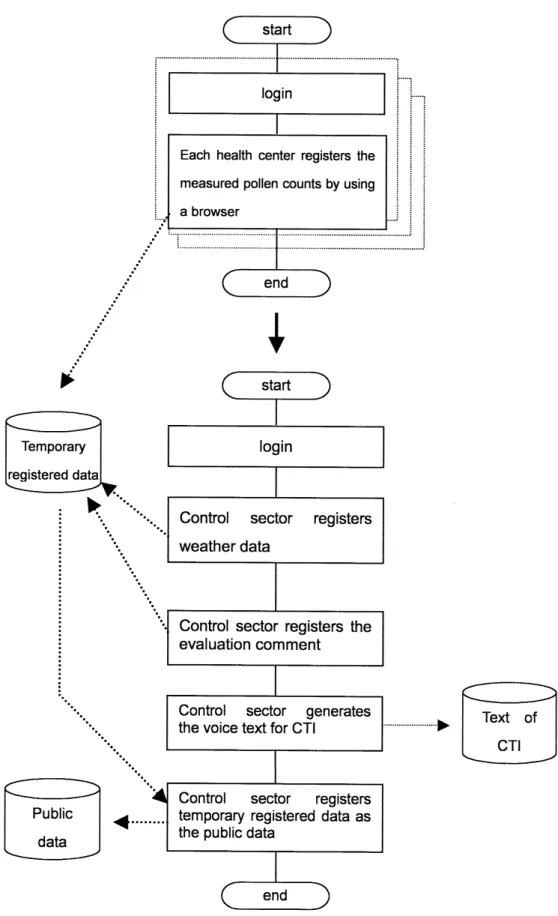
staff member in charge checked the data input using a browser with JavaScript, registered them tempo-rarily on the server, and sent the temporary data to the server of Kochi Prefecture using application soft-ware written in Visual Basic. At this time, pollen maps, graphs, and tables were created using Java and JavaScript. Modifications were made in 1999, and the data came to be preserved in the database Oracle 8.04. Data registration was accomplished with ASP+VBScript+JavaScript (parameter check), and data display with ASP+VBScript+JavaScript (param-eter check) +Java (parts of map and graph display), resulting in acceleration of operations. Data were checked by the mass media through the web, al-though they were still partly distributed by fax, which could now be sent directly from the computer. Table 1 summarizes the investigation methods, methods for distribution of information, the contents displayed and the language and OS used. Fig. 1 shows former screen of application and present Web screen. Fig. 2 shows a flowchart of information distribution.
Each public health center temporarily registers the pollen count data on the temporary registration screen by inputting them in the form on the browser. At this point, the data cannot be read from outside. The Phar-maceuticals and Sanitation Division analyzes the me-teorological data and the state of pollen dispersion, input comments including cautions for prevention, prepares the text for CTI, registers the temporary data as public data to be presented (Fig. 3).
For users, the information was shown on the initial page as icons corresponding to pollen counts near the observation points with the wind direction. The actual pollen counts and AMeDAS data were shown
below as a list. When the cursor is brought to a given observation point, the pollen count at the point is automatically displayed. As mentioned above, there are 3 icons, with the safe icon, attention icon, and precaution icon indicating pollen counts of 0, 1-30, and 31-, respectively. The overall evaluation of pollen counts was shown as a figure of whale icon, which symbolize Kochi Prefecture (Fig. 4). The overall evaluation was defined as Level 0 when there was 1 or more precaution icons, Level 1 when there ware 2 or more safe icons, Level 2 when there ware 4 or more safe icons, and Level 3 when there ware 6 or more safe icons and no precaution icon.
Past information can also be reviewed, and the data of a given period (within 5 consecutive months) and a given region selected on the browser are displayed as a line graph. In addition, all the information in-cluding National Kochi Hospital and Nokyo General Hospital is displayed as a weekly report by select-ing a suitable day in the calendar. There is no par-ticular problem in the responses to the above maneu-vers during the pollen season even through low-speed lines because of the small volume of images and the high speed of the server (Fig. 5).
*
NTT : Nippon Telephone & Telegraph*
halo dial : Information service by the operator of NTT*
F-Net : fax delivery service of NTT*
CTI : computer telepho-ny integration*
INS : Information Network System, ISDN service of NTT
Report of current state
The latest software versions are currently being
Table 2. Pollen dispersing information homepage list (prefecture presents)
Hokkaido Niigata Pref. Toyama Pref. Ishikawa Pref. Gunma Pref. Nagano Pref. Saitama Pref. Tokyo Shizuoka Pref. Gifu Pref. Aichi Pref. Mie Pref. Oosaka Pref. Hyogo Pref. Tokushima Pref. Kochi Pref. etc. http://www.iph.pref.hokkaido.jp/ http://www.pref.niigata.jp/hokanken/kafun_t.html http://www.fes.pref.toyama.jp/pollen/pollen_2.html http://www.pref.ishikawa.jp/ringyo/kafun/ http://www.pref.gunma.jp/ http://www.nagano-eikouken.or.jp/ http://www.pref.saitama.jp/a04/bd00/kafun.htm http://www.metro.tokyo.jp/index.htm http://www.siz.saiseikai.or.jp/~jibika/kafun.html http://www.pref.gifu.jp/s11223/kafun/ http://www2.pref.aichi.jp/kafun/index.html http://www.medic.mie-u.ac.jp/kafun/ http://www.iph.pref.osaka.jp/topics/etc/kahun.html http://www.iph.pref.hyogo.jp/users/info/k-hoken/pollen/pollen.html http://www.pref.tokushima.jp/ http://www.med.net-kochi.gr.jp/ 201
The Journal of Medical Investigation Vol. 48 2001 201
Fig. 1
H. Moriguchi et al. The development of pollen information system 202 H. Moriguchi et al. The development of pollen information system 202
introduced into ten public health centers. The infor-mation is input in the form on the homepage, and National Kochi Hospital and Kochi Nokyo General Hospital use the telephones to report the informa-tion. The person in charge concentrated on input and data reduction before the introduction of this new system and was constantly busy in operation be-cause all the data was reported by telephone. After the new system was introduced, the operator was able to concentrate on the comment making. Since the fax was able to be sent directly from the com-puter, the time for printing was saved. Moreover, because the Internet technology was used, the time for the maintenance of the application is unneces-sary. Since the icon for the number of dispersions and the wind direction is displayed including past information by an easy operation on the homepage and the number of dispersions can be displayed in the form of graph in a time series, this system became user-friendly. In addition, users who had not joined the Internet can obtain information from CTI. How-ever, we recognized that residents found it difficult to locate the telephone number of CTI though a maga-zine containing this information that had already been issued. The process was improved by the new
system which introduced information other than that of the pollen dispersion number measurement.
DISCUSSION
Information of pollen dispersion has become pe-riodically available, although the staff members in charge had difficulty in explaining how the informa-tion should be utilized, because they had no experi-ence of being routinely engaged in such a task. The residents and pharmacies also initially felt it difficult to effectively utilize the information because of the lack of experience. In those days, much of the infor-mation distributed by the prefectural authorities was simply numerical raw data. Since the pollen infor-mation derived from public health centers has been processed into more understandable forms, the public and pharmacies have accepted them as part of their common knowledge. It is particularly worth men-tioning that people began to use pollen information as an everyday resource. In addition, diverse meth-ods were used to transmit the information includ-ing fax and telephone services as well as providinclud-ing information via the press. Since the information was
Fig. 2
203
The Journal of Medical Investigation Vol. 48 2001 203
Fig. 3 Pollen data register processing
H. Moriguchi et al. The development of pollen information system 204 H. Moriguchi et al. The development of pollen information system 204
provided in such a manner that it could be utilized by anyone, it was processed and presented for the objectives of each user. This was considered to be similar to the current trend of information disclosure. Moreover, the administration used to consider that information distribution was simply transfer of what they were doing and what they knew, but they be-gan to realize that it is important to provide infor-mation in such a manner that it contributes to im-provements in the QOL of the residents, who are the end users, by learning to utilize it as knowledge useful in their living. Pharmacies realized the importance of utilizing diverse local information other than expert knowledge for conducting consultations and guidance on a scientific basis. For example when drivers of transport companies were substituted and that they drove via routes outside the pollen-dense areas, the
staff members in charge of pollen information dis-tribution began to realize that their task was directly affecting the residents. The residents understood that information closely related to them improve the quality and convenience of their living. According to readers’ letters to newspapers, pollen counts may be regarded as simple numerical data by their pro-viders, but their changes exerted marked psychologi-cal effects on their recipients, so that it was learned that providing information as objectively as possible was important. Subsequently, washing information and ultraviolet ray information began to be released in the prefecture. Until pollen information came to be issued, pollinosis was scarcely recognized even at the clinic in the prefectural office building spon-sored by the civil servants’ union;it used to be con-sidered “persistent sneezes” or “chronic cold”.
Rag-Fig. 4 Display pollen dispersion situation map
205
The Journal of Medical Investigation Vol. 48 2001 205
weed pollinosis was known, but cedar or cypress pollinosis was hardly documented. However, as pol-len information became available through television, radio and newspapers, the media began to feature pollinosis in their programs and articles, leading to a gradual spread of the awareness that pollinosis is a condition related to air pollution occurring in the context of environmental problems and that it can be prevented. That is, pollinosis came to be recog-nized as “an environmentally-induced disease”. Also, providers of information were required to sufficient-ly explain how such information should be utilized as knowledge useful for living.
For the field observers, who are the source of the information, experience was needed to distinguish cedar and cypress pollens from other pollens particu-larly during the middle and late periods of the pol-len season, because the shape of polpol-len is affected by the weather and is not necessarily spherical, but it was learned that the distinction was possible if observations were started at the beginning of pollen dispersion. Since experience is needed for this judg-ment, we sampled flower buds of cedar, prepared slides of typical pollen, and used them for training
staff members at public health centers to improve the precision of field data. Since the measurement was performed daily by staff members who had their regular administrative duties, a shift system was em-ployed. One person was assigned to this task for 1 hour per day. There were problems such as the mea-surement was difficult on rainy days, that rigid con-formity to the deadline was required for the report of the results, and that the observers lacked the perception that they were directly involved in the information service. Strict observance of the deadline was accepted as unavoidable for regular release of information assigned to this section, but as pollen counting was made by a limited number of staff mem-bers, we immediately faced difficulties when com-plaints from residents were made. The staff mem-bers of our section in charge of data collection and processing were required to deal with the residents and mass media.
It was necessary to transmit accurate information quickly in an easy-to-understand form. Frequent inquiries made by the residents were “Isn’t the in-formation that appears in newspapers one day late?” and “The information of the day is not the
informa-Fig. 5 Display pollen counts transition graph
H. Moriguchi et al. The development of pollen information system 206 H. Moriguchi et al. The development of pollen information system 206
Fig. 6 Relation between CTI server and WWW Server
207
The Journal of Medical Investigation Vol. 48 2001 207
tion of the present time.” We could only respond to these inquiries by saying, “Please use the infor-mation as a reference and take preventive measures based on your judgment.” From the mass media, there was a request for a prediction of pollen dispersion for the entire season before the beginning of our information release. At first, we only had data for nationwide prediction, but as Director Itoh (then) of the Forest Experiment Station, Kochi Prefectur-al Government was investigating mPrefectur-ale flowers of standard cedar trees at more than 10 temples and shrines in the prefecture, we were able to predict the total pollen dispersion of the next season fol-lowing his instructions.
After the system was established, the interest of the mass media increased, and we received many questions about treatment and prevention from pa-tients. We expected that patients would obtain infor-mation primarily from medical facilities, but they directed their interest in more detailed features such as points of attention in daily living. Therefore, they became more enthusiastic and motivated toward pol-len counting, and public health centers with limited human resources began to obtain cooperation from clinical technicians and public health nurses in ad-dition to the staff related to the Pharmaceuticals and Sanitation Division. Presently, information is col-lected and transmitted, and the system is improved and managed, primarily by the Pharmaceuticals and Sanitation Division.
The homepage was the method of convenient in-formation transmission to the residents accessed by a large number of users, with 15,000 requests having been made in March, 2001, which was the peak of the season. However, during the past 11 years, a total of 10,000 person・hours were allotted to the measurements, indicating that pollen counting is a very labor-demanding task. Moreover, a delay of 2 days in newspapers, and a delay of 1 day even by television and the web, is inevitable for the release of pollen information. Although prediction of pollen dispersion by means of simulation has been attempted (6), this problem is expected to be solved by install-ing automatic pollen counters (usinstall-ing laser diffusion light or ultraviolet rays), which have recently come into practical use, at various monitoring points.
In the course of system development, we recog-nized that the understanding of residents is neces-sary to continue a public system, and to spend funds for upgrading to analyze the accumulated data to reduce the information issued to the residents. The stored data showed some results such as precaution
zones of pollen counts of pollinosis, a close associa-tion between the pollen count and the weather in July of the previous year (7-9), the wind directions where pollen scatters most, and the total cedar pol-len count correlated closely with the flower-bearing index (10, 11). These results were used to make the comments each day and to forecast the number of pollen dispersions of the next year.
Finally, we obtained knowledge to improve the system, which were as follows :
1. The sharp age sense is necessary to make lasted system,
2. The ability to apply the current technology is im-portant to realize a system which moves well, 3. The idea based on social knowledge is necessary
to make a practicable system.
Systematized physical infrastructure and human organizations are needed to collect information and distribute it daily without failure for improving the QOL of residents. The release of pollen information through the web is expected to undergo further de-velopments as a new style of regional health pro-tection service that provides information related to health and living customized for the needs of local residents.
Plans for the future
This article presented the circumstances of the system development, the introduction of the system composition and the roles played by P-Net Kochi during the past 11 years for the improvement of the QOL of pollinosis patients. To transmit information efficiently and to steadily maintain the system, a well-organized management system, sound concepts, and the support of users who effectively utilize the information are required. To provide information rapidly, sufficient installation of an infrastructure such as automatic counters are considered to be necessary. If the information obtained by automat-ic counting is transmitted to the web via the Kochi Prefecture Intranet, which connects public facilities in the prefecture by optic cables, real-time release of information becomes possible. In addition, infor-mation that will be obtained by the automatic coun-ters calibrated by the conventional method will reduce manpower. Systematization using current-ly available technology is considered to be very im-portant.
H. Moriguchi et al. The development of pollen information system 208 H. Moriguchi et al. The development of pollen information system 208
REFERENCES
1. Nishihata S, Inoue S, Saiga T, Sahashi N, Suzuki S, Murayama K, Yokoyama T, Saito Y : Preva-lence rate of allergy to Japanese cedar pollen in Tokyo- -from field investigation in 1996 by Tokyo Japanese Cedar Pollen Allergy Measure-ments and Review Committee. Jpn J Allergol (in Japanese) 48 : 597-604, 1999
2. Masuda S, Terada A, Fujisawa T, Iguchi K : Japa-nese cedar pollinosis in infants in the allergy clinic. Jpn J Allergol (in Japanese) 49 : 1138-1145, 2000
3. Kingetsu I, Ohno N, Hayashi N, Sakaguchi M, Inoue S, Saito S : Common antigenicity between Japanese cedar (Cryptomeria japonica) pollen and Japanese cypress (Chamaecyparis obtusa) pollen, I. H-2 complex affects cross responsive-ness to Cry j 1 and Cha o 1 at the T-and B-cell level in mice. Immunology 99 : 625-629, 2000 4. Yasueda H, Saito A, Sakaguchi M, Ide T, Saito
S, Taniguchi Y, Akiyama K, Inouye S : Identifi-cation and characterization of a group 2 conifer pollen allergen from Chamaecyparis obtusa, a homologue of Cry j 2 from Cryptomeria japoni-ca. Clin Exp Allergy 30 : 546-550, 2000
5. Imai T, Endo T, Ozawa M, Ono M, Nagakura H, Katayama N, Nohara O, Saneyoshi K, Ohmori T, Moro Y, Ui N, Moriyama H : The counter-measure to pollinosis by a web site of Internet. Jpn J Allergol (in Japanese) 49 : 495-504, 2000
6. Takahashi Y, Kawashima S, Aikawa S : Pollen information of airborne Japanese cedar pollen using a simulation method. Jpn J Allergol (in Japanese) 45 : 371-377, 1996
7. Yamazaki F : Studies of the pollen grains causing pollinosis (10). Correlation between sugi pollinosis and mean ten day temperature in July. Jpn J Allergol (in Japanese) 34 : 305-309, 1985 8. Kishikawa R, Nagano H, Katsuta M, So N : The
annual variations in airborne Cryptomeria ja-ponica and Cupressaceae pollen counts and me-teorological conditions in Fukuoka City- -prediction of Cryptomeria j. and Cupressaceae. pollen counts. Jpn J Allergol (in Japanese) 37 : 355-363, 1988 9. Namba H, Saitou K, Sahashi N : Assumption of the area supplying Okayama Prefecture with Cryptomeria japonica and Cupressaceae airborne pollen, and of their scattering routes. Jpn J Allergol (in Japanese) 48 : 1337-1347, 1999 10. Taira H, Teranishi H, Kenda Y : Comparison of
predictive methods of Sugi (Cryptomeria) at-mospheric pollen counts using mean tempera-ture, solar radiation and male flowering index- -an example of Toyama Prefecture. Jpn J Allergol (in Japanese) 46 : 489-495, 1997
11. Ogasawara H, Adachi O, Sakagami M,Yoshimura S, Fujitani T : Forecast of total pollen counts of sugi (Cryptomeria japonica) from the amount of male flower development and the revised total pollen counts. J Otolaryngol Jpn (in Japa-nese) 103 : 742-747, 2000
209
The Journal of Medical Investigation Vol. 48 2001 209