JAIST Repository: Method for estimating monaural DOA and distance using modulation spectrum analysis
69
0
0
全文
(2) Master’s Thesis. Method for estimating monaural DOA and distance using modulation spectrum analysis. Wang Rui. Supervisor Masashi Unoki. Graduate School of Advanced Science and Technology Japan Advanced Institute of Science and Technology (Information Science). March, 2021.
(3) Abstract Human has an amazing ability to locate target sound source. Sound localization is one of the most important senses of human hearing include direction of arrival (DOA) and distance. It happens every minute when we hear some voices. For example, people can spot a car from its sound to avoid danger. In general, people with two normal ears hearing can perceive the sound location easily. Due to the different position of the two ears relative to the sound source, the time and level of the sound reaching the two ears will also be different. This is called binaural cues include interaural time differences (ITD) and interaural level differences (ILD). But for people that have only one ear hearing, the binaural cues can not be used in sound localization. Yet some studies found that people with monaural hearing (single ear) can perceive sound location include DOA and distance by using monaural cues. However, it is not yet clear how human can use these cues to perceive the direction of arrival (DOA) of a sound source of 3D space. Therefore, how can human perceives the sound location become an important research issues in the related study of hearing mechanism. On the other hand, in the application of engineering, sound localization is a common used technology in many acoustic fields such as noise reduction, speech recognition, robot acoustic system, target tracking and so on. In general, typical DOA and distance estimation method is based on microphone arrays by using binural cues like Time Difference of Arrival (TDOA) method. Schmidt also proposed Multiple signal classification algorithm (MUSIC) in 1979, which has became a classical method in sound localization. However, no matter TDOA and MUSIC method, they are all multichannel signal processing methods. Such method always request a certain number of microphones. And these microphones are required to be located at certain intervals in application, which will bring spatial and mechanical constraint in many environments. Some researchers start to investigate the possibility of single microphone localization. Takashima proposed a monaural sound localization method based on GMM (Gaussian Mixture Model). However, this method needs huge training data and the related features in signal still are still unknown. In addition, most of current monaural sound localization method are only useful in 2D plane. In this case, if we can apply human ability for monaural sound localization to the engineering issues, a method of estimating DOA of the target sound in 3D space using monaural cues can be realized as applications of single-channel auditory signal processing..
(4) Recently, it has been widely acknowledged that human can use the monaural cues for sound localization. It has been reported that the possible monaural cues are often referred to spectral cues in the head-related transfer function (HRTF). Moreover, it has also been suggested that modulation cues play an important role in monaural DOA estimates. Based on these researches, some studies have indicated interest in using the monaural modulation spectrum (MMS) in monaural DOA estimation. Ando et al. reported the feasibility of estimating monaural DOA based on MMS by using the modulation transfer function (MTF) but it is only useful for 2D plane. Bui et al. then proposed a 3D monaural DOA estimation method using MMS. However, this method has a large root-mean-square-error (RMSE) in monaural DOA estimation and the performance varies greatly in different positions. In addition, in all the MMS based monaural localization researches, only monaural DOA was studied. The possibility of monaural sound soure distance estimation by using MMS has not been investigated. This paper aims to investigate the monaural cues related with DOA and distance of sound source in MMS and propose a method for estimating monaural DOA and distance in 3D space using modulation spectrum analysis. It is believed that MMS can be used to estimate monaural DOA as well as distance of sound source. Our previous proposed method has proved that MMS can be used in monaural DOA estimation in 3D space. But, unfortunately, there is a large RMSE in that method. So, to achieve the research goal, there are two steps in this study. First, improve the performance of MMS based monaural DOA estimation method in 3D space. Secondly, investigate the related features in MMS that could be used in monaural distance estimation and proposed a method for monaural distance estimation using MMS features. In step 1, this study made a investigation of the possible reasons that cause the large RMSE in our previously proposed method. As a result, it was found that unreasonable boundary conditions in the estimation algorithm and the under-fitting problem in the polynomial regression model give rise to the large RMSE in monaural DOA estimation. Then, the unreasonable boundary conditions were removed so that the RMSE of DOA estimation of some points in the edge of 3D space decreases. After that, this paper tried to increase the polynomial regression order to reduce the RMSE in DOA estimation. In this process, the influence of the polynomial regression order to the RMSE of regression model was investigated. The optimal order of regression model was determined to be 8. All the processes are described in Chapter 3. Then in step 2, a monaural distance estimation method based on MMS features is proposed. In our investigation of monaural distance perception, 2.
(5) it was found that, under a certain reverberation, long distance transmission will reduce the modulation depth of the signal. Different distances will cause different change in modulation spectrum. Sounds arriving at a long distance are harder to hear than at a short distance. The received signal will be affected by reverberation to different degrees depending on the distance of sound source. In our investigation, the slope feature of MMS was found to be related with absolute monaural distance estimation since it can reflect the change of MMS shape caused by distance in transmission. These contents are contained in Chapter 4. Simulations with several signal types and multiple subjects were carried to simultaneously estimate the DOA and distance of an incoming sound source in 3D space. HRTF database and image source method (ISM) were used to simulate sound sources with different directions and distances. The results of separate estimation of DOA and distance are reflected in Chapter 3 and Chapter 4 respectively. After that, a joint estimation include DOA and distance in 3D space was described in Chapter 5. Finally, there is a general discussion about the overall estimation method. The results show the effectiveness of our proposed method for estimating monaural DOA and distance using modulation spectrum analysis.. 3.
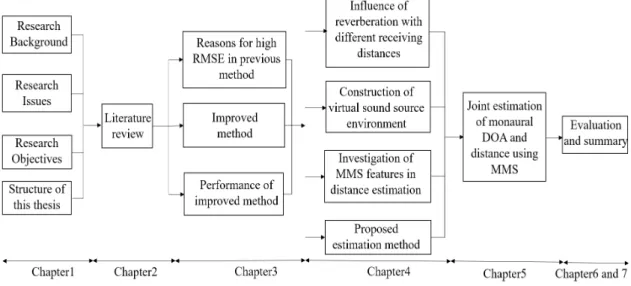
(6) Contents 1 Introduction 1.1 Research Background . 1.2 Research Issues . . . . 1.3 Research Objectives . . 1.4 Structure of this Thesis. . . . .. . . . .. . . . .. . . . .. . . . .. . . . .. . . . .. . . . .. . . . .. . . . .. . . . .. . . . .. . . . .. . . . .. 2 Literature Review 2.1 Overview of Sound Localization . . . . . . . . . 2.2 Head-related Transfer Function . . . . . . . . . 2.3 DOA Estimation Method . . . . . . . . . . . . . 2.3.1 Binaural Cues in DOA Estimation . . . 2.3.2 Monaural Cues in DOA Estimation . . . 2.4 Monaural Modulation Spectrum . . . . . . . . . 2.4.1 Concept of MTF . . . . . . . . . . . . . 2.4.2 Monaural Modulation Spectrum (MMS) 2.5 Previous Monaural DOA Method . . . . . . . . 2.5.1 Related Features in MMS . . . . . . . . 2.5.2 Estimation Strategy . . . . . . . . . . . 2.5.3 Problems in the Proposed Method . . . . 2.6 Sound Distance Estimation . . . . . . . . . . . . 2.6.1 Binaural Cues . . . . . . . . . . . . . . . 2.6.2 Sound Intensity . . . . . . . . . . . . . . 2.6.3 Spectral Cues . . . . . . . . . . . . . . . 2.6.4 Amplitude Modulation (AM) Cues . . .. . . . . . . . . . . . . . . . . . . . . .. . . . . . . . . . . . . . . . . . . . . .. . . . . . . . . . . . . . . . . . . . . .. 3 Method of Monaural DOA Estimation using MMS 3.1 The Causes of Problems in Previous Method . . . . . 3.2 Improved Method . . . . . . . . . . . . . . . . . . . . 3.2.1 Adequate Polynomial Regression Model . . . . 3.2.2 Optimal Order for the Estimation Model . . .. 1. . . . . . . . . . . . . . . . . . . . . . . . . .. . . . . . . . . . . . . . . . . . . . . . . . . .. . . . . . . . . . . . . . . . . . . . . . . . . .. . . . . . . . . . . . . . . . . . . . . . . . . .. . . . .. 1 1 3 4 5. . . . . . . . . . . . . . . . . .. 7 7 7 9 9 11 13 13 13 15 15 18 19 19 20 20 21 22. . . . .. 23 23 23 23 26.
(7) 4 Proposed Method for Monaural Distance Estimation 4.1 Influence of Reverberation with Different Receiving Distances 4.2 Construction of Virtual Sound Source Environment . . . . . . 4.2.1 Image Source Method (ISM) . . . . . . . . . . . . . . . 4.2.2 Room Impulse Response (RIR) at Different Distances . 4.3 Investigation of MMS Features in Distance Estimation . . . . 4.4 Proposed Estimation Method . . . . . . . . . . . . . . . . . .. 30 30 31 31 33 38 42. 5 Joint Estimation of Monaural DOA and Distance. 44. 6 Evaluation 6.1 Evaluation of Improved Monaural DOA Estimation Method . 6.1.1 Discussion . . . . . . . . . . . . . . . . . . . . . . . . . 6.2 Evaluation of Proposed Distance Estimation Method . . . . . 6.2.1 Discussion . . . . . . . . . . . . . . . . . . . . . . . . . 6.3 Evaluation of Joint Estimation of Monaural DOA and Distance 6.3.1 Discussion . . . . . . . . . . . . . . . . . . . . . . . . .. 46 46 47 47 50 51 51. 7 Conclusion 52 7.1 Summary . . . . . . . . . . . . . . . . . . . . . . . . . . . . . 52 7.2 Future Works . . . . . . . . . . . . . . . . . . . . . . . . . . . 53 Acknowledgement. 57. Publications. 57.
(8) List of Figures 1.1. Scheme of the proposed method for monaural DOA estimation.. 6. 2.1 2.2 2.3 2.4 2.5 2.6 2.7 2.8 2.9. Monaural DOA estimation in 3D space. . . . . . . . . . . . . . Schematic diagram of ITD localization. . . . . . . . . . . . . . Spectrum of observed signal at different azimuth degree. . . . System of sound transmission in different domain. . . . . . . . Examples MMS calculation. . . . . . . . . . . . . . . . . . . . Modulation spectra at a different azimuth direction. . . . . . . HR-MTF under various azimuth degree. . . . . . . . . . . . . Scheme of the previous method for monaural DOA estimation. Stylized example of modulation loss with increasing distance. .. 8 10 12 14 15 16 17 18 22. 3.1 3.2 3.3 3.4 3.5 3.6. Previous 5 order regression model of peak feature. . . . Previous 5 order regression model of tilt feature. . . . . The distribution of peak and tilt of MMS in 3D space. The RMSE of model at different regression model. . . . The improved 8-order regression model of peak. . . . . The improved 8-order regression model of tilt. . . . . .. . . . . . .. 24 25 26 27 28 29. 4.1 4.2 4.3 4.4 4.5 4.6 4.7 4.8 4.9 4.10 4.11. The top view of the ISM method. . . . . . . . . . . . . . . . . One-dimensional plane diagram of the ISM method. . . . . . . h(t) at 1m based on ISM. . . . . . . . . . . . . . . . . . . . . h(t) at 5m based on ISM. . . . . . . . . . . . . . . . . . . . . Original sound source at 0m. . . . . . . . . . . . . . . . . . . . Received sound signal at 1m. . . . . . . . . . . . . . . . . . . . Received sound signal at 5m. . . . . . . . . . . . . . . . . . . . MMS of original AM noise with different sound intensity. . . . MMS of original signal at 0m and observed signal at 5m away. Scheme of proposed monaural distance estimation method . . . Curve of tilt at different distance and the regression curve. . .. 32 33 34 35 36 37 38 40 41 42 43. 5.1. Scheme of the proposed method for joint estimation. . . . . . 44. 3. . . . . . .. . . . . . .. . . . . . ..
(9) 6.1 6.2 6.3. Distribution of test points in a simulated room environment. . 48 Estimation result in Room A. . . . . . . . . . . . . . . . . . . 49 RMSE result of distance and its standard deviation. . . . . . . 50.
(10) List of Tables 2.1. Results of previously proposed DOA method. . . . . . . . . . 19. 3.1. The change of RMSE with the change of order. . . . . . . . . 27. 4.1. The peak and tilt values of MMS in different sound intensities. 39. 6.1 6.2 6.3. Results of the improved monaural DOA method. . . . . . . . . 47 The parameters of the test room A for evaluation. . . . . . . . 48 Results of Joint estimation of monaural DOA and distance. . . 51.
(11) Chapter 1 Introduction 1.1. Research Background. In human daily life, sound is a very important information not only for communication but also in many other usage. Sound is an important cue for human beings to perceive the world and one of the Five wits of human beings. The sound signal that our ears receive carries rich information, such as the speaker’s emotional state, the impact of surrounding environment on speech transmission, the source direction of speech, etc. When vision cues are not available such as in the darkness, the sound become a very significant cue to perceive the surrounding environments. In this process, sound localization plays a very important role. Sound localization is one of the most important senses in human hearing perception including direction of arrival (DOA) and distance between source and ear. For example, people can spot a car from its sound to avoid danger. This process includes human auditory mechanism, signal processing, data analysis and other related knowledge. The sound level difference, time difference, phase difference, timbre difference, Haas effect and De Boer effect when the sound wave from the sound source reaches the two ears all provide the basis for the determination of the sound source orientation [1]. Basically, people with two ears hearing mainly use binaural cues include interaural time differences (ITD) and interaural level differences (ILD) to locate target sound. The distance between the two ears relative to the sound source is different, so the same sound source reaches the two ears at different distances, resulting in a time difference and a difference in intensity. But for some people with only one ear hearing like single ear deaf patient, who can not use such interaural cues for sound localization, how can people with monaural hearing perceive the location of sound source is an interesting and challenging. 1.
(12) topic in the research on auditory mechanism. On the other hand, for the applications in acoustic filed, sound localization is a common used technology in many regions such as speech recognition, noise reduction, target tracking, robot acoustic system and so on. For example, in daily applications, when using the sound source location system in video chat, the speaker’s location can be detected in real time, so the camera can track the moving speaker in real time, which makes the remote online communication more vivid and interesting. In addition, the technology can also be used in the live conference, live TV and robot hearing system. In the industrial field, sound source location technology is also widely used. For example, fault detection in engineering, non-contact measurement and earthquake prediction and analysis in seismology. In such applications, microphone arrays is a common used typical DOA estimation and distance estimation method by using binural cues like Time Difference of Arrival (TDOA). In 1979, Schmidt also proposed Multiple signal classification algorithm (MUSIC), which has became a classical method in sound localization [2]. At present, the widely used microphone array based sound source localization algorithm uses a signal acquisition array composed of multiple microphones. A space domain is added on the basis of time domain and frequency domain to process the received signals from different directions in space. This is the core of microphone array signal processing, which belongs to the research field of array signal processing [3]. There are three kinds of microphone array based sound source localization technology: high resolution spectrum estimation technology, controllable beam-forming technology and time delay estimation technology [4]. However, these methods all require a lot of microphones as the hardware base, which is required to be located at certain intervals in a certain space during the usage. The space and hardware requirements make microphone arrays difficult to use in some environments especially in the cramped space. At the same time, with the development of smart phones and other portable devices, the lightweight of audio processing devices has become the trend. Therefore, how to use single microphone to locate sound source has become an interesting and challenging research topic. Yet study found that people with monaural hearing, which is also know as single-ear hearing can perceive sound location include DOA and distance [5]. Recently, it has been widely acknowledged that human can use the monaural cues for sound localization. If we can apply human ability for monaural sound localization to the engineering problems, a method of estimating DOA and distance of the target sound can be realized as applications of singlemicrophone DOA and distance estimation.. 2.
(13) 1.2. Research Issues. Although the fact that humans can use monaural cues for sound source localization has been widely recognized, how humans perform monaural sound source localization has been always under study. What specific monaural cues are available in monaural sound localization is also a research topic of concern. It has been reported that the possible monaural cues are spectral cues in head-related transfer function (HRTF) but didn’t figure out the specific features [6]. In addition, this research didn’t make a clear explanation of how the spectral in HRTF related with human perception of monaural sound localization. Meanwhile, in 2005, Raykara reported that pinna spectral notches in measured head related impulse responses (HRIR) could be an useful monaural cues for DOA by frequency domain analysis. However, the proposed monaural cue of spectral notches is hard to bu used alone in many practical monaural DOA estimation method. On the other hand, it has also been suggested that modulation cues in modulation frequency domain play an important role in monaural DOA estimation [7]. Based on this funding, some studies have started to apply the monaural modulation spectrum (MMS) in estimating DOA. For example, Kliper et al. reported a mothod for monaural DOA estimation by using support vector machine (SVM) based on machine learning technology. This research proposed the possibility of single-channel sound localization by using MMS [8]. Nevertheless, this method needs huge amount of training data and the specific features in sound signal related to monaural DOA is still unknown. More recently, by applying the concept of modulation transfer function (MTF), Ando et al. proposed a MMS based monaural DOA estimation method [9]. Through the investigation of MMS shape, it was found that the difference of head-related modulation transfer function in different azimuth direction can be reflected in the change of shape of observed MMS. However, this method only stimulated the observed sound signal with a limited HRIR dataset and one kind of amplitude modulation (AM) source signal. In addition, this method can only used in 2D plane, and the front-back confusion has not been solved. Later in 2018, a 3D monaural DOA estimation method using MMS features was proposed by Bui et al. [10]. Based on the MTF and auditory perception of temporal modulation, some features in MMS related with DOA were extracted. By using these features, a 5-order polynomial regression model for monaural DOA estimation was trained. Based on human modulation perception, this method studies the direction related auditory features in modulation frequency domain, and extends the monaural DOA estimation in 3.
(14) 2D plane to 3D space. However, this method has a large root-mean-squareerror (RMSE) of 22.02 degree in monaural DOA estimation and the performance varies greatly in different positions with with a standard deviation of RMSE of 10.69 degree. In addition to the problems already mentioned, these MMS-based researches have a common remaining issues to be studied. That is whether the MMS could be used in monaural sound distance estimation. In sound localization, distance and DOA are both important information for getting the accurate location of sound source. Because MMS has been proved that was high related with sound localization, there is reason to believe in its reliability in both monaural DOA and distance estimation. Therefore, how to estimate monaural distance of sound source is also a interesting and challenging issue whose solution would extend the of MMS based DOA method to a more accurate localization method.. 1.3. Research Objectives. This study aims to propose a Method for estimating monaural DOA and distance using modulation spectrum analysis. Some features in MMS that have been proved be useful in monaural DOA estimation but has a large RMSE in 3D space. Therefore, this study will investigate the possible reasons that caused the large RMSE and propose an improved method for monaural DOA estimation. Moreover, this study will try to assess the possibility of estimating monaural distance by using MMS, which would contribute to the monaural sound localization. To achieve the research goal, there are two steps in this study. First, to make a investigation of the previous 3D MMS based monaural DOA estimation method to find the possible reasons that caused the large RMSE. After that, this study try to improve the method to reduce the large RMSE. Based on the investigation results, it was found that the under-fitting problems in the polynomial regression model is the main reason. In addition, the boundary conditions in the algorithm and the processing method of complex candidate values will also cause large errors. Then in step 2, the features in MMS related to sound source distance will be investigated. After that, to propose a monaural distance estimation method based on MMS feature. There are several novelties in this paper. First, finding out the reasons related to the large RMSE in previou method to reduce the RMSE in monaural DOA estimation. After that, an improved monaural DOA estimation method in 3D space base on MMS analysis can be proposed. Furthermore, investigating the cues related to the distance of sound source between the 4.
(15) source location and human ear in the MMS to extend the method to be a method for monaural DOA and distance estimation. This study is helpful for understanding the ability of monaural sound localization and makes single-microphone sound localization possible. Besides, it can provide the theoretical support for the hearing aid system of patients with single ear deafness and the humanoid robots.. 1.4. Structure of this Thesis. In this thesis, the structure of the content is shown as Fig. 1.1. At great length, chapter 1 describes the background and research issues of monaural DOA and distance estimation. Also, the objectives, originality and significance of this research are presented here. In Chapter 2, there is a literature review of the monaural sound localization. First, the overview of sound localization was addressed in the beginning of this chapter. Then, the review of DOA estimation and distance estimation are elaborated respectively. They both included descriptions of binaural and monaural cues. Finally, the most important object of analysis in this study, MMS, will be described in detail. After that, in chapter 3, the research of DOA in monaural localization is described in detail here. In this part, a investigation of the possible reasons that cause the large RMSE in the previously proposed method was made. As a result, it was found that the under-fitting problem in the polynomial regression model and unreasonable boundary conditions in the estimation algorithm combine to produce the large RMSE in monaural DOA estimation. Then, the unreasonable boundary conditions were removed so that the RMSE of DOA estimation of some points in the edge of 3D space decreases. After that, the polynomial regression order is increased to reduce the RMSE in DOA estimation. In this process, the influence of the polynomial regression order to the RMSE of regression model is investigated. In order to extend this method to be a method for monaural DOA and distance estimation, the change of MMS related features caused by the change of sound source distance is studied in Chapter 4. It is found that different sound source distances have different impulse responses under reverberation environment. Long distance transmission will reduce the modulation of the observed signal and change the shape of MMS. For simulation purposes, image source method (ISM) is carried out to construct virtual sound source environment under reverberation environment. A regression model is performed to describe the relationship between distance and MMS features. Chapter 5 depicts a joint estimation method for both monaural DOA 5.
(16) and distance. through combining the improved DOA estimation method in Chapter 3 and the monaural distance estimation method in Chapter 4 by using modulation spectrum analysis. Then, evaluations of improved monaural DOA estimation method, proposed monaural distance estimation method and Joint estimation method of monaural DOA and distance are described in Chapter 6. Finally chapter 7 make a summary of this paper with respect to the research question, the proposed method and results of this research. In addition, the future works of this study is discussed.. Figure 1.1: Scheme of the proposed method for monaural DOA estimation.. 6.
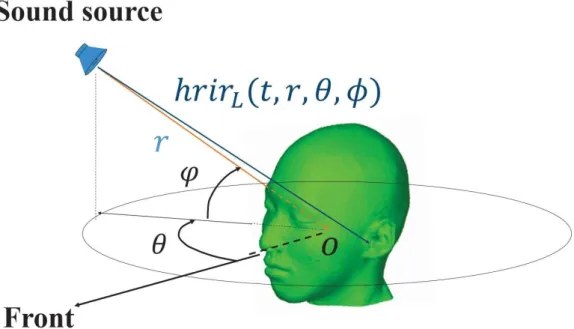
(17) Chapter 2 Literature Review 2.1. Overview of Sound Localization. The research goal of sound source localization technology is to study the DOA and distance of the speech signal received by the system relative to the receiving sensor. [11]. At present, the research of sound source localization is mainly divided into two categories: the algorithm of sound source localization based on the mechanism of human hearing process and the sound source localization algorithm using microphone arrays [26]. In the process of human hearing, there are binaural cues and monaural cues in the source location. The method of microphone array source location is based on binaural cues. HRTF describes the transmission process of sound waves from sound source to ear. Monaural cues are mainly based on the spectral features of HRTF. These cues can be used for DOA and distance estimation. In this chapter, cues and methods of DOA and distance estimation will be elaborated respectively.. 2.2. Head-related Transfer Function. Head-Related Transfer Function (HRTF) describes the transmission process of sound signal from original location to human ear. It is the result of comprehensive filtering of sound waves by human physiological structures (such as the head, auricle, and pinna). The sound will be reflected by our body structure and the spectrum will change according to different direction of sound. This process could be considered as a system. The transfer function of this system is HRTF. The form of HRTF in time domain is called head-related impulse response (HRIR). Suppose that there is a original sound source x(t) at a certain location 7.
(18) (θ, φ, r), which reaches the human ear through spatial transmission. The θ, φ and r are the azimuth degree, elevation degree and distance of target sound source in these variables, which describe the DOA and distance of the approaching sound, as shown in Fig. 2.1. HRIR is a function is a complex function which consists of four variables: time, azimuth degree, elevation degree and distance of the sound source. The HRIR (HRTF) is its form in the frequency domain) contains information of the sound source location, it is very important for the study of human hearing.. Figure 2.1: Monaural DOA estimation in 3D space.. 8.
(19) 2.3 2.3.1. DOA Estimation Method Binaural Cues in DOA Estimation. Due to the different sound states at the two ears, the sense of direction and depth of hearing is caused, which is often called “binaural effect”. Different sound sources in different directions will produce different (but specific) sound states at the two ears, so that people can judge the direction and distance of the sound source. In the process of binaural sound source localization, the sound waves emitted from the sound source are transmitted to the two ears. First, the input information of the cochlea nerves on both sides is generated through the perception of the cochlea on both sides. Then, the central nervous system is used for analysis and synthesis, and the direction of the sound source can be identified by the cooperative work of the auditory areas of the two sides of the brain. It is very important to sense the difference between the two ears caused by the sound from the same sound source. Only when the difference between the two ears is different, can our brain determine the sound source location according to these differences. Generally speaking, the sound source localization in the horizontal plane is much more accurate than that in the vertical plane. There are interaural time difference (ITD) and interaural intensity difference (ILD) in the signals collected by the two ears when they reach the human ears, which become an important objective basis for human auditory system to judge the DOA of source in azimuth plane and elevation plane [13]. These binaural cues are elaborated in detail in the following paragraphs.. 9.
(20) Figure 2.2: Schematic diagram of ITD localization. ITD Cues About 100 years ago, Earl John Strutt proposed a so-called dual theory of hearing. And give the relevant explanation of two binaural cues ITD and ILD [14]. Generally speaking, the human ear is very sensitive to the difference of arrival time of sound. A simple explanation of ITD can be illustrated in Figure. 2.2 Points C and D in the figure are the left and right ears. The azimuth degree between the sound source and human head is θ. Assuming that the sound source signal is located on the right front of the listener’s head, the straight lines reaching the two ears are L1 and L2, and the head radius is r. The speed of sound c is approximately equal to 340 m/s when the temperature in the air is 15 centigrade. ITD can be calculated by the following equation. r ITD = (θ + sinθ), c 10. (2.1).
(21) For the average human head, r is 21 cm. When the source is completely tilted to one side (θ = 90◦ ), the difference in time between the source waves reaching the ears can be as much as 0.6 milliseconds [15]. The diagram also applies to the elevation direction. ITD cues in binaural hearing can also reflected in HRTF by spectrum analysis. ILD Cues The high sensitivity of human ear to sound energy is almost unimaginable. For example, under the condition of audible sound level (sound level is 0dB, sound intensity is about 10− 16w/m2 ), the vibration amplitude of tympanic membrane is only 1− 10 meters, and the vibration amplitude of cochlear base is only 1− 12 meters, which is only 1/100 of the diameter of hydrogen atom. This amazing characteristic makes the sound level difference localization play a very important role in auditory localization ILD localization is caused by the same sound source receiving sounds of different sound levels in both ears. For instance, when the sound source deviates to the left, the sound wave can directly reach the left ear, while the right ear is shielded by the head. As a consequence, the sound level heard by the left ear will be greater than that of the right ear. The more the sound source is, the greater the sound level difference, and the maximum sound level difference can reach about 25 dB [16]. In many cases, it has been proved by experiments that only considering the sound level difference can obtain the azimuth information. For example, the current two channel stereo system is a sound level difference system. But the experiment also shows that the ability to locate the low frequency sound signal (below 300 Hz) will be weakened when the sound level difference is used [17]. Because when the wave length is larger than the obstacle, there is no amplitude change when the sound wave passes through the obstacle. Therefore, the object of ILD localization is mainly high frequency sound. It is worth pointing out that the localization mechanism in very short distance is different from that in long distance. Low frequency sound and high frequency sound are mainly located by ILD.. 2.3.2. Monaural Cues in DOA Estimation. Recently, it has been acknowledged that human being can use monaural cues for to locate sound using single ear. The most striking cues in monaural sound sources localization are the spectral features caused by HRTF in different directions. The spectrum of observed signal at human single ear drum Y (f, θ, φ, r) could be caulated as: 11.
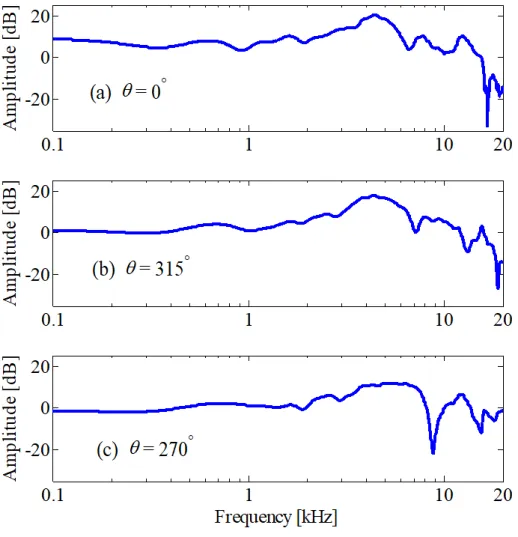
(22) Y (f, θ, φ, r) = X(f )H(f, θ, φ, r),. (2.2). where X(f ) is the spectrum of the source signal, f is the frequency. HRTF is different at different locations, which will cause different spectrum of observed signal. The change of spectrum is more obvious in modulation frequency domain by applying the concept of MTF, which will be elaborated in detail in Chapter 2.5. Figure. 2.3 shows the observed monaural spectrum (left ear) at different source azimuth degree.. Figure 2.3: Spectrum of observed signal at different azimuth degree.. 12.
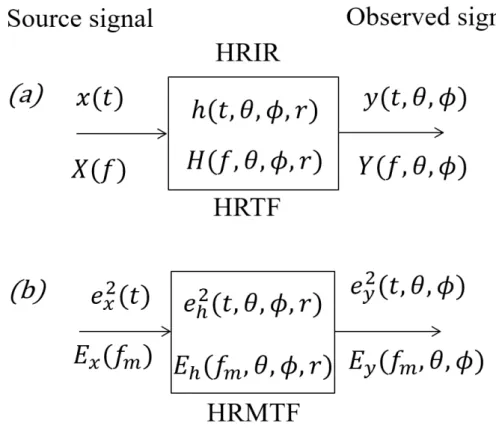
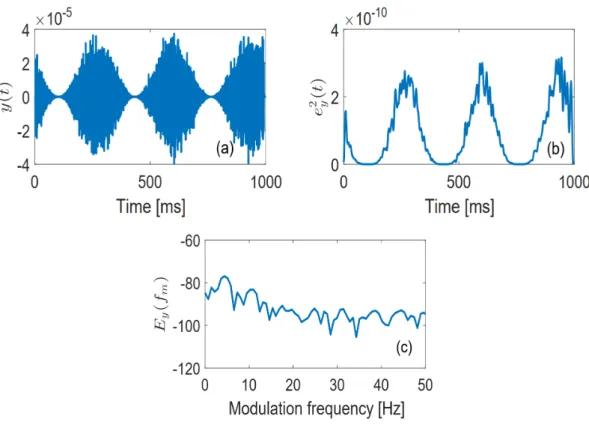
(23) 2.4 2.4.1. Monaural Modulation Spectrum Concept of MTF. The concept of MTF was proposed by Steeneken and Houtgast to explain the relationship between the depth of modulation of the power envelopes of input and output signals. In addition, it can describe characteristics of the enclosure and provide a method to predict the speech transfer index (STI), which is a very important metrics that can be used to assess the quality of speech transmission in room acoustics [18]. In short, MTF is a form that extends the transfer function from the general frequency domain to the modulated frequency domain. The ordinary transfer function describes the relationship between the input and output spectrum. When the spectrum is extended to the spectrum of the envelope in the modulation domain, MTF can better describe the transmission process of sound in a certain space.. 2.4.2. Monaural Modulation Spectrum (MMS). It is reported that human can use modulation cues in sound localization, and the temporal amplitude envelope is processed by a modulation filterbank in human hearing process [4]. Therefore, the AM domain is a very significant dimension in hearing. Also, researches by Greenburg, Atlas and Hermansky have found that the modulation spectrum conveys linguistic information on speech. To calculate the MMS of observed signal, let x(t), h(t, θ, φ, r), and y(t, θ, φ, r) correspond to the sound source signal, HRIR, and observed signal respectively. The θ, φ and r are the azimuth degree, elevation degree and distance in these variables, which describe the location of the approaching sound, as shown in Fig. 2.1. The convolution of the source signal x(t) and h(t, θ, φ, r) could be taken to stimulate the observed signal at ear drum, which is y(t, θ, φ, r). By applying the concept of MTF, the temporal power envelope of the observed signal e2y (t, θ, φ, r), can be calculated as: e2y (t, θ, φ, r) = e2h (t, θ, φ, r) ∗ e2x (t),. (2.3). where e2x (t) and e2h (t, θ, φ, r) are the power envelopes of x(t) and h(t, θ, φ, r). Eq. (2.3) can be described in the modulation-frequency domain as: Ey (fm , θ, φ, r) = Eh (fm , θ, φ, r)Ex (fm ),. (2.4). where Ex (fm ), Ey (fm , θ, φ, r) and fm are the MMS of x(t), the MMS of y(t, θ, φ, r) and the modulation frequency respectively. Eh (fm , θ, φ, r) is the 13.
(24) form of HRTF in modulation frequency domain called, Head-Related modulation transfer function (HR-MTF). The MMS and HR-MTF can be obtained by using fast Fourier transform (FFT) on the power envelope. The power envelope e2y (t, θ, φ, r) can be extracted by: h i e2y (t, θ, φ, r) = LPF |y(t, θ, φ, r) + jHilbert[y(t, θ, φ, r)]|2 ,. (2.5). where Hilbert[·] is the Hilbert transform and LPF[·] is low-pass filtering. Finally, e2y (t, θ, φ) is transformed to Ey (fm , θ, φ) using FFT. It can be seen from the above calculation, MMS is the spectrum over the modulation domain. Based on the concept of MTF, linear systems in time domain and frequency domain can be extended to modulation domain and modulation frequency domain. Figure. 2.4 shows the system of sound transmission form the original location to listener’s ear drum on time domain and modulation domain respectively. There is an example of MMS calculation that shown in Fig. 2.5.. Figure 2.4: System of sound transmission in different domain.. 14.
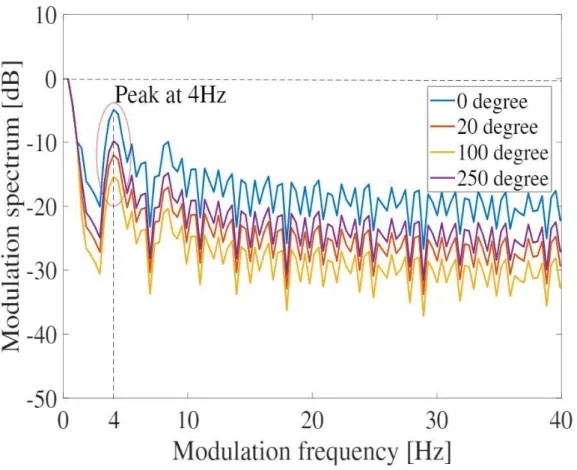
(25) Figure 2.5: Examples MMS calculation.. 2.5. Previous Monaural DOA Method. In our previous method, the basic idea of DOA estimation is MMS analysis. In sound transmission process, the sound wave must pass through the pinna before it reaches the human ear drum. This process can be regarded as a linear system with the transfer function HRTF, which has a time domain from head-related impulse response (HRIR). At different directions, HRIR is different. It causes the different spectrum of the observed signal. By applying the concept of MTF, such change could be reflected by some features of MMS.. 2.5.1. Related Features in MMS. There are two features in MMS was extracted and analysed for monaural DOA estimation. The first feature related with DOA is the peak of MMS around 4 Hz in the modulation frequency domain. It is reported that Humans are most sensitive to the information carried by the 4 Hz modulation 15.
(26) frequency [19]. This trend is also found in our previous experiments. Here, we extract MMS from an observed signal that is the convolution between random AM noise and HRTF from different azimuth angles. Figure. 2.6 shows that the entire modulation spectrum of the source signal is altered after reaching to the eardrum position (observed signal). It is obvious to see the dominant peak change at the modulation frequency of 4 Hz is different at different direction.. Figure 2.6: Modulation spectra at a different azimuth direction.. 16.
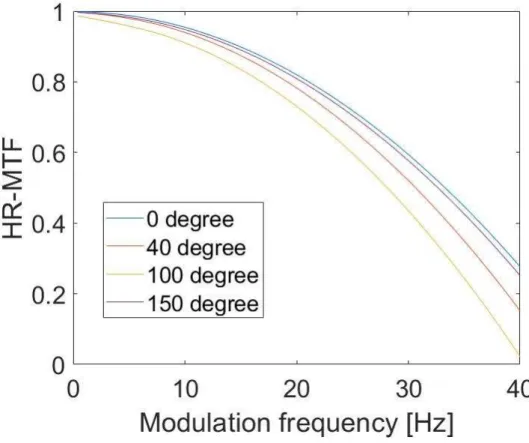
(27) Figure 2.7: HR-MTF under various azimuth degree. Another related features in MMS is the spectral tilt of the MMS from 10 to 40 Hz. After reaching the highest peak at 4 Hz, the MMS decreases as the modulation frequency increases. The rate of reduction is different at different degree. This is because HR-MTF of different direction have different rates of change in the modulation frequency domain. Figure 3 shows HR-MTF in the modulation frequency domain at different azimuth degree. Regression analysis from 10 to 40 Hz was applied to measure the spectral tilt of the MMS in this frequency range.. 17.
(28) 2.5.2. Estimation Strategy. The estimation strategy with the previously proposed method can be divided into two stages. The first stage is the model training stage. The HRTF database and the sound source signal are used to simulate the signal from the sound source in different directions. Then we use the Hilbert transform and Fourier transform to get the MMS of the signal. The auto-correlation function (ACF) was used to obtain the dominant modulation frequency fdm of 4 Hz to obtain the peak feature. In addition, we take regression analysis from 10 to 40 Hz to measure the slope feature. After that, the peak feature Py (θ, φ) and slope feature Sy (θ, φ) with known DOA of MMS can be calculated. Then, a 5-order polynomial regression is used to model the peak and slope features into Gp (θ, φ) functions for the former and Gs (θ, φ) functions for the latter. After the regression model was trained, MMS features extracted from the observed signal can be put into the obtained regression model. After that, in ˆ φ) ˆ from of the observed signal the estimation stage, the estimated DOA (θ, is calculated by: q ˆ φ) ˆ = arg min ( (Gp (θ, φ) − Py )2 + (Gs (θ, φ) − Sy )2 ), (θ, (2.6) ∆θ≥0,∆φ≥0. where Py and Sy are the peak and slope feature of observed signal. The proposed method of estimating monaural DOA is shown in Fig. 2.8.. Figure 2.8: Scheme of the previous method for monaural DOA estimation.. 18.
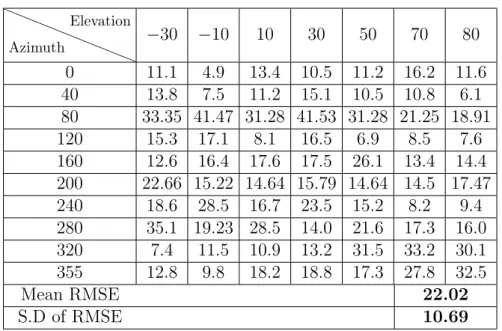
(29) 2.5.3. Problems in the Proposed Method. In the previously proposed method, a 5-order polynomial regression model for MMS features (peak and tile) was obtained in the model training stage. In the estimation stage, RMSE was used to evaluate the method. The calculation will be explained in Section 4. Table 2.1 lists the RMSE results of the previous method in 3D space. In which, the azimuth range was from 0 to 355 degree with 5 degree increment, while the elevation range was from -30 to 80 degree with 10 degree increment. There is a high overall RMSE of 22.02 degree in 3D monaural DOA estimation. Some test locations have very large RMSE, especially near the Azimuth angle of 280 degree. In the RMSE varies greatly at different locations in 3D space with a standard deviation of 10.69. Table 2.1: Results of previously proposed DOA method. ❛❛ ❛. Elevation ❛❛ −30 ❛❛ Azimuth ❛❛. 0 40 80 120 160 200 240 280 320 355 Mean RMSE S.D of RMSE. 2.6. 11.1 13.8 33.35 15.3 12.6 22.66 18.6 35.1 7.4 12.8. −10. 10. 30. 50. 4.9 7.5 41.47 17.1 16.4 15.22 28.5 19.23 11.5 9.8. 13.4 11.2 31.28 8.1 17.6 14.64 16.7 28.5 10.9 18.2. 10.5 15.1 41.53 16.5 17.5 15.79 23.5 14.0 13.2 18.8. 11.2 10.5 31.28 6.9 26.1 14.64 15.2 21.6 31.5 17.3. 70. 80. 16.2 11.6 10.8 6.1 21.25 18.91 8.5 7.6 13.4 14.4 14.5 17.47 8.2 9.4 17.3 16.0 33.2 30.1 27.8 32.5 22.02 10.69. Sound Distance Estimation. Historically, the analysis of auditory spatial perception mainly focused on DOA perception, while the perception of distance was basically ignored [20]. Comparatively speaking, because the change of the sound source distance is not as obvious as the change of the direction of the original sound source, the location of the sound source distance is not as accurate as the direction of the location. However, the estimation of distance is also very important. For example, blind people can determine the distance of obstacles by reflecting 19.
(30) sound location (the reflection of obstacles on sound can also be regarded as secondary sound source). Therefore, the research of sound source distance location has important scientific significance and research value. Generally speaking, the cues of sound source distance estimation mainly include the following aspects. First, binaural cues include ITD and ILD. Second, some cues that can be used for both monaural and binaural hearing, mainly including sound intensity, spectral cues and Amplitude modulation(AM) cues. These will be described separately below.. 2.6.1. Binaural Cues. Binaural factors usually refer to ITD and ILD. In the case of free field, the reflection and shadow effect of the head or trunk of the listener in the near field is more obvious, which makes the binaural factors (especially ILD) in the near field change significantly with the distance of the sound source [21]. It is considered that the change of ILD in the near field can affect the distance localization of the near field sound source more than the change of ITD in the near field. For the ITD cue, when the value of ITD is less than 400µs, its perception threshold is 15µs. When the ITD is greater than 400µs, its perception threshold will increase with the increase of the basic value. When the sound source is on the right side, the ITD will usually reach the maximum value and will be greater than 400µs. At this time, the ITD has a larger perception threshold. As the distance increases, people will not notice the change in ITD, and will feel that ITD is basically unchanged [22]. On the other hand, research found that ILD provides a distance estimation cue for distances of approximately 1 m. Beyond this range, it is basically independent of the source distance. Fry and Hartley (1921) reported that the binaural intensity differences for a sound source (1860 Hz sinusoid) on the binaural axis may differ by 20 dB in the distance between 87.5 cm and 17.5 cm (these values are derived theoretically assuming a spherical head) [23]. Because there is no interaural difference in the midline, this cue is only applies to sound sources displaced from the medial plane.. 2.6.2. Sound Intensity. Sound intensity is the most natural auditory cue for distance estimation. At the same time, it is also the most obvious and important distance estimation cue available in monaural hearing [24]. Its principle is that the lower the intensity of the sound reaching the listener, the farther the sound source is.. 20.
(31) Intensity I at a given location in space is a function of sound source distance r as: w , (2.7) 4πr2 where w is the power of the sound source. This is commonly referred to as the inverse-square law. Based on equation 1, the sound intensity level i radiated by the sound source decreases at the rate of 6 dB for every doubling of the distance from the sound source to the observer (listener) according to the formula: I=. r2 , (2.8) r1 where r1 and r2 are the two different source distances, respectively. The smallest change in sound intensity can be thought of as a kind of threshold, which is called just noticeable difference (JND) or difference limit (DL). In an open natural sound environment, the ability of the listener to perceive the change of distance only based on intensity is about 0.5-3.0 dB, with an average of 6% of the reference distance [25]. The different intensity of sound source has a certain influence on judging the distance of sound source. Whispering (usually producing a sound pressure level of about 30 decibels at 1 m) is expected by the listener to come from a nearby sound source, while normal (conversational) speech (65 decibels at 1 m) is usually estimated more accurately. A calling out sound (90-dB SPL at 1 m) is expected to come from much far away [5]. ∆I = 20log. 2.6.3. Spectral Cues. In some cases, the sound source spectrum varies with distance as a function [26], the sound absorbing properties of air significantly modify the sound source spectrum because of the attenuation of high-frequency components in spectrum. In the transmission of sound, air acts as a low-pass filter. Some related researches found that sounds lacking high-frequency energy are perceived as being emitted from more distant sources than sounds rich in high-frequency content [27]. In contrast, the increase in distance for faraway sound sources emphasizes the low-frequency content of the sound. A. D. Little et al. have also found that acoustic effects contribute to a spectral distance cue for monaural distance estimation about 10m [28]. There is an inverse relationship between relative low-frequency energy in spectrum and source distance. In addition, the spectral cues in distance estimation can be reflected in the modulation frequency domain. With the change of 21.
(32) sound source distance under certain environment, the shape of MMS will also change. The detail will be discussed in Chapter 4.. 2.6.4. Amplitude Modulation (AM) Cues. The meaning of modulation in sound signal especially speech signal is similar to that of amplitude modulation (AM) in speech processing of communication systems [29]. The sound signal can also be approximately viewed as an AM system: a very low frequency inaudible message bearing signal are used to modulate the amplitudes of the audible sound signal [30]. Since sound is a wide band signal, it is more appropriate to analyze the amplitude modulation for individual frequency bands. In each frequency band, the signal can be considered as narrow band and its power envelop can be considered as the modulating signal of the band [31]. Based on the AM theory, it was reported that modulation depth of the signal at the observer’s location is high related with the distance of sound source [33]. This cue is caused by the change of the modulation transfer characteristics under a certain environment as a function of source distance, and the effect is limited to monaural listening situations. The loss of AM depth with distance change is described as Fig. 2.9. The AM cues can be reflected in MMS by applying MTF concept. Next, the concept of MTF and the related calculation of MMS will be elaborated.. Figure 2.9: Stylized example of modulation loss with increasing distance.. 22.
(33) Chapter 3 Method of Monaural DOA Estimation using MMS 3.1. The Causes of Problems in Previous Method. The previous 5 order polynomial regression model of peak and tile feature are shown as Fig. 3.1 and Fig. 3.2. It can be seen that the black dot representing the true value of the feature does not fit well with the regression surface of the PEAK feature in 3D space. Especially when the azimuth is around 80 and 280 degrees, the true value of the feature deviates greatly from the regression model. Therefore, there is underfitting problem in the 5-order polynomial regression model in 3D space.. 3.2 3.2.1. Improved Method Adequate Polynomial Regression Model. To solve the under-fitting problems, we increased the order of the polynomial regression model based on least squares method. Here, take the peak feature as an example, the regression function Py (θ, φ), Sy (θ, φ) of peak and slope respectively can be described as: Gp (θ, φ) =. F X F −i X. aij θi φj ,. (3.1). i=0 j=0. Gs (θ, φ) =. F X F −i X i=0 j=0. 23. bij θi φj ,. (3.2).
(34) where aij and bij are the regression coefficients, and F is the order of multiple regression. According to the least square method, the regression coefficients are calculated as: aˆij = arg min(Gp (θ, φ) − Py )2 , bˆij = arg min(Gs (θ, φ) − Sy )2 ,. (3.3) (3.4). where Py and Sy are the observed peak feature and slope feature. aˆij and bˆij are estimated regression coefficients. After we get the coefficient of function of the Py (θ, φ) and Sy (θ, φ) functions.. Figure 3.1: Previous 5 order regression model of peak feature.. 24.
(35) Figure 3.2: Previous 5 order regression model of tilt feature. After the regression coefficients was obtained, several candidates of estimated DOA can be calculated by Eq. (2.6). Then, through the head movement process, the final solution of DOA can be obtained. Information of head movement was added to determine the final solution of DOA. Figures 3.3 shows that the MMS values changing in 3D space, which can be regarded as the movement of the head. The peak value would likely decrease in the azimuth range from 0 to 90 degrees and from 290 to 355 degrees. However, it would decrease with the azimuth from 90 to 290 degrees. Moreover, when the head is turned up (elevation increasing), the tilt value decreases in the elevation range from −30 to 15 degrees but increases from 15 degrees to 80 ˆ φ) ˆ to degrees. The we give an increment of degrees to estimated DOA (θ, ˆ ˆ make it become (θ+∆θ, φ+∆φ). This resulted in an increase or decrease of MMS features, which can be used in the selection of final solution.. 25.
(36) Figure 3.3: The distribution of peak and tilt of MMS in 3D space.. 3.2.2. Optimal Order for the Estimation Model. Although the higher the regression order, the more accurate the description of model in 3D space will be, too high order increases the complexity and the amount of calculation. In addition, when the regression order is too high, coefficient of the high-order term is extremely close to zero, which has slightly effect on the model. Therefore, it is necessary to trade-off between the accuracy and order. In this case, to determine the optimal regression order, the effect of regression order on the model is investigated here. By observing the RMSE of the model with the increase of the regression order, the effect of the regression order on the accuracy of the regression model was studied. Since the independent variables of polynomial regression are two angles in 3D space, the initial value of the order is set as 3, and the RMSE of the regression model of this order is observed by increasing one order successively. The change of RMSE of Py (θ, φ) as the order of multiple regression F increases is showed in Tab. 3.1 and Fig. 3.4. It shows that, when F < 8, the change rate of RMSE is larger. After that, the RMSE has very little change with the increase of order. Therefore, we choose the F = 8 as the optimal regression order. The 8-order regression models of peak and tile are shown as Fig. 3.5 and Fig. 3.6. Obviously, compared with the previous five order regression model, the improved regression surface has a higher fitting degree with the real value of the feature.. 26.
(37) Table 3.1: The change of RMSE with the change of order. Order of model (F) RMSE of the model. 3 1.59. 4 0.99. 5 0.78. 6 0.61. 7 0.50. 8 0.37. 9 0.35. 10 0.34. Figure 3.4: The RMSE of model at different regression model.. 27. 11 0.32. 12 0.30.
(38) Figure 3.5: The improved 8-order regression model of peak.. 28.
(39) Figure 3.6: The improved 8-order regression model of tilt.. 29.
(40) Chapter 4 Proposed Method for Monaural Distance Estimation Perceiving accurately the location of a sound source is an essential capability of the human auditory system. In addition to the perceived DOA of sound source, human hearing is sensitive to the sound distance [32]. For monaural distance estimation, sound intensity can only be used as a clue for relative distance estimation. But under reverberation environment ,the change of monaural distance can be reflected in the observed AM, which could be used as absolute distance estimation. In addition, the acoustic MTF represents loss of modulation depth as a function of modulation frequency as the distance increases [34]. Therefore, by applying MTF in AM domain, the change in modulation spectrum could be investigated with the change of distance. It could be useful in distance estimation.. 4.1. Influence of Reverberation with Different Receiving Distances. It is reported that long distance transmission will decrease the modulation depth of the AM signal [35]. Different distances will cause different loss in AM depth. Sounds arriving at a long distance are harder to hear than at a short distance. The received signal will be affected by reverberation to different degrees based on the distance of sound source. Therefore, it is possible to investigate the relationship between the modulation spectrum of the signal arriving at the observer at different distances and distance.. 30.
(41) 4.2 4.2.1. Construction of Virtual Sound Source Environment Image Source Method (ISM). In order to study the influence of sound transmission distance on the observed signal in reverberation environment, image source method (ISM) is carried out to construct virtual sound source environment under reverberation environment. The IMAGE source method proposed by Allen and Berkley in 1979 is one of the most commonly used methods for building room reverberation models [36]. Based on this method, the room impulse response (RIR) is constructed in MATLAB, and the signal reflection coefficient, room size and microphone location can be controlled to create A realistic indoor acoustic environment. Figure 4.1 is a top view of the ISM method. As can be seen from Fig. 4.1, in a closed space, when the sound waves emitted by the sound source S spread in the air from the original location, part of the sound waves are directly received by the receiving point D, while the other part is reflected by the wall or obstacle, and then received by D after a certain delay. Since the reflection Angle is equal to the incident Angle, there must be an intersection point Si between the backward extension line of the reflected wave and the vertical line from the sound source to the wall, and the reflected sound wave can be considered to be emitted from another sound source behind the wall. Therefore, Si is called the image source of the original sound source, and the distance between the image source Si and the original sound source S to the wall is equal. When the location and energy (or sound intensity) of all image sources are known, the energy of the sound source to the receiving point can be equivalent to the sum of the energy of the corresponding mirror source.. 31.
(42) Figure 4.1: The top view of the ISM method.. 32.
(43) 4.2.2. Room Impulse Response (RIR) at Different Distances. Based on ISM method, the impulse responses of different sound source distances in reverberation environment can be calculated. Figure 4.2 shows the one-dimensional plane diagram of the ISM method.. Figure 4.2: One-dimensional plane diagram of the ISM method. In the description of Fig. 4.2, xr is the distance between the wall and coordinate origin, which represent the length of room. S is the location of the original sound source with coordinates (xs , ys , zs ) in 3D space, and Si is the image sound source with coordinates (xi , yi , zi ) in 3D space. Similarly, coordinates of receiving end D and wall of room can be represented as (xm , ym , zm ) and (xr , yr , zr ). Coordinates of Si can be calculated as: 1 − (−1)i ]xr − xm , 2 1 − (−1)j ]yr − ym , yj = (−1)j ys + [j + 2 1 − (−1)k zk = (−1)k zs + [k + ]zr − zm , 2 xi = (−1)i xs + [i +. (4.1) (4.2) (4.3). where i, j and k are the number of image source in x, y and z direction in 3D space. In this case, the distance between Si and coordinate origin d can be calculated as: q d = x2i + yj2 + zk2 , (4.4). After the distance between image source and coordinate origin was obtained, the impulse respond at this distance can be calculated as: 33.
(44) h(t) =. n n n X X X. |i|+|j|+|k| δ(t. βijk. i=−n j=−n k=−n. − d/c) , 4πd. (4.5). where n is the reflection order, c is the speed of sound wave, β is the reflection coefficient. It can be seen from the Equ. 4.5, h(t) is related to the reverberation coefficient and the location of sound source, and the sound source received at different distances will be affected by the reverberation differently. Figure. and Figure. show h(t) at near distance (1m) and far distance (5m). The horizontal axis is the sampling points, and the vertical axis represents the impulse response. It can be clearly seen that the reverberation effect on h(t) is greater when the distance is longer.. Figure 4.3: h(t) at 1m based on ISM.. 34.
(45) Figure 4.4: h(t) at 5m based on ISM. Then, the original AM signal with 100% modulation depth is convoluted with h(t) at different distances, and the time domain signals received at different distances are obtained. The original signal and the received signal at 1m and 5m are shown in the figure respectively.. 35.
(46) Figure 4.5: Original sound source at 0m.. 36.
(47) Figure 4.6: Received sound signal at 1m.. 37.
(48) Figure 4.7: Received sound signal at 5m.. 4.3. Investigation of MMS Features in Distance Estimation. Although there is an inverse square relationship between the sound intensity and the sound source distance, because the initial sound intensity of the sound source at 0m is different, when people use the sound intensity as the clue of distance estimation, they can only estimate the relative distance, that is, judge the relative distance of the sound source, but can not estimate the absolute distance of the sound source as if the initial sound intensity is unknown. In the reverberation environment, different distances have different effects on the modulation of the received signal, which will be reflected in some features of MMS. But whether these features can estimate the monaural absolute distance is unknown. Here, the role of peak and tilt of MMS in monaural distance estimation are investigated. The main focus of this investigation is whether the two features can be used for absolute monaural distance estimation. The investigation method is based on the ISM method mentioned above 38.
(49) and the feature extraction method mentioned in Chapter 2.5.1 to extract MMS features of received signals at different distances. By changing the sound intensity and observing the changes of the two features, which feature to use for monaural absolute distance estimation can be decided. Figure. 4.8 shows MMS of 100% AM depth with different intensity. It is obvious that the whole MMS shifts with the change of sound intensity. Figure. 4.9 shows the effect of distance variation on the observed MMS. Obviously, the tilt of MMS is different, that is to say, tilt will change with distance. In addition, from Tab. 4.1, it can be seen that when distance is fixed, tilt does not change with sound intensity at the initial position (0m), while peak does. Therefore, MMS tilt is used for monaural distance estimation.. Table 4.1: The peak and tilt values of MMS in different sound intensities. Intensity Peak Tilt. 74dB SPL 39.8 -0.0252. 61dB SPL 29.75 -0.0252. 55dB SPL 23.58 -0.0252. 39. 49dB SPL 21.99 -0.0252. 43dB SPL 18.08 -0.0252.
(50) Figure 4.8: MMS of original AM noise with different sound intensity.. 40.
(51) Figure 4.9: MMS of original signal at 0m and observed signal at 5m away.. 41.
(52) 4.4. Proposed Estimation Method. The method of monaural distance estimation using MMS analysis is similar to the monaural DOA estimation method proposed in this paper. In the training phase, the MMS features are extracted for regression analysis to get the regression model, and then the trained model is used to estimate the observed signal. The proposed method of estimating monaural DOA is shown in Fig. 4.10. Here, Gs (r) is the regression model in training stage, and rˆ is the estimated distance.. Figure 4.10: Scheme of proposed monaural distance estimation method . In chapter 4.3, the investigation results show that MMS tilt can be used in monaural absolute distance estimation. Since only distance and tilt are involved in distance estimation, the 3-order regression model is used to describe the relation between MMS tile and distance. The influence of DOA has not been considered in distance estimation. This is because the MMS features change more significantly with distance. When the distance increases by 1 meter, tilt decreases by 0.01 dB. However, the maximum range of tilt changes with the DOA in the whole 3D space is less than 0.001 dB. Therefore, the influence of DOA can be ignored in distance estimation and a low-order model can be used. The change curve of tilt at different distance and its regression curve are shown as Fig. 4.11. Assuming ci is the regression coefficient. The regression equation for monaural distance estimation can be calculated as: Gs (r) =. 3 X i=0. 42. ci r i ,. (4.6).
(53) Figure 4.11: Curve of tilt at different distance and the regression curve.. 43.
(54) Chapter 5 Joint Estimation of Monaural DOA and Distance In the process of sound localization, to catch the specific location of the sound source, both DOA estimation and distance estimation are needed. After the estimation of DOA and distance respectively, in order to propose a method to locate sound source monaurally in 3D space, this chapter will try to combine the DOA estimation model and the distance estimation model to conduct the joint estimation of monaural DOA and distance. Suppose there is a time domain signal y(t, θ, φ, r) come from a position (t, θ, φ, r) in 3D space. Firstly, the MMS of the signal y(t, θ, φ, r) is calculated, and then the peak and tilt features are extracted. After that, the tilt feature is input into the training distance estimation model for distance estimation. At the same time, the extracted peak and tilt features are input into the DOA regression model, and the final DOA results are screened by using the head movement process. Finally, the spatial position of the input signal can be obtained. The schematic diagram of the whole system is shown in Fig. 5.1.. Figure 5.1: Scheme of the proposed method for joint estimation. In the process of Joint estimation of DOA and distance using MMS, the 44.
(55) interaction between DOA and distance has not yet been considered. Therefore, the joint estimation method is a combination of the two estimation models. There are mainly the following reasons. First, as mentioned in Chapter 4.4, MMS features tend to change more significantly with distance than with DOA. Therefore, the influence of DOA can be ignored when conducting distance estimation. In addition, the complexity of DOA estimation is much greater than the distance. The 12x72 HRIR database is used in DOA model training, which contains 864 positions in 3D space. Therefore, it is suitable to use high-order model. However, when using high-order model for distance estimation, it is easy to produce over fitting problem. In the future, the training data will be increased by improving the resolution of the distance estimation model to obtain a more accurate model, and then the DOA and distance estimation models will be integrated into the same polynomial model which contains two angles of DOA and sound source distance in 3D space.. 45.
(56) Chapter 6 Evaluation 6.1. Evaluation of Improved Monaural DOA Estimation Method. To evaluate the improved method, we use the database of HRTF from the Research Institute of Electrical Communication head-related transfer functions (RIEC HRTF) database recorded by Tohoku University for model training, which has been used in our previously proposed method. The database included 104 subjects (208 ears) at 864 locations. Amplitude modulated (AM) noise was used in our simulations as the source signal x(t) in the test. The AM noise contained a white noise carrier and several modulating signals with a modulation frequency of 4 Hz and a range from 10 to 40 Hz. The length of the signal was also 1, 000 ms. In total, we used 51, 840 artificial signals (= 10 × 6 left ear HRIRs ×864 possible locations in 3D space). RMSE is also used to evaluate our improved method, which is calculated by: r 1 X ˆ ˆ φ) ˆ = RMSE(θ, ((θ − θ)2 + (φˆ − φ)2 ), (6.1) N where N is the number of simulations in each position. Table. 6.1 lists the results of the improved method in 3D space.. 46.
(57) Table 6.1: Results of the improved monaural DOA method. ❛❛ ❛. Elevation ❛❛ −30 −10 ❛❛ Azimuth ❛❛. 0 40 80 120 160 200 240 280 320 355 Mean RMSE S.D of RMSE. 6.1.1. 3.70 3.89 9.04 6.65 6.06 6.28 7.08 5.27 6.21 5.89. 5.98 6.57 4.86 7.53 4.81 2.43 1.72 4.28 3.97 8.34. 10. 30. 50. 3.26 6.51 3.58 5.15 5.62 2.15 5.78 3.22 2.02 3.67. 4.24 8.57 6.91 5.59 5.54 4.99 7.25 4.61 2.63 4.53. 6.05 3.99 6.96 3.54 7.36 5.25 6.98 4.49 2.64 5.86. 70. 80. 4.53 8.06 7.67 7.53 9.58 6.36 4.12 6.32 3.85 6.80 6.90 8.07 6.96 9.12 7.06 9.11 2.83 4.50 3.52 9.06 5.59 1.95. Discussion. The results show that the overall mean RMSE of each location in the tested 3D space is 5.59. The maximum RMSE was 9.06 at (355, 80) and the minimum RMSE was 1.72 at (240, −10). Although the RMSE at the edge of the tested 3D space seems to be slightly larger than that at other locations, there are no obvious regions that have noticeably better or worse DOA estimates, the overall estimation accuracy of all locations in the 3D space is balanced with the standard deviation of RMSE of 1.95. Compared with the overall mean RMSE of 22.02 obtained by our previous method, the RMSE of estimation decreased by 74.6%.. 6.2. Evaluation of Proposed Distance Estimation Method. In order to evaluate the distance estimation model, we select the room model of a small office called Room A. The parameters of Room A are shown in the Tab. 6.2. This room model is used to generate impulse responses h(t) at different distances. The test distances are 0, 1, 2, 3, 4 and 5 meters respectively. Figure 6.1 shows the distribution of test points in a simulated room environment. We use the same AM noise signal as sound source in DOA estimation to do the test. 47.
(58) Table 6.2: The parameters of the test room A for evaluation. Volume(m3 ) 72 (4x6x3). Reflection coefficient 0.56 (Concrete materials). Reverberation time (s) 0.39. Description Small office. Figure 6.1: Distribution of test points in a simulated room environment.. 48.
(59) Figure 6.2: Estimation result in Room A.. 49.
(60) Figure 6.3: RMSE result of distance and its standard deviation.. 6.2.1. Discussion. The comparison between the curve of the distance value obtained by the proposed method and the real value is shown in the Fig. 6.2. Figure 6.3 shows the RMSE for each test. It can be seen that the RMSE is the largest at 1m and the smallest at 4m, with an overall mean RMSE of 0.32. The standard deviation of RMSE was 0.84.. 50.
(61) 6.3. Evaluation of Joint Estimation of Monaural DOA and Distance. To make evaluation of Joint estimation of monaural DOA and distance, several test points are set in 3D space. We use the same AM noise signal as that in DOA estimation and distance estimation, convolute it with HRIR database to get the artificial signal containing DOA information, and then convolute it with the impulse response h(t) of different distances constructed by ISM method in Chapter 6.2 to get the signals containing DOA and range information at different positions in 3D space. The RMSE results is shown as Tab. 6.3. Table 6.3: Results of Joint estimation of monaural DOA and distance. ❛❛ ❛. ❛❛ DOA (−30, 0) (−10, 40) (10,80) (30,160) (50,240) (70,320) (80,355) Distance ❛❛ ❛ ❛. 0m 1m 2m 3m 4m 5m Mean RMSE S.D of RMSE. 6.3.1. 5.83 4.37 4.08 7.91 7.80 6.89. 6.7 7.24 3.95 6.78 6.67 6.76. 5.71 4.25 5.96 6.79 3.68 5.77. 5.67 6.21 6.92 6.75 5.64 5.63. 7.11 7.65 7.36 7.19 7.08 7.17. 8.96 9.19 7.51 8.67 8.21 9.38 6.04 9.27 8.93 9.16 3.02 10.13 5.76 2.87. Discussion. The evaluation results show that the mean RMSE of joint estimation of monaural DOA and distance in the test 3D space is 5.76, and the standard Deviation of RMSE is 2.87.. 51.
(62) Chapter 7 Conclusion 7.1. Summary. Most studies of sound localization have used microphone arrays based on people’s binaural auditory cues. But in recent years, studies have shown that humans can use monaural cues to locate sound. At the same time, it has been reported that MMS can be used in sound localization include DOA and distance. Based on these considerations, this paper aims to investigate the monaural cues related with DOA and distance of sound source in MMS and propose a method for estimating monaural DOA and distance in 3D space using modulation spectrum analysis. The previous proposed method has proved that MMS can be used in monaural DOA estimation in 3D space. Unfortunately, it has a large RMSE in monaural DOA estimation and the performance varies greatly in different positions. In addition, the possibility of monaural sound soure distance estimation by using MMS has not been investigated. So, to achieve the research goal, there are two parts in this study. First, improve the performance of MMS based monaural DOA estimation method in 3D space. Secondly, investigate the related features in MMS that could be used in monaural distance estimation and proposed a method for monaural distance estimation using MMS features. In the first part, the causes of the larger RMSE in the previous study were investigated. It is found that the model in the previous method has the problem of under-fitting. In this case, an improved method based on increasing the regression order is proposed. At the same time, the effect of the regression order on the model was also investigated, It is found that the optimal regression order is 8. Evaluation results indicate that the improved method can adequately estimate the DOA in 3D space with an overall RMSE of 5.59 degrees. Compared with the overall mean RMSE of 22.02 degrees. 52.
(63) obtained by our previous method, the RMSE of estimation decreased by 74.6%. This shows that the accuracy of DOA estimation can be improved by increasing the regression order of the model. In the second part, it is found that in reverberation environment, that the tilt of MMS can be used for monaural absolute distance estimation. Based on these findings, a MMS features based monaural distance estimation method is proposed. The evaluation results show that the average RMSE of the proposed monaural distance estimation method is 0.32 and the standard deviation of RMSE is 0.84. The monaural distance estimation using MMS is realized in this part. Finally, by combining DOA estimation model with distance estimation model, a Joint DOA and distance estimation method is proposed. The evaluation results show that the average RMSE of the Joint estimation method is 3.45. All these elevation results show that MMS is high related with monaural sound localization and the proposed method based on MMS features can be used in monaural DOA as well as distance estimation.. 7.2. Future Works. Since this study is based on human modulation perception, the source signals used in this study are all artificial AM noise. This study can be extended to other types of signals in the future. In addition, the resolution of distance used in this study is 1m. In order to make a more accurate estimation, the resolution of distance can be shortened in the future. Meanwhile, the room model used in distance estimation is virtual model. In the future, we can collect h(t) at different distances in the actual environment. In the joint estimation stage, the interaction between DOA and distance is not considered. This is a subject worthy of study. And there are few test points in 3D space. In the future, more accurate joint estimation model can be established through a large number of data. In addition, this study did not consider the influence of background noise when using artificial sound source signals. In future research, how to improve the robustness under noisy environments is a problem worthy of study. At the same time, it is only suitable for a single sound source. It is also a topic worthy of study whether to combine the sound source separation to realize the target sound source localization under the cocktail problem.. 53.
図
+7

Outline
関連したドキュメント
By using the first order averaging method and some mathematical technique on estimating the number of the zeros, we show that under a class of piecewise smooth quartic
Johns, “Asymptotic distribution of linear combinations of functions of order statistics with applications to estimation,” Annals of Mathematical Statistics, vol.. Hosking,
Based on the Perron complement P(A=A[ ]) and generalized Perron comple- ment P t (A=A[ ]) of a nonnegative irreducible matrix A, we derive a simple and practical method that
In other words, the aggressive coarsening based on generalized aggregations is balanced by massive smoothing, and the resulting method is optimal in the following sense: for
In this paper, based on a new general ans¨atz and B¨acklund transformation of the fractional Riccati equation with known solutions, we propose a new method called extended
8, and Peng and Yao 9, 10 introduced some iterative schemes for finding a common element of the set of solutions of the mixed equilibrium problem 1.4 and the set of common fixed
The purpose of this paper is to apply a new method, based on the envelope theory of the family of planes, to derive necessary and sufficient conditions for the partial
In this paper, we obtain some better results for the distance energy and the distance Estrada index of any connected strongly quotient graph (CSQG) as well as some relations between
