INFORMS is l ocat ed in Maryl and, USA
Management Science
Publ icat ion det ail s, incl uding inst ruct ions f or aut hors and subscript ion inf ormat ion:
ht t p: / / pubsonl ine. inf orms. org
The Det erminant s of Bank Mergers: A Reveal ed
Pref erence Anal ysis
Okt ay Akkus, J. Ant hony Cookson, Al i Hort açsu
To cite this article:
Okt ay Akkus, J. Ant hony Cookson, Al i Hort açsu (2015) The Det erminant s of Bank Mergers: A Reveal ed Pref erence Anal ysis. Management Science
Publ ished onl ine in Art icl es in Advance 24 Nov 2015 . ht t p: / / dx. doi. org/ 10. 1287/ mnsc. 2015. 2245
Full terms and conditions of use: http:/ / pubsonline. informs. org/ page/ terms-and-conditions
This ar t icle m ay be used only for t he pur poses of r esear ch, t eaching, and/ or pr ivat e st udy. Com m er cial use or syst em at ic dow nloading ( by r obot s or ot her aut om at ic pr ocesses) is pr ohibit ed w it hout explicit Publisher appr oval, unless ot her w ise not ed. For m or e infor m at ion, cont act per m issions@infor m s.or g.
The Publisher does not war rant or guarant ee t he ar t icle’s accuracy, com plet eness, m er chant abilit y, fit ness for a par t icular pur pose, or non- infr ingem ent . Descr ipt ions of, or r efer ences t o, pr oduct s or publicat ions, or inclusion of an adver t isem ent in t his ar t icle, neit her const it ut es nor im plies a guarant ee, endor sem ent , or suppor t of claim s m ade of t hat pr oduct , publicat ion, or ser vice.
Copyr ight © 2015, I NFORMS
Please scroll down for article—it is on subsequent pages
INFORMS is t he l argest prof essional societ y in t he worl d f or prof essional s in t he f iel ds of operat ions research, management science, and anal yt ics.
ISSN 0025-1909 (print)ISSN 1526-5501 (online) http://dx.doi.org/10.1287/mnsc.2015.2245 © 2015 INFORMS
The Determinants of Bank Mergers:
A Revealed Preference Analysis
Oktay Akkus
Nathan Associates, Arlington, Virginia 22209,[email protected]
J. Anthony Cookson
Leeds School of Business, University of Colorado at Boulder, Boulder, Colorado 80309,[email protected]
Ali Hortaçsu
Department of Economics, University of Chicago, Chicago, Illinois 60637,[email protected]
W
e provide new estimates of merger value creation by exploiting revealed preferences of merging banks within a matching market framework. We find that merger value arises from cost efficiencies in overlapping markets, relaxing of regulation, and network effects exhibited by the acquirer-target matching. Beyond our findings, the revealed preference method has notable advantages that warrant its application beyond the bank merger market. Notably, we show that the method outperforms reduced form alternatives out of sample, enables sensible counterfactual experiments, and can be used to evaluate private-to-private mergers, which have been understudied because of lack of stock market data.Data, as supplemental material, are available athttp://dx.doi.org/10.1287/mnsc.2015.2245.
Keywords: corporate finance; financial institutions; banks; industrial organization; market structure; mergers; two-sided matching; antitrust; banking
History: Received September 9, 2014; accepted May 5, 2015, by Amit Seru, finance. Published online inArticles in Advance.
1.
Introduction
Understanding merger value creation is critically impor-tant for the shareholder value at stake, and because how merger value is created has important implications for the nature of competition and consumer well-being (e.g., seeBernile and Lyandres 2010). Unfortunately, the vast majority of mergers involve at least one private company, making it difficult to estimate value creation using changes in stock market value around merger announcements (Bayazitova et al. 2012). This limitation of stock market evidence is especially pronounced in industries where private firms play an important role (e.g., banking, supermarkets, restaurants).
To overcome this difficulty, we develop a novel approach to estimate merger value creation that can be applied even for private-to-private mergers because it relies on the choices of the merging firms directly, rather than stock market responses to the merger announce-ment.1We use the structure of a two-sided matching
1Using a method that is similar in spirit,Devos et al.(2009) use
Value Line forecasts of cash flows to produce an estimate of merger value that is linked directly to the underlying fundamentals of the firm. In comparison to their method, our technique does not require analyst coverage or any assumption about the validity of the forecasts. In place of an assumption that the forecasts are reliable, we maintain the assumption that each firm in the merger market reveals a consistent set of preferences by their choice of merger.
market to identify outside options for each firm (e.g.,
seeBecker 1973,Roth and Sotomayor 1990) and use
characteristics of these outside options in comparison to the actual merger choices to structurally estimate merger value creation. Our approach has three notable advantages relative to reduced form methods that utilize stock market information. First, our method is easily applied to evaluate mergers with private targets or acquirers because it does not rely on stock market information. Second, our structural estimation accounts explicitly for the endogenous matching pro-cess by which acquirers match with targets, which is an important source of endogeneity in determining which characteristics matter for merger synergies. Finally, our structural analysis allows for counterfactuals, which are difficult using reduced form methods.
We highlight each of these advantages in an empir-ical analysis of the bank merger market, employing comprehensive merger-level data from 1995 to 2005 in our study of the determinants of bank merger value. The choice to study bank mergers is natural because it is straightforward to define the scope of the matching market within a narrowly defined industry such as banking. This is especially true during our sample time frame (1995–2005), the decade following the elimina-tion of cross-state branching restricelimina-tions (Riegle-Neal
1
Interstate Banking and Branching Efficiency Act 1994).2
We use this cross-state standardization of merger regu-lations to motivate our treatment of mergers in the U.S. banking industry as a national merger market that takes place each year.
In our empirical analysis, we recover a structural merger value function that accounts explicitly for the endogenous matching process; thus, it can be used for causal inference. We use our approach to study how features of the acquirer and the target institutions affect the value of the bank merger. According to industry sources, an important reason for banks to merge during our sample was to capitalize on economies of scale. As a 1998 article in theSan Francisco Chroniclenoted, “A bigger bank can acquire customers more cheaply
by marketing on a national scale, and can reduce risk by diversifying geographically” (Marshall 1998). In a two-sided matching market, these factors suggest that large banks derive more value from larger target banks, which would generate a positive assortative match in bank size (Becker 1973). Our framework accounts for this cost advantage of large banks by including terms in the match value function that capture the interaction between the size of the acquirer and target banks.
Our main specification quantifies the effect on merger value of cost efficiencies of various types (e.g., merging to a more efficient scale and capturing economies of scope in nearby markets), as well as merger value derived from additional market power. Our structural approach accounts for these explanations by defin-ing a merger value function that explicitly depends on market concentration and the overlap between acquirer and target markets. We also include measures of performance and valuation of the target banks to evaluate how target performance relates to value cre-ation (Maksimovic and Phillips 2001). In effect, this specification allows us to distinguish whether the merger value we recover arises from choices motivated by synergies of different types. The revealed preference method allows the data and the pattern of mergers to speak directly to which of these explanations is consistent with merger decisions and merger value creation.
Throughout our empirical exercise, we find that the mergers we study were primarily motivated by effi-ciencies, cost reductions, or reducing inefficiencies from previous regulations, and that market concentration
2The 1994 Riegle-Neal Interstate Banking and Branching Efficiency
Act effectively standardized the state-by-state deregulation in branch-ing rules that had been takbranch-ing place over the previous two decades. After the Riegle-Neal Act, the U.S. banking industry consolidated con-siderably, in large part due to the merger wave we study. Specifically, the total number of banking institutions in the United States declined from 10,416 to 7,582 in the decade following Riegle-Neal (FDIC Summary of Deposits, 1995–2005). For a complete historical account of this deregulation process as well as a comprehensive empirical analysis of its determinants, seeKroszner and Strahan(1999).
(measured by a Herfindahl index) also contributes positively to the value of the merger. On the other hand, we find little evidence that mergers were motivated by high (or low) performing target banks. Consistent with an efficiency rationale for value creation, we find that merger value is greater when there is a greater overlap between acquirer and target markets, and that these gains are greater for mergers between banks regulated by the same agency before the merger. These effects likely represent efficiencies rather than market power because we also control for market concentration in the target’s markets in these specifications. The magnitude of these efficiency effects on merger value are sensible, amounting to nearly the annual administrative cost of operating a single bank branch (Radecki et al. 1996). These efficiencies may arise from the ability of the combined bank to pool fixed operating expenses such as advertising and ATM networks across the acquirer and target banks.3
Our work also sheds light on the effects of banking deregulation by studying mergers in the post-Riegle-Neal banking industry. Early work on banking deregu-lation focused on how dereguderegu-lation affects aggregate measures of economic activity such as state per capita income growth and its volatility (Strahan 2003). More recent work has turned to study deregulation’s compet-itive effects on small-firm finance and innovation (Rice
and Strahan 2010,Cornaggia et al. 2015). We deepen
existing work on the outcomes of banking competition by studying the value of bank mergers at the merger level. When we aggregate to the entire banking indus-try, we estimate significant value generated from the increased merger activity during our post-Riegle-Neal sample, a new and novel quantitative indication that the prohibition of banking and branching across state lines was costly.
In addition, we include other features of banking regulation in our specifications for the merger value function. In particular, we allow the merger value function to depend on whether the acquirer and target have different banking charters; thus, they report to different regulatory agencies before the merger. By including this information in the merger value function, we recover the implicit costs of diverse chartering regulations from the pattern of mergers. In this way, our results speak to the effects of inconsistent regula-tors and are complementary to the evidence presented
3Viewed from the perspective of the banking literature, these findings
provide an external check on previous work that evaluated market power versus branching efficiency motives for bank mergers using stock market evidence (Rhoades 1994,Seims 1996). Notably, the existing literature documents a takeover premium for acquired firms, because in the broader merger literature (Rhoades 1994, Eckbo 2009) mergers do not appear to lead to significant changes to market concentration, and there appears to be an efficiency motive for mergers between banks with significant overlap in markets (Seims 1996).
byAgarwal et al. (2014). In a counterfactual exercise, we find that value generated by mergers would be 20%–50% higher per year if all banks were of the same charter type. This result suggests that there are significant frictions in the bank merger market imposed by regulation.4 Once we rescale our estimates by the
fraction of banks that merge in a typical year, our counterfactual-estimated cost of bank chartering regula-tion equals 1%–2.5% of the value of the entire banking industry. This cost estimate reflects both implicit and explicit costs as revealed by choices of the merging firms and is of the same magnitude as explicit annual supervisory costs (Whalen 2010).
Because our approach uses the matching equilibrium explicitly in a structural model, the estimated match value function we obtain can be used to predict bank mergers, even after the policy environment changes. A structural approach like ours is particularly useful because matching market equilibria are sensitive to small perturbations in payoffs and changes in the policy environment. In these cases, structural estimates can be used to more reliably predict merger outcomes than analogous reduced form approaches. Indeed, the pre-dictive strength of our structural method is borne out in the data. We compare the one-year-ahead predictive accuracy of our structural method to a reduced form predictive regression that uses a binary logit and the predictors that make up our match value function. We find that our revealed preference method dramatically outperforms standard predictive regressions, allowing us to more reliably predict mergers one year ahead than a binary logit approach. Our method represents such a dramatic improvement over reduced form predic-tive regressions partly because reduced form methods without proper instruments are subject to endogenous matching. Our technique explicitly accounts for the endogenous matching process, thereby providing a more reliable basis for predicting mergers.5
4These frictions reduce value generated in the bank merger market
because we find that—on balance—the mergers in our sample generate value. If the mergers that were obstructed by the frictions were value destroying, the regulatory frictions could actually increase value.
5Although our method requires relatively few assumptions, a notable
assumption we employ to apply our model to the bank mergers setting is that the bank merger market is national immediately after the Riegle-Neal Act passed. This assumption is not literally true because some states lagged in their official adoption of the law’s provisions (seeJohnson and Rice 2008). We address this concern about the validity of our assumption and robustness of our method by estimating the match value function in each year of the sample. The predictive accuracy of our structural method outperforms the baseline binary logit predictive accuracy in every year of our sample (even in earlier years), suggesting that to the extent the assumption is violated, the advantages of our structural method outweigh the costs. The online appendix (available as supplemental material at http://dx.doi.org/10.1287/mnsc.2015.2245) presents and reports this exercise.
The fact that we maintain the assumption that man-agers maximize firm value highlights a limitation of using our revealed preference methodology. By relying on the choices of managers to identify what determines merger value, the revealed preference method recovers the value created from the standpoint of managers, not necessarily shareholders. Thus, whenever agency conflicts are important, revealed preference estimates of value creation are a poor substitute for event study estimates, which more directly recover value created for shareholders. This limitation is important to keep in mind when applying our methodology to study share-holder value or fundamental synergies. Nonetheless, using our structural merger value function to estimate merger value creation, we estimate an annual average of 6.02% of mergers that destroy value from the stand-point of the merged entity. Although our estimates are based on the choices of managers, our magnitudes are similar to recent estimates of merger synergies from the shareholder’s perspective (Bayazitova et al. 2012).
Beyond being consistent with recent stock market evidence on merger synergies, several advantages of the revealed preference method are important to emphasize. First, because it does not rely on stock market data, our revealed preference method can be applied to mergers between two private entities when mergers and characteristics data for private-to-private mergers are available, expanding the potential scope of analysis and inference. In a similar vein, other authors have expressed interest in relaxing the dependence of merger value creation measures on stock market data.Maksimovic and Phillips(2001) suggest an alternative method for evaluating the value of mergers that does not rely on stock market information, by using productivity measures. More recently,Devos
et al.(2009) produced estimates of merger synergies
from Value Line forecasts, which depend more directly on fundamental value creation. Our method shares the advantage of these methods without requiring a reliable measurement of productivity or coverage by Value Line. Second, our structural model accounts for endogenous merger selection directly, which enhances confidence that the characteristics that drive merger values actually drive merger values, rather than a by-product of the merger selection process. Finally, our structural method allows for counterfactual exercises that are robust to changes in the policy environment. This feature of our structural exercise enables a more accurate forecast of merger activity than alternative methods to predict mergers.
More broadly, our approach relates to recent work by
Gorbenko and Malenko (2014), who estimate merger
valuations by explicitly modeling each merger as an independent auction using observed takeover bids. In contrast, our equilibrium-based approach implies that takeover bids are not independent but are linked
across targets because each acquirer in the same merger market can bid on the same set of targets. We infer merger value by the choices forgone by successful bidders, and as a result our method does not require observation of successful and unsuccessful bids by acquirers. This is an attractive feature of our setting when high bids by strong potential acquirers discourage bidding from potential acquirers with slightly lower valuations, or when few formal bids are solicited from strongest potential acquirers.
Our work also relates to a growing literature in industrial organization that employs revealed prefer-ence methods (e.g.,Aguirregabiria et al. 2012). Notably,
Chen and Song(2013) apply the Fox(2010a) estimator to the matching between banks and firms and find evidence of a positive assortative match between banks and firms. To the extent that firms’ linkages with target banks are persistent, we should expect that these char-acteristics of bank-firm matching would be relevant to acquirer-target bank matching, which is our focus. Indeed, that larger targets likely have larger firms as clients is one reason to expect that acquirer and target banks mergers will also exhibit the positive assortative match we document here.
More generally, our paper contributes to an increas-ingly important segment of the empirical finance litera-ture that explicitly addresses endogeneity in financial markets research (Roberts and Whited 2012). In the last decade, structural approaches have yielded new insight into a wide variety of topics in finance, including debt dynamics, corporate cash holdings, and the role of venture capital firms (Sørensen 2007,Hennessy and
Whited 2005, Boileau and Moyen 2015). Relative to
existing structural work in finance, our paper employs relatively few assumptions to recover a structural value function. As a result, our method is conceptually straightforward, and similar methods to ours should find fruitful application to address important questions in financial economics.
The remainder of this paper is structured as follows. Section2presents our revealed preference method and uses Monte Carlo experiments to evaluate the estima-tor’s small sample properties. Section3describes the data and basic summary statistics. Section4motivates and describes the form of our specifications. Section5
is a discussion of the main results on value creation and the determinants of value creation. Section6discusses in-sample and out-of-sample performance, compares to relevant alternatives, and presents a counterfactual simulation. Section7concludes.
2.
The Revealed Preference Model
When analyzing merger value, it is instructive to observe that each acquirer deliberates among a number of viable alternative targets, and each target considers
viable offers from a number of alternative acquirers. In practice, targets often entertain multiple takeover bids at the same time (e.g., see Bhagat et al. 2005), but these offers need not be explicit to matter for the merger market decisions of targets and acquirers. Through this equilibrium channel, the values of feasible alternative matches—both implicit and explicit offers— provide a lower bound for the value of each realized merger. Our revealed preference approach formalizes this intuition by explicitly using the characteristics of each bank’s alternative matches together with the observed acquirer-target transfers to estimate the value of the mergers that do occur.
In our model of bank mergers as a two-sided match-ing game (Roth and Sotomayor 1990), the merged acquirer-target pair realizes a joint match value, which is split using an equilibrium transfer from the acquirer to the target. Each bank matches with the bank on the other side of the market that maximizes its individual payoff. In equilibrium, matched banks receive a higher payoff from the observed match partners than they could get from counterfactual partners.
In the model, we construct many possible coun-terfactual matches to each observed match within a matching market, yielding many inequalities in the structural match value for each observed match. Given these inequalities and a parametric form for the match value function, we choose the parameter vector that maximizes the fraction of inequalities that hold. This is the maximum score estimator, whichFox (2010a) proved to be consistent for matching games given a rank order condition (as in Manski 1975, 1985).6
Building onFox(2007;2010a, b),7we develop a
maxi-mum score estimator that incorporates acquirer-target transfer data. Transfer data allow the maximum score estimator to produce estimates on an interpretable scale, which is advantageous for understanding the determinants of merger value creation.8
6Fox(2010a) made separate consistency arguments for one large
matching market and many independent matching markets. In the U.S. bank mergers setting for our sample time frame, we have 11 distinct matching markets, one for each year. We view each annual matching market as a large matching market, consistent with the single matching market case inFox(2010a), and the fact that we observe mergers for multiple years allows us to estimate the match value function with even greater precision. Nevertheless, our year-by-year results rely more explicitly on the assumption of a large matching market that meets each year.
7The maximum score estimator proposed byFox(2007) does not use
data on transfers. The fact that the estimator works when transfer data are not available is an advantage if no data on transfers are available, which is true in many matching contexts.
8In addition, we demonstrate that for parameters that are identified
using the without-transfers estimator ofFox(2010a), our estimator is more precise. We also demonstrate that our method identifies parameters that cannot be identified without transfer data, e.g., the sensitivity of the match value function to a change in some characteristic of the target bank.
2.1. Matching Model
For a total number ofMymatches in matching markety,
we denote acquirers byb=11 0 0 0 1 My and targets by
t=11 0 0 0 1 My. We assume there is one national merger market per year and markets in different years are independent of one another. The merged pair4b1 t5
realizes a post-merger valuef 4b1 t5, which is the sum-mation of the individual payoffs to the acquirer and target,f 4b1 t5=Vb4b1 t5+Vt4b1 t5.
The payoff to the acquirerVb4b1 t5 is the post-merger
value minus the acquisition pricepbt paid to the tar-get, f 4b1 t5−pbt. The target’s payoff Vt4b1 t5 equals
the acquisition pricepbt. Each acquirerbmaximizes
Vb4b1 t5across targets. Each targett maximizesVt4b1 t5
across acquirers. In the matching equilibrium, every bank derives higher value from the observed acquirer-target match than from any counterfactual match. This revealed-preference insight gives inequalities that we use in our estimation. For example, if acquirerb is matched with targett, whereas targett′ could have
been acquired by acquirerb, we infer thatbderives more value from being matched witht than witht′,
which gives the following condition:
Vb4b1 t5≥Vb4b1 t′51
f 4b1 t5−pbt≥f 4b1 t′5−pbt′0
(1)
The transfer from acquirerb to targett′ p
bt′ is not available from data on observed matches; however, in equilibrium each targettreceives an offer that is the same across acquirers. For acquirerbto acquire targett, the offerpbt from acquirer bmust be weakly
greater than the offerpb′t from a competing acquirerb′. Acquirerb’s equilibrium offer will not be strictly greater than the alternative because higher offer prices reduce acquirerb’s payoff. Hence,pbt′=pb′t′ and the inequality in (1). The same logic applies to acquirerb′, yielding
the following inequalities:
f 4b1 t5−f 4b1 t′5≥p
bt−pb′t′1 (2)
f 4b′1 t′5−f 4b′1 t5≥p
b′t′−pbt0 (3) The inequalities have a natural interpretation. For example, (2) means that the extra value that acquirerb
derives acquiring targett rather than targett′ exceeds
the extra expense of acquiring targett rather than targett′. Equations (2) and (3) are useful if we have
data on transfer amounts, but these data are often unavailable. In the absence of transfer data, we can add these inequalities to obtain a single inequality that does not rely on data from transfers:
f 4b1 t5+f 4b′1 t′5≥f 4b′1 t5+f 4b1 t′50 (4)
This inequality implies that the total value from any two observed matches exceeds the total value from two counterfactual matches constructed by exchanging partners.
2.2. Estimation of the Matching Model
Letbt be a match-specific error that affects the value
to acquirerbmatching with targett. Then, acquirers and targets match to one another according to the match value functionF 4b1 t5=f 4b1 t5+bt. Because each
acquirer can only acquire one target, the acquirer’s choice among targets is a discrete choice. As a sim-ple semiparametric technique to estimate this discrete choice, we turn to maximum score estimation.9Fox
(2010a) developed a maximum score estimator that
makes use of inequality (4). Specifically, given a para-metric form for the match value functionf 4b1 t5, one can estimate the parameter vector by maximizing
Q45=
Y
X
y=1
My−1
X
b=1
My
X
b′=b+1 1
f 4b1 t5+f 4b′1 t′5
≥f 4b′1 t5+f 4b1 t′5
(5)
over the parameter space for. For a given value of the parameter vector˜,Q45˜ is the number of times the inequality (4) is satisfied. The maximum score estimatorˆ, therefore, maximizes the number of times that this inequality holds among the set of inequalities considered.10
Although attractive in its simplicity, the maximum score estimator based on (4) does not make use of transfer data, which may significantly improve the per-formance of the estimator. Moreover, acquirer-specific or target-specific attributes cancel out when we add the inequalities (2) and (3) together to obtain (4). Therefore, any parameters that measure the sensitivity of the match value function to target-specific attributes cannot be identified with maximum score estimation based solely on without-transfers information.11
9If we assume that the match-specific errors
bt are distributed i.i.d.
Type 1 extreme value, the model reduces to the familiar multinomial logit model. A significant weakness to the multinomial logit approach is that it imposes a restrictive set of substitution patterns, for example, the red-bus blue-bus problem (McFadden 1974,Debreu 1960). An acquirer should be more likely to substitute between similar targets, yet the multinomial logit model does not easily allow for this type of substitution. We explicitly contrast the performance of the multinomial logit to our maximum score technique in the online appendix. The online appendix also considers another alternative, one-sided matching. In both cases, our two-sided matching method that uses maximum score estimation is preferable.
10Fox demonstrates that one need not consider all possible
inequali-ties to obtain a consistent estimator, but one need merely form a large subset of all possible inequalities.Fox(2010a) shows that the maximum score estimatorˆis consistent if the model satisfies a rank order property (as inManski 1975,1985) for matching games; i.e., the inequality in Equation (4) impliesP 6bacquirestandb′acquirest′7≥
P 6bacquirest′andb′acquirest7. In addition to providing intuition
for conditions under which the maximum score estimator should be used, this strong version of the rank order property is used in the identification arguments given byFox(2010b).
11This point only applies to target-specific attributes. The sensitivity
of match value to acquirer-specific attributes is unidentified in
Both to improve the precision of the estimator and to identify the effect of target-specific attributes, we develop a related estimator that uses transfer data, which we call the with-transfer estimator (WT1). We call the maximum score estimator based on Equation (4) the no-transfer-data (NTD) estimator.12
For the same pairwise comparisons used to form the objective function for the NTD estimator, the WT1 estimator imposes the inequalities (2) and (3) simulta-neously. If both (2) and (3) hold, (4) holds as well, but the converse is not true. The WT1 estimator maximizes the objective function:
Qtr45= Y
X
y=1
My−1
X
b=1
My
X
b′=b+1 1
f 4b1t5−f 4b1t′5≥p
bt−pb′t′
∧f 4b′1t′5−f 4b′1t5≥pb′t′−pbt
0 (6) In the online appendix, we perform a series of Monte Carlo exercises to evaluate the properties of the WT1, finding that our WT1 performs well relative to a number of notable alternatives.13Relative to the
without-transfers estimator ofFox(2007), we confirm two main advantages: (1) transfers data allow for much greater precision in estimating determinants of merger value creation, and (2) the with-transfers estimator can identify parameters that are otherwise unidentified without data on transfers—namely, target-specific determinants of merger value creation.
2.3. Interpretation of Estimated Merger Values
It is important to clarify the interpretation of estimated merger values from our framework. Because we rely heavily on manager choices to infer merger value creation, our approach recovers the value createdfrom the standpoint of the managers of the firm. Given this, if the managers maximize shareholder value, revealed
this revealed preference model. This is straightforward to see in Equations (2) and (3). For example, the difference on the left-hand side of (2) refers to the same acquirer; thus, anything characteristic in the value function that is acquirer specific is differenced out of the revealed preference inequalities.
12We have also considered an alternative with-transfers estimator
(WT2) that imposes inequalities (2) and (3) separately, but this estimator does not perform as well in the Monte Carlo experiments as WT1. In the online appendix, we also describe a quadratic loss specification where differences between target and acquirer are penalized, and a cross-attribute specification in which asset×branches interactions are allowed.
13In addition, the online appendix reports a comparison of the
with-transfers estimator to a multinomial logit specification along the lines ofMcFadden(1974), and we find that our structural method has greater precision. We also relax the assumption that mergers occur in a matching market with two sides (acquirers and targets) in favor of a weaker assumption that each bank that merged could be on either side of the merger market. Our method based on two-sided matching exhibits strikingly similar performance as this one-sided matching model.
preference estimates of merger value creation are a good substitute for stock market estimates. On the other hand, when agency problems between managers and shareholders are important (e.g., empire build-ing motives), manager-centric values from a revealed preference approach will correspond less well with changes in shareholder wealth.
In addition, even if there are no agency conflicts between shareholders and managers, greater cross-ownership of acquirer and target firms by institutional investors (as is studied byMatvos and Ostrovsky 2010) reduces the cost of large acquirer-to-target transfers from the standpoint of shareholders. In this context, managers who well represent the preferences of their institutional shareholders view transfers as less costly than they appear from the standpoint of our methodol-ogy. In our methodology, a merger that occurs despite a high transfer price is inferred to have high synergy. As such, mergers with a high degree of cross-ownership will tend to have greater merger values inferred from revealed preference. These high estimated merger val-ues arise because of synergies in who owns the firms, not necessarily because of fundamental synergies in the underlying firms.
With these caveats in mind, our revealed preference method is an effective method to use when studying the motives of managers to undertake corporate decisions, but to the extent that there are agency conflicts, future research should be cautious in applying the insights from revealed preference to the value created for shareholders or to fundamental synergies. On the other hand, our revealed preference estimates of merger value creation are manager-centric, which implies that they may be more appropriate for recovering merger synergies that are more salient to managers than to shareholders.
3.
Description of Data
3.1. Merger-Deal Data
We study the matching market for banks using com-prehensive bank merger and attribute data from SNL Financial (http://www.snl.com/). The data span all bank mergers in the United States between 1995 and 2005 and provide information about acquirer and target banks at the merger-deal level. For the date at which the acquisition is announced, the data provide the asset holdings (Ab andAt) and number of branches (Bb and
Bt) for both acquirer and target bank. We also observe
the market value of the transfer (pbt) from the acquirer
bank to the target bank upon merging.
SNL Financial’s database also provides data on several performance measures of acquirer and target banks. These performance measures are the efficiency ratio (noninterest expense/(net interest income+other income)) and the loan loss reserve coverage ratio (loan
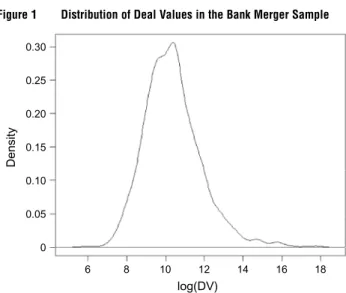
Figure 1 Distribution of Deal Values in the Bank Merger Sample
0.30
0.25
0.20
0.15
Density
0.10
0.05
0
6 8 10 12
log(DV)
14 16 18
Notes. This figure portrays the distribution of logged deal values in the sample of observed mergers. Deal value is defined as aggregate price paid for the equity of the entity sold in the transaction, as of the event in question. Where available, deal value is calculated as the number of fully diluted shares outstanding, less the number of shares excluded from the transaction, multiplied by the deal value per share, less the number of “in the money” options/warrants/stock appreciation rights, times the weighted average strike price of the options/warrants/stock appreciation rights. Deal value excludes debt assumed and employee retention pools.
loss reserves/nonperforming loans).14 Because the
information on these performance measures is not available for every merger deal in our sample, we employ these measures in auxiliary specifications that serve to check the robustness of our main findings and to speak directly to managerial motives to merge. In addition, we also construct a measure of deal value at the merger-deal level to use as the equilibrium transfer
pbt in our with-transfers estimator.15Figure 1portrays
the distribution of deal values in our sample in a density plot of logged deal values. From the figure, the distribution of logged deal values is well behaved and symmetric.
3.2. Bank and Branch Attribute Data
The FDIC Summary of Deposits Banking Database gives the deposit holdings as of June 30th of each
14The data also contain the price to book ratio (stock price/book
value) of target bank at the time of merger as long as the bank is a publicly traded company. Restricting the sample of mergers to those where the target is publicly traded leaves too few observations to obtain reliable estimates.
15We measure deal value as aggregate price paid for the equity of
the entity sold in the transaction, as of the event in question. Where available, deal value is calculated as the number of fully diluted shares outstanding, less the number of shares excluded from the transaction, multiplied by the deal value per share, less the number of “in the money” options/warrants/stock appreciation rights, times the weighted average strike price of the options/warrants/stock appreciation rights. Deal value excludes debt assumed and employee retention pools.
Table 1 Consolidation in the U.S. Banking Industry (1994 to 2006)
Average Trimmed
Year No. of banks branches average branches Max
1994 10416 781 271 2024
1995 9825 824 281 2028
1996 9422 864 291 2052
1997 9110 901 303 2643
1998 8744 953 314 3132
1999 8449 998 324 4579
2000 8324 1027 333 4510
2001 8175 1053 343 4329
2002 8031 1078 354 4334
2003 7877 1115 366 4296
2004 7756 1158 374 5835
2005 7644 1204 383 5914
2006 7582 1250 394 5789
Source. FDIC Summary of Deposits Database. Trimmed averages are computed by dropping the top and bottom deciles and computing the mean.
year and the location—specifically, metropolitan statis-tical area (MSA) and state—for each branch of each banking institution in the United States from 1994 to 2006. Table1presents summary evidence on the merger-induced consolidation in the banking industry. From 1994 to 2006, the number of banking institutions declined from 10,416 to 7,582, whereas the average number of branches per bank increased from 7.81 to 12.50. The consolidation is not merely taking place among a few large banks, as indicated by trimmed mean of branches per bank, which has increased by nearly 50% over this period.
The Summary of Deposits Database also provides information on the regulatory agency responsible for overseeing each bank, which depends on the bank’s charter. Banks can adopt either a national charter or a state charter. If the bank has a national charter, it is regulated federally16and must become a member of
the Federal Reserve, which adds an additional layer of audits in exchange for the liquidity provided by being a member of the Federal Reserve system. Additionally, the FDIC serves as a backup regulator to all banks with national charters. If the bank has a state charter, the state regulatory agency is responsible for audits and the FDIC is the primary federal regulatory.17 A number of
mergers in our sample took place between acquirer and target banks with different charter types. To empirically assess the importance of this regulatory friction, we
16Depending on the type of institution during our sample time
frame, one of two federal regulatory agencies may be responsible for regulating a bank with a national charter: the Office of Thrift Supervision (OTS), which regulates savings banks and savings and loans associations; or the Office of the Comptroller of the Currency (OCC), which regulates national banks.
17State-chartered banks can also become members of the Federal
Reserve system, but in practice most state-chartered banks do not. This suggests that there is a trade-off between the benefits provided by the Federal Reserve and the auditing requirements.
construct an indicator variable,same_charterbt, which equals one if the acquirer and target have the same type of charter.
At the MSA level, we construct the market share of each banking institution using its fraction of total deposit holdings in the MSA. Using these market shares, we calculate this MSA-level Herfindahl Hirschman Index (HHI) before and after each merger, which allows us to assess whether a merger meets the criteria for additional scrutiny under the U.S. Antitrust Guidelines (HHI>11800 and ãHHI >200). We compute each MSA’s HHI by taking the sum of squared market shares. Using this information, we construct a merger-deal level covariateHHI_violatebt, which equals the fraction
of targett MSAs for which a merger with acquirerb
would lead to antitrust scrutiny under the Department of Justice’s merger guidelines.
Finally, for acquirer and target branches within MSAs, the FDIC geography identifiers allow us to construct a merger-deal level covariateoverlapbt, which equals the fraction of overlapping MSA markets for the acquirer and target banks. We construct this variable for each potential merger and estimate its contribution to the match value function.
4.
Estimation
4.1. Determinants of Match Value
During our sample period (1995–2005), bank mergers were potentially motivated by some combination of efficiencies,18 merging to acquire and exploit market
power, and acquiring better performing branches to improve the bank’s overall performance.19Together
with our data on institution size and performance (see §3.1for details on performance measures), we estimate how efficiencies and market power separately affect the bank merger match value function. A number of these determinants of bank merger value are target
18Using data from the pre-Riegle-Neal era,Kroszner and Strahan
(1999) demonstrate that new banking technologies for both deposit-taking and lending increased the geographic scale of banking. Our sample time frame (1995–2005) occurs during a period of rapid innovation in Internet technology, which increases the efficient scale of banking beyond the ATM and credit history technologies described byKroszner and Strahan(1999). Thus, economies of scale are as relevant for bank mergers in our time period as they were for the geographic scale of banking inKroszner and Strahan(1999).
19At the time of our sample, industry experts pointed to
efficien-cies (or reductions in inefficienefficien-cies) from cross-state mergers and deemphasized the role of market power as a motivator for merg-ing (Marshall 1998). Nevertheless, we consider this hypothesis by including market power terms in the match value function. In a 1998 newsletter to the Federalist Society,Rockett(1998) makes the point that the purported merger mania after the Riegle-Neal Act was—in part—motivated by achieving better stock market performance and improving balance sheets. To the extent that we observe measures of financial performance of targets and acquirers, we can assess whether these were primary motivators.
specific. Thus, the ability of the with-transfers estimator to identify target-specific determinants of merger value is important.
After the 1994 Riegle-Neal Act, mergers were often motivated by creating national banking networks that are less sensitive to local economic shocks and more valuable to consumers. To this end, there are obvious advantages to banking with a bank with a wider geographic footprint, as Anil Kashyap noted in 1998, “If you are a BofA customer, you won’t have to pay transaction fees at ATM machines since there’ll be one in every city you go to” (Marshall 1998). As an alternative to opening new branches, mergers are an effective way for a bank to achieve a large, national banking network. We account for this large-banking-network motivation to merge by including interactions between target and acquirer banking attributes (assets and branches) in our specification of the match value function.
A merger between two banking institutions will also generate cost efficiencies (or inefficiencies) unrelated to the size of the network of branches. If economies of scale are easier to capture in banking markets familiar to the acquiring bank, the match value between an acquirer bank and a target bank will tend to increase with the fraction of overlapping markets (captured by
overlapbt). On the other hand,Aguirregabiria et al.(2012) document significant potential to diversify geographic risk post-Riegle-Neal by expanding into new markets. Thus, the effect of overlap on bank merger value will tend to be negative to the extent geographic diversifi-cation of risk is an important motive for bank mergers. Thus, the ex ante relationship betweenoverlapbt and match value is an empirical question that speaks to whether geographic risk or economizing on local effi-ciencies is more important.
To address the extent to which the degree of market concentration increases merger match value, we include the average HHI of the target bank’s markets as a component of our match value function. Moreover, to the degree that antitrust regulation tempers this incentive to merge, we also include the fraction of target markets that would warrant antitrust scrutiny (HHI_violatebt) in our match value specifications. In the
middle of this merger wave, however, industry experts did not consider market power to be an important explanation for the large number of mergers during our sample period.20 Nevertheless, including these
terms in the match value function allows us to assess the market concentration hypothesis directly.
20“Most experts believe a merger between two huge banks operating
in different parts of the country—such as NationsBank and BofA—is unlikely to harm consumers by reducing competition, unlike a consolidation of banks in one local market” (Marshall 1998).
4.2. Functional Form for the Match Value Function
To use the maximum-score estimator, we specify a parametric form for the value of a match between targettand acquirerb.21For the match-value function,
we follow existing empirical work on matching markets (e.g.,Fox 2007,Chen and Song 2013) and evaluate the degree and direction of assortative matching using interactions between acquirer and target attributes. Exploiting the ability of our estimator to identify non-interacted parameters, we also extend the specification to include target-specific attributes:
F 4b1 t5=1WbWt+1′Xt+Ã2′Xbt+bt1 (7)
whereWb is an attribute of acquirerb andWt is the
same attribute for targett,Xt contains target-specific
covariates,Xbt is a vector of match-specific covariates,
and bt is an unobserved match-specific error term that we assume is independent across matches in our data set. We estimate several variations on this basic specification, adding to the match function in (7) interaction terms for additional attributes. Using the transfers data with our with-transfers estimator allows us to identify1, which is unidentified in the without-transfers estimator.
4.3. Subsampling Confidence Intervals
We generate point estimates by running the differen-tial evolution optimization routine from 20 different starting points and selecting the coefficient vector that yields the highest value for the maximum score objec-tive function.22For valid inference, we generate the
confidence intervals using the subsampling procedure described byPolitis and Romano(1992) andDelgado et al.(2001) to approximate the sampling distribution. For the entire data set, we set the subsample size to be 500—approximately 1/3 to 1/4 of the total sample size. Of all samples of sizens=500 drawn from the
original data set (N observations), we select at ran-dom 100 of these samples for use in constructing the confidence bounds.
For each of theS=100 subsamples, we compute the parameter vector that maximizes the objective function in (6). Call the estimate from the sth sub-sample ˆs and the estimate from the original full
sampleˆfull. The approximate sampling distribution for
21Because different specifications for this functional form focus
on different features of the matching between acquirer and target, we evaluate the robustness of our conclusions to several related specifications for the match value function in the maximum-score estimation in the online appendix.
22Fox(2007) argues that the maximum score estimator is consistent
if we randomly sample a sufficiently large number of inequalities to impose rather than the full number of inequalities (which is often intractably large). Relying on this insight, for each specification we run in this paper, we sample 40 acquirer-target pairs from each year and form the 40
2
inequalities implied by their matching.
our parameter vector can be computed by calculating
˜
s=4ns/N 51/34ˆs− ˆfull5+ ˆfull for each subsample.
This procedure accounts for the√3
N convergence of the maximum score estimator (Politis and Romano 1992,Delgado et al. 2001). We take the 2.5th percentile and the 97.5th percentile of this empirical sampling distribution to compute 95% confidence intervals for all of our estimates.
5.
Main Findings
This section presents the results from estimating sev-eral specifications of the match value function to bet-ter understand the debet-terminants of value creation in the merger market. The most robust determinants of merger value creation are lower regulatory frictions, cost efficiencies from overlapping markets, and network effects exemplified in the assortative matching between acquirers and targets.
5.1. Bank Size, Market Concentration, and Overlap of Markets
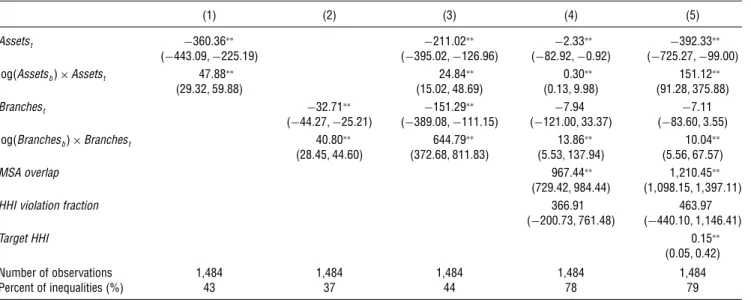
Table2presents results from estimating the revealed preference model with merger value function given by Equation (7). In every specification in Table2, the coef-ficient estimates on the interactions between acquirer and target assets (branches) are positive and statistically significant.23This finding suggests that large acquirer
banks tend to match with larger target banks, and that this pattern of matching is revealed to be valuable by the pattern of potential mergers that did not occur. For example, the estimate on the interactive term in column (2) implies that a 10% increase in the number of acquirer branches is associated with a $408,000 increase in the effect of an additional target branch on merger match value. This interactive effect remains significant whether or not the match value function includes target assets and the interactive term between acquirer and target assets. Although the magnitudes vary across specifications, the interpretation in the context of the observed match is that the matching equilibrium exhibits a strong positive assortative match on both branches and assets, a finding that is consistent with the conventional understanding that mergers dur-ing this time period (from 1995 to 2005) were motivated by taking advantage of large national networks.
Across specifications in Table 2, the estimates for the own effect of target assets and branches is negative across specifications, and these own effects tend to be statistically significant. This finding, together with the consistently significant interactive effects, suggests that a larger number of assets and branches in the target bank contributes positively to the match value, but not
23We take statistical significance to mean that the 95% confidence
interval from subsampling does not contain zero.
Table 2 Maximum Score Estimates of Match Value Function
(1) (2) (3) (4) (5)
Assetst −360036∗∗ −211002∗∗ −2033∗∗ −392033∗∗
(−4430091−225019) (−3950021−126096) (−820921−0092) (−7250271−99000)
log4Assetsb5×Assetst 47088∗∗ 24084∗∗ 0030∗∗ 151012∗∗
(29032159088) (15002148069) (001319098) (910281375088)
Branchest −32071∗∗ −151029∗∗ −7094 −7011
(−440271−25021) (−3890081−111015) (−121000133037) (−8306013055)
log4Branchesb5×Branchest 40080∗∗ 644079∗∗ 13086∗∗ 10004∗∗
(28045144060) (3720681811083) (50531137094) (5056167057)
MSA overlap 967044∗∗ 11210045∗∗
(7290421984044) (11098015111397011)
HHI violation fraction 366091 463097
(−2000731761048) (−440010111146041)
Target HHI 0015∗∗
(000510042)
Number of observations 1,484 1,484 1,484 1,484 1,484
Percent of inequalities (%) 43 37 44 78 79
Notes. This table presents estimates of the match value functionF 4b1 t5=Â′X
bt+Øbtusing maximum score estimation. Subsampling-based 95% confidence
intervals are in parentheses. Point estimates are generated by running the differential evolution optimization routine using R’s DEoptim package (Mullen et al. 2011). For differential evolution, we use 100 population members, scaling parameter 005, and we employ the classical differential evolution strategy (strategy=1). For point estimates, we run the optimization routine for 20 different starting points (seeds) and select the run that achieves the largest value of the objective function. For confidence intervals, we use the subsampling procedure described inPolitis and Romano(1992). We set the subsample size to be 500 (approximately 1/3 to 1/4 the total sample size) and randomly generate 100 replications of the routine to obtain confidence bounds.
∗∗Indicates significance at the 5% level; i.e., 95% confidence interval does not contain 0.
independently of the size of the acquirer bank. Taken together, the results suggest that a network of branches and customers is more valuable on average as the size of the network grows, suggesting that an acquirer with many branches and customers would derive disproportionately more value from a large target, ceteris paribus. On the other hand, there is a cost to managing more assets and branches. This cost shows up in the coefficient estimates on target attributes, which are consistently negative and statistically significant.
In the final two columns of Table2, the positive and significant estimates foroverlapbt suggest that banks derive significantly more match value if the acquirer and target have more overlapping markets. Relative to having no overlap in MSA markets, the estimate in column (4) implies that an acquirer and target with complete overlap in MSA markets will realize a nearly $1 million ($967,440) increase in the merger match value. Because our specifications account for market concentration, this finding suggests that the merging banks can realize operating efficiencies better when the target and acquirer banks have branches in the same MSA. The magnitude of this estimate is sensible given previous estimates to operate a bank branch. In a different context, Radecki et al. (1996) estimate that the total costs of operating a branch are around $1.4 million annually with indirect costs (e.g., advertising, and computing systems) amounting to half of that. Given this estimate holds constant the number of branches as another predictor in the match value function, these efficiencies more likely represent
cost savings on indirect costs like advertising that can be spread across multiple branches than cost savings from branch closures.
To the role of market concentration, the positive estimate on target bank’s average HHI suggests that greater market concentration increases the match value, consistent with greater market concentration allowing the combined bank to extract additional profit. On the other hand, having a higher fraction of MSA-level mar-kets that would justify antitrust scrutiny (i.e., greater HHI violation fraction) does not seem to either detract from the match value or add to it. As column (5) demonstrates, this finding on insensitivity of the match value function to the HHI violation fraction is robust to controlling for the target bank’s average HHI. Taken together with the results on assortative match and overlapping markets, the results from these specifica-tions indicate that both efficiency and market power rationales to merge create value for the merger.
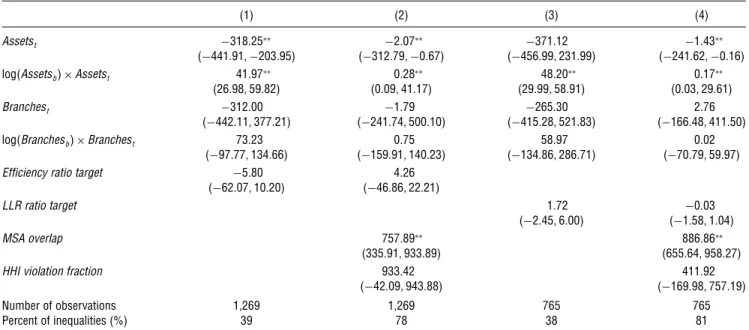
5.2. The Role of Premerger Target Performance
We also allow the match value function to depend on performance measures of targets: the efficiency ratio (noninterest expense/income) and the loan loss reserve coverage ratio (loan loss reserves/nonperforming loans).24 We include these performance measures to
24These measures are available from SNL Financial, but not for the
same set of banks. As such, including all measures at once reduces the number of observations in the specification to the point where identification is questionable. Thus, we evaluate the contribution of each of these categories in isolation of the other.
Table 3 Maximum Score Estimates of Match Value Function with Performance Measures
(1) (2) (3) (4)
Assetst −318025∗∗ −2007∗∗ −371012 −1043∗∗
(−4410911−203095) (−3120791−0067) (−4560991231099) (−2410621−0016)
log4Assetsb5×Assetst 41097∗∗ 0028∗∗ 48020∗∗ 0017∗∗
(26098159082) (0009141017) (29099158091) (0003129061)
Branchest −312000 −1079 −265030 2076
(−4420111377021) (−2410741500010) (−4150281521083) (−1660481411050)
log4Branchesb5×Branchest 73023 0075 58097 0002
(−970771134066) (−1590911140023) (−1340861286071) (−70079159097)
Efficiency ratio target −5080 4026
(−62007110020) (−46086122021)
LLR ratio target 1072 −0003
(−204516000) (−105811004)
MSA overlap 757089∗∗ 886086∗∗
(3350911933089) (6550641958027)
HHI violation fraction 933042 411092
(−420091943088) (−1690981757019)
Number of observations 1,269 1,269 765 765
Percent of inequalities (%) 39 78 38 81
Notes. This table presents estimates of the match value functionF 4b1 t5=Â′X
bt+Øbtusing maximum score estimation. Subsampling-based 95% confidence
intervals are in parentheses. Point estimates are generated by running the differential evolution optimization routine using R’s DEoptim package (Mullen et al. 2011). For differential evolution, we use 100 population members, scaling parameter 005, and we employ the classical differential evolution strategy (strategy=1). For point estimates, we run the optimization routine for 20 different starting points (seeds) and select the run that achieves the largest value of the objective function. For confidence intervals, we use the subsampling procedure described inPolitis and Romano(1992). We set the subsample size to be 500 (approximately 1/3 to 1/4 the total sample size) and randomly generate 100 replications of the routine to obtain confidence bounds. These specifications were also estimated with acquirer-specific efficiency ratio and LLR ratio, which are not reported here because they are unidentified. In separate Monte Carlo exercises, we show that the revealed preference method performs well on identified parameters (e.g., interaction terms and target-specific terms) when the value function also includes unidentified terms.
∗∗Indicates significance at the 5% level; i.e., 95% confidence interval does not contain 0.
assess the importance of efficiency and distress in merger value creation. Given existing work on agency and merger activity, this is a natural line of inquiry. Although merger value could depend on the target’s operational performance for efficiency reasons (e.g., see
Maksimovic and Phillips 2001), the performance
char-acteristics of targets could proxy for agency frictions in the acquirer and thus be related to merger value creation through that channel.
In Table3we report specifications for merger value that include these measures of performance, and across specifications, there is not a significant relationship between merger value and premerger target perfor-mance. Nonetheless, the qualitative findings of §5.1
remain true regarding assortative matching and overlap of markets. These matching and branching efficiency motives to merge appear to be robust, whereas perfor-mance measures do not appear to systematically affect merger value. Thus, it appears that the consolidation of banking institutions during our sample reflects the relaxation of regulation and efficiency motives (e.g., assortative matching and greater geographic overlap of markets).
5.3. The Role of Bank Regulation
We now use our model to quantify the implicit costs of bank chartering through frictions in the bank merger
market. To evaluate these implicit costs, we allow the merger value function to depend on a dummy variable,
same_charterbt, that equals one if the acquirer and target
have the same type of charter and thus are regulated by the same regulator. We also include an interaction between same_charterbt and overlapbt. The interactive
effect is reasonable if having different charters com-plicates dealings with multiple types of regulators, especially if the regulation impacts the cost efficien-cies realized in overlapping markets. Agarwal et al.
(2014) study a similar regulatory friction in the context of small state chartered banks that are audited on a rotational basis, finding there are costs to adjusting to different types of regulators.Agarwal et al.(2014) document costs of inconsistent regulators in the context of rotational regulation, suggesting in that context that window dressing for the regulator can be costly because it leads to artificial variability in operations. In the merger context, we evaluate whether there are implicit costs of having to adapt to a new regulatory regime that are reflected by the choices of the merging banks. Table4presents evidence on the role of bank charter type in determining merger value creation. When we include thesame_charterbt dummy variable, the
coeffi-cient estimate is large and positive but not statistically significant. The estimate implies an increase in merger
Table 4 Estimates of the Match Value Function Using Bank Chartering Information
(1) (2)
MSA overlap 934098∗∗ 878021∗∗
(7000211976072) (6610521957071)
Same charter 158045 37060
(−850411331096) (−2110711306030)
(Same charter)×(MSA overlap) 743028∗∗
(1170421901026)
Number of observations 1,484 1,484
Percent of inequalities (%) 75 75
Notes. This table presents estimates of the match value functionF 4b1 t5=Â′X
bt+Øbtusing maximum score estimation.
Subsampling-based 95% confidence intervals are in parentheses. As in Table5, the specifications in this table include (but do not report for the sake of brevity) own-effects and interactions for assets and branches as well as HHI violation fraction. Point estimates are generated by running the differential evolution optimization routine using R’s DEoptim package (Mullen et al. 2011). For differential evolution, we use 100 population members, scaling parameter 005, and we employ the classical differential evolution strategy (strategy=1). For point estimates, we run the optimization routine for 20 different starting points (seeds) and select the run that achieves the largest value of the objective function. For confidence intervals, we use the subsampling procedure described inPolitis and Romano
(1992). We set the subsample size to be 500 (approximately 1/3 to 1/4 the total sample size) and randomly generate 100 replications of the routine to obtain confidence bounds.
∗∗Indicates significance at the 5% level; i.e., 95% confidence interval does not contain 0.
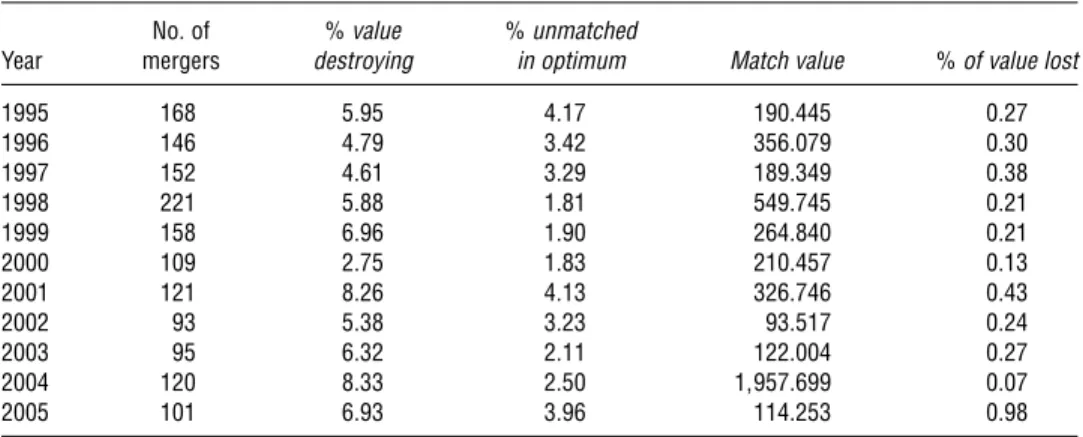
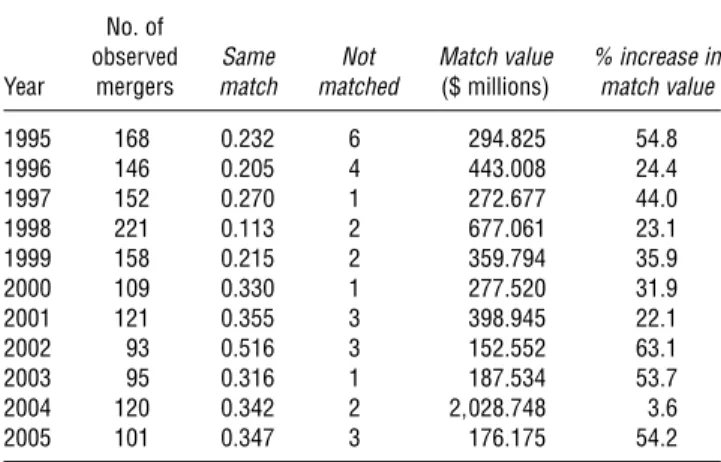
Table 5 Evaluating the Extent and Impact of Value-Destroying Mergers
No. of %value %unmatched
Year mergers destroying in optimum Match value %of value lost
1995 168 5095 4017 1900445 0027
1996 146 4079 3042 3560079 0030
1997 152 4061 3029 1890349 0038
1998 221 5088 1081 5490745 0021
1999 158 6096 1090 2640840 0021
2000 109 2075 1083 2100457 0013
2001 121 8026 4013 3260746 0043
2002 93 5038 3023 930517 0024
2003 95 6032 2011 1220004 0027
2004 120 8033 2050 119570699 0007
2005 101 6093 3096 1140253 0098
Notes. Match value measured in millions of dollars is the sum across mergers in that year of the estimated match value for merged acquirer-target pairs. %value destroyingis the fraction of mergers with negative merger value creation.% of value lostis the total (negative) merger value of these value-destroying mergers divided by the overall match value. Unmatched acquirers and targets occur in the solution to the linear programming problem if mergers involving these acquirers and targets would be value destroying under the recomputed optimal configuration of mergers.
match value of $158,450, on average, if the target and acquirer banks have the same charter. When we include the interaction of this dummy variable with the percent-age of overlapping markets, the coefficient is large and statistically significant. This finding suggests that the match between banking charters is more important for geographically overlapping banks. More concretely, for a target and acquirer whose MSA markets completely overlap, having the same charter increases match value by $743,000, and this increase is statistically significant. More generally, this finding suggests that a match between bank charters can contribute to the value of the merger by avoiding these regulatory frictions, especially because a bank has branches in more markets and thus greater overlap with potential targets.
5.4. Evidence on Merger Value Creation
The fitted values from our merger value function pro-vide merger-specific estimates for value creation from the perspective of the merging banks. Thus, subject to the caveat that our measure of merger value is from the perspective of the firm’s managers, this section takes our estimated merger value function to reflect underly-ing shareholder value.25As evidence on the degree to
which unmeasured characteristics (e.g., agency fric-tions) destroy merger value, Table5presents summary
25In addition, the online appendix presents an analysis of
acquirer-specific value, which nets out the transfer from the overall value created. The fraction of mergers that destroy acquirer-specific value is greater than discussed in the main text but is not strikingly greater (fraction of value destroying mergers rises to 6.93% instead of 6.02%).
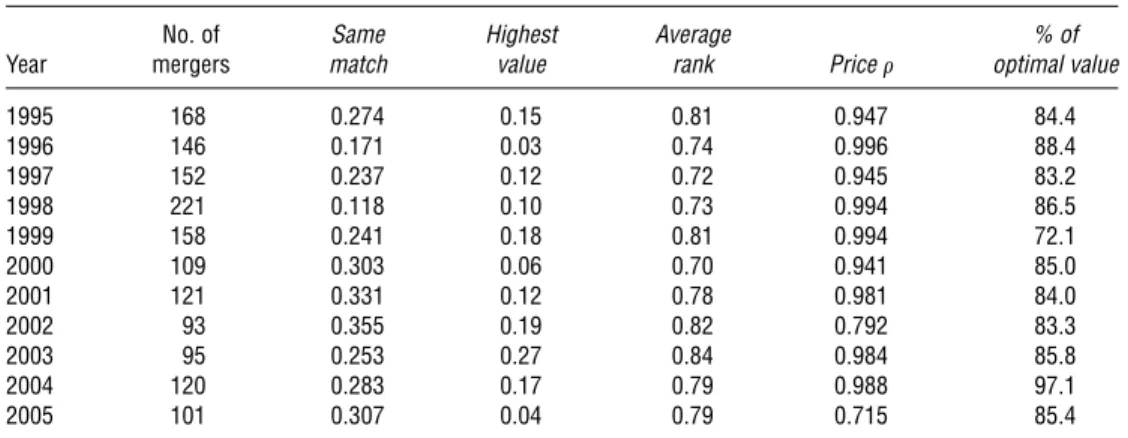
Table 6 Year-by-Year Measures of Fit
No. of Same Highest Average % of
Year mergers match value rank Price optimal value
1995 168 00274 0015 0081 00947 8404
1996 146 00171 0003 0074 00996 8804
1997 152 00237 0012 0072 00945 8302
1998 221 00118 0010 0073 00994 8605
1999 158 00241 0018 0081 00994 7201
2000 109 00303 0006 0070 00941 8500
2001 121 00331 0012 0078 00981 8400
2002 93 00355 0019 0082 00792 8303
2003 95 00253 0027 0084 00984 8508
2004 120 00283 0017 0079 00988 9701
2005 101 00307 0004 0079 00715 8504
Notes.Same matchis the fraction of acquirers that are matched to the same target in the optimal pattern of mergers,
highest valueis the fraction of acquirers whose realized target produces the highest match value of any possible target,
priceis the correlation between the equilibrium transfers and the transfers implied by the equilibrium solution.Highest valueequals the fraction of matches where the observed match had the highest estimated match value for the acquirer among all counterfactual mergers, andaverage rankequals the average percentile of match value for the observed match relative to all counterfactual matches.% of optimal valueis the percentage of merger value that the observed mergers create relative to the merger value created in the solution to the linear programming problem.
statistics on the fraction of mergers that we compute to have negative merger value. On average, only 6.02% of mergers in a given year yield negative match value, and in every year of the sample, the lost value from these mergers is less than 1% of overall merger value creation. These estimates indirectly yield insight into scope for value-reducing agency problems in the merger market. For example, if a merger appears to reduce value accord-ing to our measure—accountaccord-ing for cost efficiencies, market power, or network-enhancing benefits—this could indicate a manager-shareholder agency problem (e.g., seeHarford et al. 2012).
Our revealed preference estimate of merger synergies may either overstate or understate the true fraction of value of synergies. On one hand, this measure could overlook some value-destroying mergers in which the transfer appears less costly to the merging firms because of significant overlap in ownership of acquirer and target (Matvos and Ostrovsky 2010).26On the other
hand, our specification for merger value creation may not capture some types of merger-specific synergies. To the extent these synergies are unmeasured and enhance the profitability of mergers that look unprofitable according to our measures, our revealed preference method will tend to understate the frequency of value-destroying mergers because it will classify some of these mergers as negative value when they create value for unmeasured reasons. The fact that these estimates of value destruction in mergers are close to
26Despite this being an important consideration, there is less concern
arising from potential cross-ownership for mergers that involve private banks (the typical case) because these kinds of mergers have less cross-ownership. The number of merger observation drops by 22% (411484−111585/11484) when requiring the acquirer to be publicly traded. Targets are even more likely to be privately held, with about half of the sample of targets being private.
recent estimates using stock market evidence provides additional confidence in the validity of these estimates (Bayazitova et al. 2012).
6.
Robustness and Extensions
6.1. In-Sample Performance of Merger Value Function
Our framework allows us to compute a number of measures that allow us to evaluate the in-sample performance of the revealed preference method. To evaluate our revealed preference model, we benchmark against the optimal computed match as we did in evaluating the extent of merger value creation in the bank merger sample. We compute five measures of fit for our merger value function: (i) the fraction of mergers for which the realized match has the highest computed match value (highest value), (ii) the fraction of mergers for which the realized match is the same as the optimal pattern of mergers (same match), (iii) the average percentile rank of the observed matched target in the rank-order list of acquirers (average rank), (iv) the correlation coefficient between the actual deal values and the equilibrium transfers computed from the linear programming problem described inShapley and Shubik
(1971) (price), (v) the fraction of realized merger value relative to the merger value created in the solution to the linear programming problem (% of optimal value). Greater values for each of these measures implies better performance of the estimated merger value function in sample.27
For each year in our sample, Table6summarizes these measures of performance. Same matchranges
27In the online appendix, we describe how to implement these linear
programming measures in greater detail.