UTTAC-86, 2017
UTTAC
ANNUAL REPORT 2016
TANDEM ACCELERATOR COMPLEX
Research Facility Center for Science and Technology
University of Tsukuba
UTTAC
ANNUAL REPORT 2016
April 1, 2016 – March 31, 2017
Editors : Tetsuaki Moriguchi, Kimikazu Sasa,Yoshihiro Yamato, Masumi Matsumura, Masao Sataka, Hiroshi Naramoto, and Hiroshi Kudo
UTTAC ANNUAL REPORT is a series of issues, which include annual reports of Tandem Accelerator Complex, Research Facility Center
for Science and Technology, University of Tsukuba.
Copyright © 2016 by Tandem Accelerator Complex, Research Facility Center for Science and Technology, University of Tsukuba and individual contributors.
All reports are written on authors’ responsibility and thus the editors are not liable for the contents of the report.
Tandem Accelerator Complex, Research Facility Center for Science and Technology, University of Tsukuba
Tennodai 1-1-1, Tsukuba, Ibaraki 305-8577, Japan
PREFACE
This annual report covers researches carried out at University of Tsukuba Tandem
Accelerator Complex (UTTAC) during the fiscal year 2016 (1 April 2016
∼
31 March
2017). The topics include not only accelerator-based researches using the 6MV Pelletron,
1 MV Tandetron, and 1MV Cockcroft-Walton accelerators, but also radioisotope-based
researches including positron annihilation spectroscopy and
Mössbauerspectroscopy.
September 30, 2017
Editors
-Long and dark years finally ended!
Construction of a new horizontal-type 6 MV Pelletron tandem accelerator was started immediately after the previous accelerator was lost suddenly by the 2011 earthquake. It was completed in 2014, however, it took two more years for legal procedures and the setup of experimental apparatus. Indeed, the experimental use of the accelerator was started in March 2016. The long and dark five years finally ended. Photos below were taken at the opening ceremony and the celebration party, 1 July 2016.
-CONTENTS
1. ACCELERATOR AND RELATED FACILITIES
1.1 Accelerator operation 2016 ··· 1 1.2 Development of the Lamb-shift polarized ion source··· 3 1.3 Development of an ion microbeam scanning system in the 6 MV tandem accelerator
facility··· 5 1.4 Characteristics of irradiation-test chamber for semiconductor devices devices···
7 1.5 Approach to possible maximum energies of high Z ions accelerated by the 6 MV tandem
accelerator··· 9
2. NUCLEAR AND ATOMIC PHYSICS
2.1 Production of unstable nuclei by proton-capture reactions with a Si target··· 11 2.2 The qualification test of sulfur targets for intense beam irradiation ··· 12 2.3 Test experiment for the isotope analysis of sulfuric acids generated in atmospheric air by
proton irradiation ··· 14
3. ACCELERATOR MASS SPECTROMETRY
3.1 Operation of the Tsukuba 6 MV multi-nuclide AMS system for the year 2016··· 16 3.2 36Cl AMS measurements with the 6 MV tandem accelerator··· 18 3.3 36Cl/Cl and 36Cl inventory in surface soils near the Fukushima Dai-ichi Nuclear Power
Plant ··· 20 3.4 Determination of I-129 in radioactive particles by AMS ··· 22 3.5 Preparation of a 129I standard solution for ICP-MS/MS ··· 24 3.6 Performance evaluation of the AMS-measurement of iodine-129 by the 6 MV tandem
accelerator at University of Tsukuba ··· 25 3.7 Reconstruction of temporal variation for anthropogenic radionuclides
in the Japan Sea using a coral core sample ··· 27 3.8 Radiocarbon variations since 1960 in tree rings near the Tokai nuclear facilities in
Japan··· 28 3.9 Trial of determination of 41Ca concentration in iron meteorites by accelerator mass
spectrometry··· 30
4. BEAM AND ISOTOPE APPLICATIONS
4.1 Probing the effect of point defects on the leakage blocking capability of Al0.1Ga0.9N/Si structures using a monoenergetic positron beam ··· 32
-4.2 Study of cathode shape effect on the reliability of ΔE-E telescope ERDA··· 34
4.3 Trial production of preamplifier for multi-channel SSD··· 36
4.4 Micro-PIXE analyses of pyrite in sea-floor sediments··· 38
4.5 Mössbauer effect of CuFe2O4 spinel fine particles under external magnetic field··· 41
4.6 Low temperature Mössbauer study on spherical α”-Fe16N2 core–shell nanoparticles with high magnetic anisotropy··· 43
4.7 Characterization of oxide thin films with RBS technique··· 45
4.8 Low temperature synthesis of highly oriented Si1-xGex (x: 0–1) on an insulator by Al-induced layer exchange··· 47
4.9 Quantitative analysis of light elements in mixed-anion compound thin films··· 49
4.10 Oxygen reduction reaction catalytic site analysis by Mössbauer spectroscopy··· 51
4.11 Sputtering loss of Zn nanoparticles in SiO2 induced by MeV C60+ ion irradiation··· 52
4.12 HR-RBS study of the rutile TiO2(110) surface··· 54
4.13 Profiling of hydrogen in thick films employing transmission ERDA technique··· 55
4.14 Heterogeneous carboxy group distribution across a polyamide active layer of a ESPA2 thin-film composite reverse osmosis membrane··· 57
4.15 Relationship between the abrasion of DLC coated layer and its hydrogen content··· 59
4.16 Measurement of hydrogen content in DLC films··· 61
5. BEAM IRRADIATION EFFECT
5.1 Tolerance evaluation on single event of COTS-GNSS receivers··· 635.2 Preliminary evaluation of single event testing for regular use of the 6 MV tandem accelerator at University of Tsukuba··· 64
5.3 Effect of helium irradiation on tritium permeability of erbium oxide··· 66
6. LIST OF PUBLICATIONS AND PRESENTATIONS
6.1 Journals ··· 676.2 Reviews and books··· 72
6.3 Proceedings··· 72
6.4 Poster or oral presentations at academic meetings··· 72
6.5 UTTAC seminars··· 79
6.6 Symposium··· 80
7. THESES ··· 83
8. LIST OF PERSONNEL··· 84
-1.
1.1
Accelerator operation 2016
K. Sasa, S. Ishii, H. Oshima, Y. Tajima, T. Takahashi, Y. Yamato, D. Sekiba, T. Moriguchi, A. Uedono
In the fiscal year (FY) 2016, we operated and maintained the 1 MV Tandetron accelerator, the 6 MV
Pelletron tandem accelerator, and the apparatus utilizing radio-isotopes. The total service time of UTTAC
in this FY was 174 days (4,176 hours).
1 MV Tandetron accelerator
The 1 MV Tandetron accelerator has two types of negative ion sources and four beam lines. In FY 2016,
the operating time and the experimental beam time of the Tandetron were 594.3 and 262.1 hours,
respectively. The Tandetron had 73 working days for beam experiments. Totally, 66 research programs
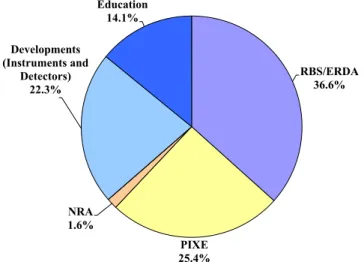
were carried out and 538 researchers used the Tandetron. Figure 1 shows the percentage of accelerated
ions. Figure 2 shows the percentage of research fields for the Tandetron.
6 MV Pelletron tandem accelerator
For the 6 MV Pelletron tandem accelerator, routine beam delivery and experiments were started on
March 1 2016 [2]. We had no trouble in operating the accelerator until just before the end of 2016. At the
end of 2016, however, a malfunction occurred in the foil changer which replaces carbon stripper-foils at
the accelerator terminal. After urgent repair of the foil changer, the accelerator was back into good
condition on January 2017.
In FY 2016, the operating time and the experimental beam time of the Pelletron were 1867 and 1496.4
hours, respectively. The Pelletron had 154 working days for beam experiments. Totally, 95 research
programs were carried out and 614 researchers used the Pelletron. Figure 3 shows the beam time
Fig. 1. Percentage of accelerated ions for the 1 MV Tandetron accelerator in FY 2016.
Fig. 2. Percentage of research fields for the 1 MV Tandetron accelerator in FY 2016.
H
30.4%
He
42.7%
C
27.0%
RBS/ERDA 36.6%
PIXE 25.4% NRA
1.6% Developments (Instruments and
Detectors) 22.3%
Education 14.1%
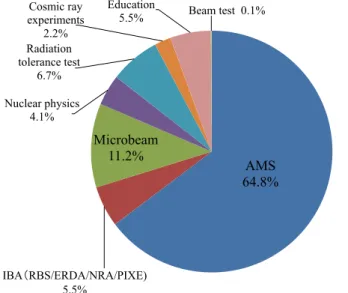
histogram with respect to the terminal voltage. Figures 4 and 5 show the percentages of accelerated ions
and of research fields, respectively, for the Pelletron. The operating time with the maximum terminal
voltage of 6 MV occupied 37% of all the beam time. Two thirds of the beam time was used for AMS
studies. In AMS, radionuclides of 14C, 36Cl, 41Ca and 129I were accelerated during most of the operating
hours.
References
[1] K. Sasa et al., Nucl. Instr. Meth. B 361 (2015) 124.
[2] K. Sasa et al., UTTAC Annual Report 2015, UTTAC-85 (2016) 1.
Fig. 4. Percentage of accelerated ions for the 6 MV Pelletron tandem accelerator in FY 2016.
Fig. 5. Percentage of research fields for the 6 MV Pelletron tandem accelerator in FY 2016.
Fig. 3. Beam time histogram as a function of the terminal voltage for the 6 MV Pelletron tandem accelerator in FY 2016.
0 100 200 300 400 500 600 1 2 3 4 5 6
Beam Time (hours)
T er m in al V o lt ag e ( M V ) H 15.5% He 5.9% Be 1.2% B 0.3% C 16.1% N 1.8% O 1.2% F 0.1% Al 2.1% Si 1.3% Cl 21.2% Ca 8.6% Ni 1.0% Br 0.2% Ag 0.2% I 22.8% Au 0.5% AMS 64.8%
IBA(RBS/ERDA/NRA/PIXE)
5.5% Microbeam 11.2% Nuclear physics 4.1% Radiation tolerance test 6.7% Cosmic ray experiments 2.2% Education
5.5% Beam test 0.1%
1.2
Development of the Lamb-shift polarized ion source
T. Moriguchi, Y. Yamato, A. Ozawa, S. Suzuki, M. Amano, D. Kamioka
The reconstruction of the Lamb-shift polarized ion source (PIS), which was damaged seriously by the Great East Japan Earthquake, was mostly finished [1]. We therefore began to generate polarized beams. A spin filter (SF), which is one of the devices constituting PIS, is of significance for the nuclear polarization [2]. SF was designed to provide (1) a uniform magnetic field parallel to the beam axis, (2) a 1610 MHz radio-frequency (RF) electric field parallel to the beam, and (3) a static electric field perpendicular to the beam. In order to produce the polarized beam, it is necessary to adjust these parameters of SF properly. In this fiscal year, we tuned the magnetic field and the RF electric field of SF, and tried to generate polarized proton and deuteron beams.
Firstly, we measured the magnetic field parallel to the beam axis against electric current supplied for the electromagnet. Prior to the measurements, a Hall probe (DTM-151, Group3 Technology Ltd.) mounted on an axial holder was installed into the center of the beam axis inside SF after removing an argon gas chamber, which are located just downstream of SF. Figure 1 shows the results. The finite magnetic field seen at 0 A is induced by other coils for the correction of the fringing field. Except for this external field, the good linearity between the magnetic field and electric current is confirmed.
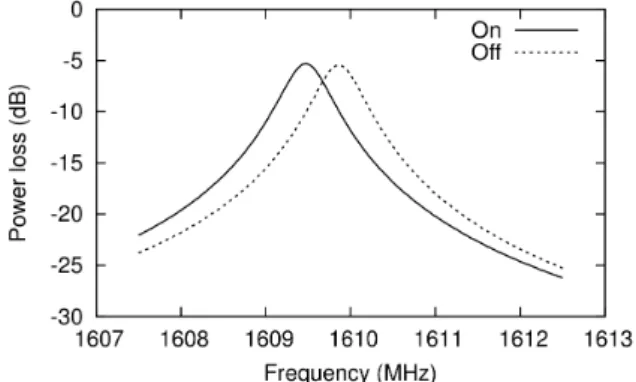
Next, we measured oscillation frequency for the RF electric field and a resonance frequency of SF. The oscillation frequency was measured using the spectrum analyzer (MS2721B, Anritsu) which was connected between the output of the power supply and the input of the RF electric field of SF. The oscillation frequency thus obtained is 1610 MHz, as is expected. The resonance frequency of SF was measured by a network analyzer (8753ET, Agilent). For stabilization of SF, the power supply was turned on 25 hours before this measurement. In order to investigate the shift of the resonance frequency due to change in the temperature of SF, we measured again in two hours after the power supply was turned off. The results are shown in Fig. 2. The resonance frequency of SF was 1609.475 MHz which is shifted from the oscillation frequency of 1610 MHz. After the power supply was turned off, the resonance frequency was shifted towards the oscillation frequency, possibly by self-cooling of SF.
Then, we performed a test for generating the polarized beam. In order to prevent the shift of the resonance frequency, two large-sized air fans were used to cool SF. The beam current was measured by the Faraday cup (FC-PIS) located downstream of PIS. Figure 3 shows the measured beam current as a function of the magnetic field of SF. Actually, the negative current was measured because negatively charged proton or deuteron were extracted from PIS. For proton, we found two resonance peaks around 540 and 605 G, which correspond to the nuclear spin magnetic quantum number mI = +1/2 and −1/2,
respectively. The polarization of mI = +1/2 peak was about 80% by using a quenching method. For
deuteron, we found three resonance peaks around 565, 575 and 585 G, which correspond to mI = +1, 0 and −1, respectively. These resonance peaks for proton and deuteron were not observed without cooling of SF.
For generation of the polarized beam from PIS, it is important to control the temperature of SF so as to adjust the resonance frequency of SF to the oscillation frequency of the power supply. As the next step, we
will improve the cooling system of SF and measure the polarization at the end of the experimental beam course by using a polarimeter via a nuclear reaction.
We acknowledge the technical support of Drs. Y. Tagishi and M. Tomizawa. We would like to thank NIHON KOSHUHA Co., Ltd. staff for measurements of the oscillation and resonance frequencies.
References
[1] T. Moriguchi et al., UTTAC Annual Report 2014 (2015) 7. [2] Y. Tagishi et al., Nucl. Instr. Meth. 164 (1979) 411.
Fig. 1. Magnetic field of SF as a function of current from the power supply.
Fig. 2. Power loss of the RF electric field as a function of frequency. On and Off indicate “before” and “after” the power supply is turned off, respectively (see the text).
Fig. 3. Beam current measured by the Faraday cup (FC-PIS) as a function of the magnetic field.
1.3
Development of an ion microbeam scanning system in the 6 MV
tan-dem accelerator facility
A. Yamazaki, K. Sasa, S. Ishii, M. Kurosawa, S. Tomita, H. Naramoto, M. Sataka, H. Kudo, A. Uedono
Light trace elements in structural materials sensitively affect materials’ properties. Many researchers
have paid much attention to microstructural analysis of the relevant elements. Ion beam can provide
various elemental analyses in materials. Combining ion beam focusing and scanning techniques, we can
obtain spatial distribution of elements.
The ion microbeam system has been constructed in 2016 at UTTAC [1]. Schematic view of the ion
microbeam line is shown in Fig. 1. This system will be mainly used for analysis of light elements in
structural materials, based on various interaction processes of incident ions with the elements.
Fig. 1. Schematic view of the ion microbeam line of the 6 MV tandem accelerator facility (lengh is indicated in mm). A new large target chamber is shown at the end of the microbeam line.
Particle induced X-ray emission (PIXE) has been widely used for analysis of trace elements. For
X-ray measurements, a silicon drift detector (SDD) with a thin front window has been installed, and a
superconducting tunnel junction (STJ) array detector [2, 3] will be installed for sensitive PIXE analyses
of light elements.
Analysis of hydrogen in materials is of both academic and practical importance because hydrogen
plays an important role for determining the mechanical properties of materials. The PIXE method is not
applicable to hydrogen analysis because of no characteristic X-ray emission from hydrogen. Hydrogen
can be detected using ion beams by applying nuclear reaction analysis (NRA) or elastic recoil detection
analysis (ERDA). To support these techniques, a large target chamber has been installed. This is designed
for multi-purpose analysis; to utilize not only SDD and STJ detector but also a BGO detector for NRA.
Furthermore, a silicon surface barrier detector was set up for elastic recoil detection analysis (ERDA) .
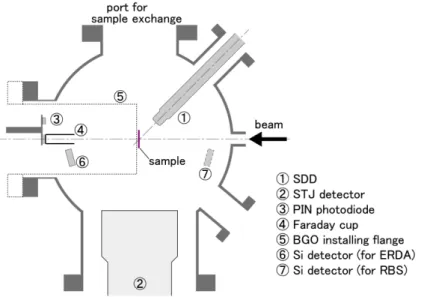
Figure 2 shows a top view of the new chamber. It is 240 mm in inner diameter and 228 mm in height.
The SDD and STJ detector are placed at 135◦and at
−90◦relative to the beam direction, respectively. A
PIN photodiode which is used for estimating the diameter of a focused ion beam by scattering transmission
ion microscopy (STIM) is installed at 0◦port with a Faraday cup. BGO detector for NRA can be installed
at the same port in replace of the photodiode and Faraday cup assembly. Silicon surface barrier detectors
for ERDA and RBS can also be installed in the chamber.
Fig. 2. Top view of the new target chamber and arrangement of the detectors.
Samples are fixed on the three-dimensional positioning stage. The horizontal and vertical positioning
ranges are 15 mm and 50 mm, respectively. It can also move along the beam axis within 10 mm to set the
surface of the sample at the center of the chamber. A digital microscope is fixed on the chamber to view
the sample normally through a mirror which is positioned on the beam axis and is held obliquely at 45◦.
Ion beam transport and focusing were carried out mainly with 6 MeV protons. Figure 3 shows an
example of STIM images of a copper fine grid (1000 lines per inch, 6µm grid width) which was obtained
by scanning of focused protons. The estimated beam diameter is 2µm.
Fig. 3. STIM image of the copper fine grid (1000 lines per inch) using a 6 MeV proton beam.
References
[1] A. Yamazaki et al., Nucl. Instrum. Methods B 404 (2017) 92.
[2] M. Ukibe et al., X-ray Spectrom. 40 (2011) 297.
[3] S. Shiki et al., J. Low Temp. Phys. 167 (2012) 748.
1.4
Characteristics of irradiation-test chamber for semiconductor devices
M. Sataka, K. Sasa, H. Naramoto, H. Kudo
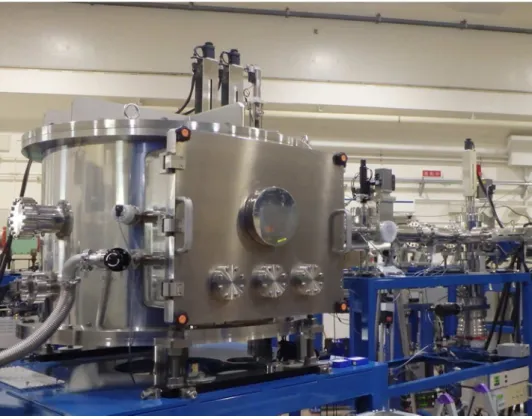
Single-event phenomena in microelectronics devices are caused in the space environment by high energy particles which impinge on the sensitive regions of the devices [1,2]. In recent years, there has been increasing attention in the possible use of commercial electronic devices for space applications. It is also noted that even on the ground the microelectronic devices are susceptible from secondary cosmic rays that are induced by primary neutrons, and from alpha emitters such as U and Th contaminants within chip packaging materials.
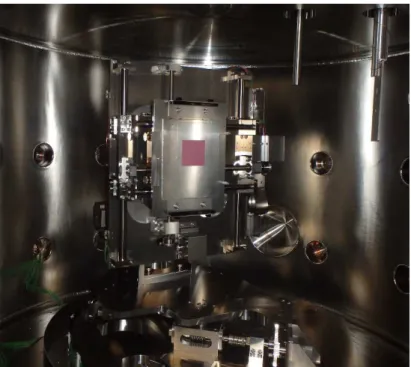
The new irradiation-test chamber dedicated for semiconductor devices was installed in a beam course of the 6 MeV tandem accelerator at UTTAC in 2015. This chamber consists of main and sub chambers which are differentially evacuated by two turbo molecular pumps. The base pressures are 2×10⁻⁵ Pa and 1×10⁻⁶ Pa, respectively. The overview of the irradiation-test chamber is shown in Fig. 1. On the upstream side, installed is the beam handling sub chamber containing slits, aperture, foils, and a Faraday cup. The main chamber is about 1000 mm in diameter and about 750 mm in height. In the beam shutter system, two linear motion feedthroughs and the target stage are built together. The liner motion feedthrough covers a distance of 150mm with the resolution of 0.01mm. The target stage, on which a sample holder up to so called A5 size (140mm×210mm) can be mounted, enables four different movements (two independent translations and two independent rotations). These are controlled by the driver-handling system implemented in the LabVIEW environment.
Fig. 1. Overall view of the irradiation-test chamber for semiconductor devices.
The details of sample setting are shown in Fig. 2. The specification of target stage is summarized in Table 1. This test chamber will be also useful for various kind of ion irradiation on materials since the basic mechanisms required for the controlled irradiation experiments are already built in this chamber. We have also introduced an ion beam scanning system for uniform irradiation with various intensity levels from faint to intense ion beam.
Table 1. Specification of the goniometer system for target stage control.
x-travel ±74 mm y-travel ±105mm
θ-rotation +30 ~ −90 degree ϕ-rotation ±90 degree
References
[1] M. Komatsu et al., this annual report 5.1 (2017). [2] A. Maru et al., this annual report 5.2 (2017).
Fig. 2. Inside view of the main chamber, showing the target stage and the goniometer system.
1.5
Approach to possible maximum energies of high
Z
ions accelerated by
the 6 MV tandem accelerator
M. Sataka, K. Sasa, H. Naramoto, T. Takahashi, H. Kudo
A tandem-type accelerator can provide many kinds of ion species with wide energy ranges, compared with a single-stage electrostatic accelerator. Because of such wide variety of ion beams, tandem accelerators have been used for comprehensive studies of electronic excitation processes in materials. Furthermore, tandem accelerators allow irradiation-tolerance tests under wide experimental parameters of electronic devices to be operated in space. At the present stage of the irradiation-test experiments at UTTAC, we need a systematic data base concerning the maximum energies of high Z elements which are obtained from the 6 MV tandem accelerator.
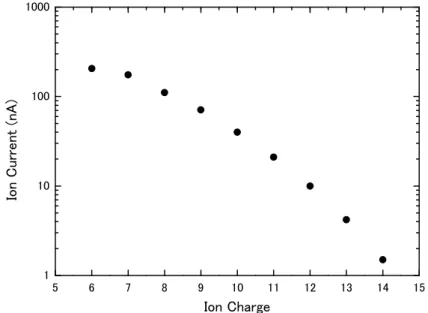
We have measured the beam current distribution of accelerated ions as a function of ion charge, employing Ar gas as the charge stripper. Figure 1 shows the beam current distribution of iodine ions at the terminal voltage of 6 MV. The beam current is maximal at the ion charge of 6, and it decreases drastically as the ion charge increases. In a critical use of the 6 MV tandem accelerator, an I14+ beam of the highest energy 90 MeV is available1. Similar data were obtained for He, O, F, Si, Cl, Ni, Br, Ag, and Au.
o
n
ur
r
ent
n
on harge
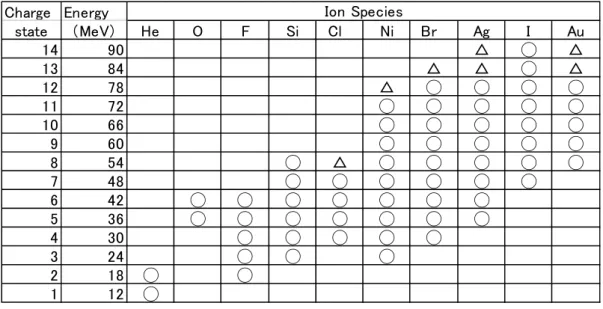
Table 1 summarizes the availability of tested ion species. In this table, ion charge, ion energy and ion current range are listed. There appear some uncertainties in the data for acceleration of highly charged ions of Br, Ag and Au. This is mainly due to electron loading, however it can be fixed after some improvement. Similar data base for B and C will be complemented soon, and the tests for medium heavy ions such as Cl, Ni, and Br will be easily performed using a foil stripper at the high voltage terminal of the accelerator.
1 Calculated as (14+1)×6=90 (MeV).
Fig. 1. Beam current distribution of iodine ions accelerated by the 6 MV tandem accelerator at the terminal voltage of 6 MV.
Table 1. Availability of the ion species at the terminal voltage of 6 MV:
○
:≥1nA, △: ≤1nA.h arge n e rgy
state e V e Si l i r g u
△ ◯ △
△ △ ◯ △
△ ◯ ◯ ◯ ◯
◯ ◯ ◯ ◯ ◯
◯ ◯ ◯ ◯ ◯
◯ ◯ ◯ ◯ ◯
◯ △ ◯ ◯ ◯ ◯ ◯
◯ ◯ ◯ ◯ ◯ ◯
◯ ◯ ◯ ◯ ◯ ◯ ◯
◯ ◯ ◯ ◯ ◯ ◯ ◯
◯ ◯ ◯ ◯ ◯
◯ ◯ ◯
◯ ◯
◯
o n Spe c ie s
2.
2.1
Production of unstable nuclei by proton-capture reactions with a Si
target
A. Ozawa, T. Moriguchi, M. Amano, D. Kamioka, S. Suzuki
We are attempting to produce polarized unstable nuclei by proton-capture reactions with polarized proton beams in the aim of measuring nuclear moments of unstable nuclei. Up to now we have tried to produce unstable nuclei by proton-capture reactions using Mg and Si targets in 1 MV Tandetron [1]. From the γ ray measurement with the Ge detector, it was confirmed that unstable nuclei 25Al (T1/2 = 7.1 s) and 30P (T1/2 = 150 s) could be produced for each target [1]. In FY2016, we shifted to 6MV tandem accelerator, which began to operate in March 2016, and started an experiment there.
In FY2016 we performed an experiment using a non-polarized proton beam. The proton beam accelerated to 3 MeV by a 6 MV tandem accelerator was irradiated on a 0.5 mm thick Si target placed in a chamber located in the A6 course. The proton beam induces the proton-capture reactions including resonant reactions until it stops in the Si target. Natural Si has three stable isotopes (28Si: 92.2%, 29Si: 4.7%, 30Si: 3.1%). Among 29P, 30P, and 31P, that can be produced by the proton-capture reactions in the Si target, 29P (T1/2 = 4.1 s) and 30P are unstable nuclei with β decays. In order to measure β rays associated with the β decays, two plastic scintillators were located on top of the target (plastic thicknesses 1 mm and 2 mm, respectively). We identified the coincidence signals of the two scintillators as the βrays. Figure 1 shows the time spectrum of β rays observed after irradiation of the proton beam (its intensity about 50 nA) for 100 seconds. Fast and slow components of the β decay were observed. The fitting results assuming half-lives of 29P and 30P are shown by a solid line in Fig. 1. The β ray amounts of 29P and 30P evaluated from the fitting results were ∼0.12 cps/nA and ∼0.30 cps/nA, respectively. In the future, we will use the polarized proton beam to measure the nuclear polarization of the produced unstable nuclei (29P, 30P and so on), and furthermore perform experiments with the target containing Mg to evaluate the production amount of 25Al and its nuclear polarization. If significant nuclear polarization is observed, nuclear moment measurements for 30P and 25A1 will be carried out.
Reference
[1] T. Matsumoto et al., UTTAC Annual Report 2015 (2016) 11. Fig. 1 Time spectrum of β rays in 3 MeV proton
beam with a Si target. The solid line is the fitting result assuming half-life of 29P and 30P.
2.2
The qualification test of sulfur targets for intense beam irradiation
S. Kimura, A. Ozawa, T. Moriguchi, H. Miyatake1, Y. Hirayama1, Y.X. Watanabe1, M. Mukai, M. Oyaizu1
Nuclear masses in the vicinity of the N =Z line are crucial to determine the rapid-proton capture
process (r p-process) pathway, which drives an explosive astronomical phenomenon called type I X-ray
burst. Unfortunately, the masses of key nuclei in the r p-process have not been measured experimentally
yet with the required precision, in particular the mass evaluation of66Se has been highly desired.
The mass measurement of 66Se by using the SHE-mass facility, which consists of a multireflection
time-of-flight mass spectrograph [1] coupled with a gas-filled recoil ion separator GARIS-II [2] has been
planned. In order to produce66Se, a fusion-evaporation reaction32S(36Ar ,2n)
66Se will be employed. A
production cross-section of66Se via this reaction is estimated to be∼70 nb, therefore sulfur targets that
are applicable to intense36Ar beam irradiation are required. The MoS2targets prepared by a spray coating
technique [3] on Ti backing foils are adopted as the sulfur targets. MoS2has large sulfur composition ratio
and is chemically stable, but its stability to intense beam irradiation is still unclear. Thus there is a need to
confirm an irradiation tolerance of the MoS2targets.
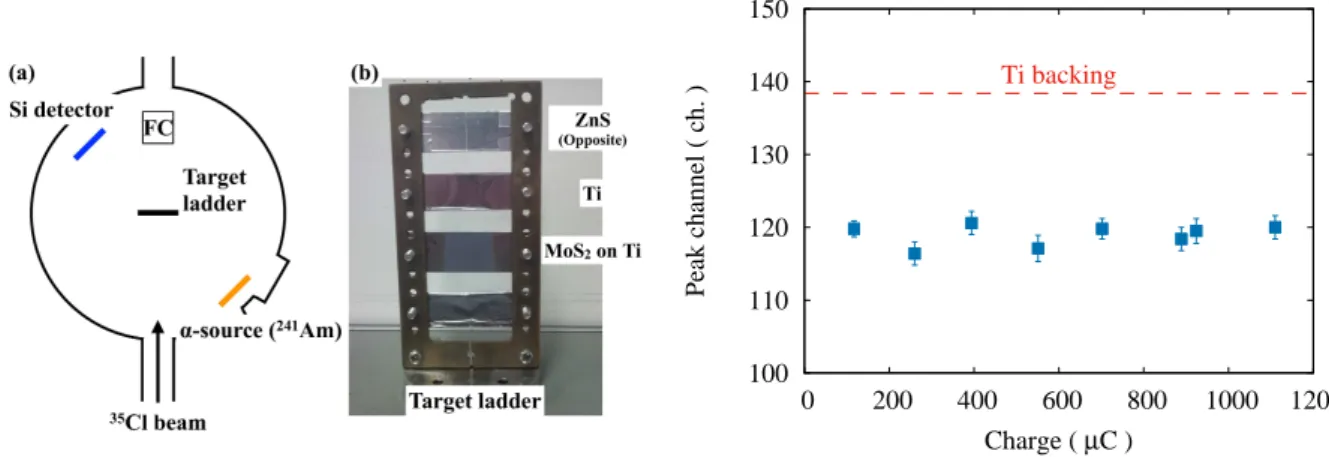
A 40.6 MeV 35Cl6+ beam, with average intensity of 20 pnA, was provided by the 6 MV tandem
electrostatic accelerator at University of Tsukuba. The experimental setup in the scattering chamber of A7
course is shown in Fig. 1. A MonatS
2 target on 3µm Ti backing foil was mounted on a target ladder. A
target thickness was 0.8 mg/cm2. A Si detector and an241Amα-source were installed diagonally across
the target ladder.
Measurements were performed by repeating the following procedure: irradiation of the35Cl6+beam
is carried out in a certain period of time and, subsequently, the thickness of MonatS2target is measured via
an energy spectrum ofα-particles fed from the241Am source. Figure 2 shows the measured peak energy
Fig. 1. (a) Schematic view of the experimental setup. (b) Photograph of the target ladder.
100 110 120 130 140 150
0 200 400 600 800 1000 1200
Ti backing
Peak channel ( ch. )
Charge ( µC )
Fig. 2. Peak energy shift of the α-particles.
Red dashed line shows the peak position of the
α-particles passed only through the Ti backing
foil.
1Wako Nuclear Science Center (WNSC), Institute of Particle and Nuclear Study (IPNS), High Energy Accelerator
Organiza-tion (KEK), Wako 351-0198, Japan
shift of theα-particle which passed through the MonatS2 target. In Fig. 2, no significant peak shift is
observed for the beam irradiation up to∼1200µC; it indicates that the beam irradiation does not affect
the stability of the MonatS2target. Total measurement time was calculated to be 3 hr and a 30 cm diameter
rotating target wheel [4] will be used in the SHE-mass facility. The present test corresponds to a 28 hr
irradiation with 1 pµA beam.
Thus we confirmed that there is no problem in the stability of MoS2 targets under the intense beam
irradiation.
References
[1] P. Schury et al., Nucl. Instr. Meth. Phys. Res. B 335 (2014) 39.
[2] D. Kaji et al., Nucl. Instr. Meth. Phys. Res. B 317 (2013) 311.
[3] J. P. Greene and C. J. Lister, Nucl. Instr. Meth. Phys. Res. A 480 (2002) 79.
[4] D. Kaji and K. Morimoto, Nucl. Instr. Meth. Phys. Res. A 792 (2015) 11.
2.3
Test experiment for the isotope analysis of sulfuric acids generated in
atmospheric air by proton irradiation
Y. Nakai1, Y. Shiina, N. Yamamoto, K. Sasa, S. Tomita
Gas-phase particle formation following irradiation of ionizing particles is one of major processes in a
gas involving chemical species, such as water, sulfuric acid, volatile organic compound, which can be
condensed depending on atmospheric pressure and temperature. Especially, it has been known that sulfuric
acid enhances generation of small droplets by ionizing radiation [1, 2]. In this case, sulfuric acid is
considered to be formed mainly through an oxidation of SO2. However, the detailed mechanism of SO2
oxidation by irradiation of ionizing particles has not been identified yet although some indications have
been proposed [3].
To investigate the mechanism of SO2 oxidation, Ishino et al. [4] performed isotope analysis of oxygen
and sulfur in sulfuric acid and sulfate mainly contained in nano-droplets generated in humidified gases
irradiated with a 1.8 MeV proton beam. Measured ∆17O values were roughly consistent with the
mechanism for SO2 oxidation suggested in previous studies [3, 5]. On the other hand, the values of ∆34S in
this study are quite different from those of already-known major reactions for atmospheric sulfate
production [3, 6]. This discrepancy has not been resolved yet. One of possible reasons is that the protons
lost all the kinetic energies and were fully stopped in the target gases. Just before being stopped in the gas,
the electronic stopping power for the protons is increased. Thus, high ion density and different proportion
of excited products might induce more complex chemical reactions.
We plan to perform oxygen and sulfur isotope analysis of sulfuric acid (and sulfate) produced in
irradiation of a 12 MeV proton beam using 6 MV Pelletron tandem accelerator at UTTAC. Since 12 MeV
protons have the range of 1.57 m inthe atmosphere of 1 atm, use of an irradiation chamber of 25 cm in
length allows us to avoid complexity caused by the stopping of the beam within the gas. As the first step in
this year, we performed measurements of SO2 consumptions as functions of an SO2 mixing ratio and a
beam current to find suitable experimental conditions for isotope analysis of sulfuric acid. Figure 1 shows
the setup for the test experiment, which consists of a humidified sample-gas generator, an irradiation
chamber, a monitor of the sample gas pressure, and a monitor of the SO2 concentration. A wet air was
generated by bubbling pure air in ultra-pure water. The sample gas was produced by mixing the wet air
with a dry air of the same purity. The total flow rate of the sample gas was maintained at 2 SLM (Standard
Liters per Minute) using mass flow controllers. A part of gas flow downstream of the irradiation chamber
was introduced to the SO2 concentration meter.
In this test experiment, we found that the SO2 consumptions increase with not only higher SO2 mixing
ratio, but also higher beam current. For high beam current, the SO2 consumptions are saturated and the
saturation beam current becomes higher for higher SO2 mixing ratio.
1
RIKEN Nishina Center
References
[1] J. H. Seinfeld and S. N. Pandis, Atmospheric Chemistry and Physics: From Air Pollution to Climate
Change (Wiley-Interscience, 2006), 2nd ed.
[2] S. Tomita et al., Nucl. Instr. Meth. Phys. Res. B 365 (2015) 616.
[3] M. B. Enghoffet al., Atmos. Chem. Phys. 12(2012) 5319.
[4] S. Ishino et al., UTTAC Annual Reports 2014, p36 (2015).
[5] N. Bork et al., Atmos. Chem. Phys. 13 (2013) 3695.
[6] E. Harris et al., Environ. Sci. Technol. 47 (2013) 12174.
Fig.1. Schematic drawing of the experimental setup.
3.
3.1
Operation of the Tsukuba 6 MV multi-nuclide AMS system for the year
2016
K. Sasa, T. Takahashi, T. Matsunaka, S. Hosoya, M. Matsumura, H. Shen, M. Honda, Y. Ota, K. Matsuo,
A. Sakaguchi, K. Sueki
A new horizontal-type 6 MV Pelletron tandem accelerator (model 18SDH-2 Pelletron, NEC, USA) was
installed at the University of Tsukuba in March 2014 [1]. After 2 years of construction and preparation, the
first test on multi-nuclide AMS has been performed in March 2016. The rare particle detection system on
the 6 MV Pelletron tandem accelerator (Tsukuba 6 MV multi-nuclide AMS system) was designed and
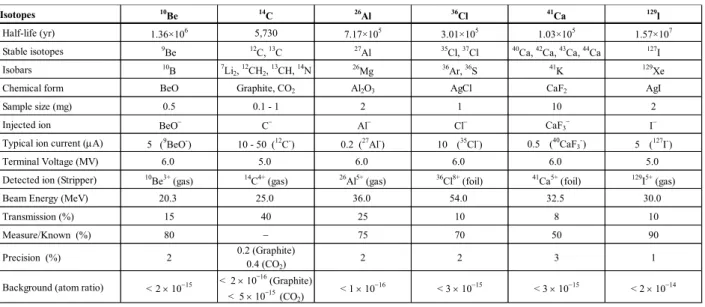
constructed for high-sensitivity detections of 10Be, 14C, 26Al, 36Cl, 41Ca, and 129I, and was also expected to
measure other radioisotopes of 32Si and 90Sr. The background of the system for 14C measurements using
the 4+ charge state and the terminal voltage VT = 5.0 MV was reached down to 14C/12C = 2.4 ×10⁻¹⁶. In
addition, we successfully detected 10Be, 26Al, 36Cl, 41Ca, and 129I by the multi-nuclide AMS system in 2016.
In the case of 10Be AMS, 10BeO− was extracted from the MC-SNICS and then accelerated with VT = 6.0
Table 1. Performance of rare particle detections by the multi-nuclide AMS system. 10Be Std. (KNBe5-1)
10Be/Be=2.709 ×10-11
3000 Cycle
10
Be
3+10
B
3+Isotopes 10
Be 14C 26Al 36Cl 41Ca 129l
Half-life (yr) 1.36×10⁶ 5,730 7.17×10⁵ 3.01×10⁵ 1.03×10⁵ 1.57×10⁷
Stable isotopes 9Be 12C, 13C 27Al 35Cl, 37Cl 40Ca, 42Ca, 43Ca, 44Ca 127I
Isobars 10
B 7Li2, 12CH2, 13CH, 14N 26Mg 36Ar, 36S 41K 129Xe
Chemical form BeO Graphite, CO2 Al2O3 AgCl CaF2 AgI
Sample size (mg) 0.5 0.1 - 1 2 1 10 2
Injected ion BeO− C− Al− Cl− CaF3− Ι−
Typical ion current (µA) 5 (9BeO-) 10 - 50 (12C-) 0.2 (27Al-) 10 (
35Cl-) 0.5
( 40
CaF3
-) 5 (
127I-)
Terminal Voltage (MV) 6.0 5.0 6.0 6.0 6.0 5.0
Detected ion (Stripper) 10
Be3+ (gas) 14C4+ (gas) 26Al5+ (gas) 36Cl8+ (foil) 41Ca5+ (foil) 129I5+ (gas)
Beam Energy (MeV) 20.3 25.0 36.0 54.0 32.5 30.0
Transmission (%) 15 40 25 10 8 10
Measure/Known (%) 80 − 75 70 50 90
Precision (%) 2 0.2 (Graphite)
0.4 (CO2)
2 2 3 1
Background (atom ratio) < 2 × 10⁻¹⁵ < 2 × 10
-16
(Graphite) < 5 × 10-15(CO2)
< 1 × 10⁻¹⁶ < 3 × 10⁻¹⁵ < 3 × 10⁻¹⁵ < 2 × 10⁻¹⁴
Fig. 1. Two-dimensional spectrum of 10Be AMS measured with the five-anode ∆E−E gas ionization detector.
MV. As a result, 20.3 MeV Be3+ was detected by a five-anode ∆E−E gas ionization detector. Isobaric
interference of 10B was eliminated by an absorber cell in front of the detector. Figure 1 shows a two
dimensional spectrum of 10Be AMS for a standard of 10Be/Be = 2.709 × 10⁻¹¹. The background of 10Be
AMS is lower than 2 × 10⁻¹⁵. Table 1 summarizes the performance of rare particle detections by the
multi-nuclide AMS system.
We measured 1,120 samples in total by the multi-nuclide AMS system in the period from March 2016
to March 2017. Figure 2 shows a breakdown by types of measured nuclides. Figure 3 shows
monthly-measured nuclides from March 2016 to March 2017. 129I was measured most frequently in the fiscal year 2016 in order to investigate the radiative contamination of 131I from the Fukushima Daiichi Nuclear Power Plant accident.
Reference
[1] K. Sasa et al., Nucl. Instr. Meth. B 361 (2015) 124.
Nuclides Number 10 Be 13 14 C 321 26 Al 30 36 Cl 184 41 Ca 88 129 I 484 Total 1120 N um be
r of pi
ec
es
Fig. 2. Breakdown of measured nuclides by the multi-nuclide AMS system in the fiscal year 2016.
Fig. 3. Breakdown of monthly-measured nuclides by the multi-nuclide AMS system from March 2016 to March 2017.
3.2
36Cl AMS measurements with the 6 MV tandem accelerator
S. Hosoya, K. Sasa, T. Takahashi, T. Matsunaka, M. Matsumura, H. Shen, K. Sueki
36
Cl (t1/2 = 3.0 × 10 5
yr) is a long-lived radionuclide and mainly used to determine the exposure age of
meteorites and to study the land-forming process. In addition, it has been used as an environmental tracer
in groundwater [1] and ice core studies [2]. However, 36Cl AMS measurement is interfered by an isobar 36
S. In AMS, 36Cl is separated from other ions using mass analyzing magnets and electrostatic energy
analyzer. However, the isobar 36S has the same analyzing trajectory as for 36Cl because both of them have
the same mass and energy. This causes the interference noted above. Therefore, it is necessary to separate
these isobars by the difference of energy loss in the gas ionization detector. Also, in order to achieve
highly sensitive AMS measurements sulfur contents must be minimized in sample materials. We try
several methods to reduce the influence of 36S and achieve the low-background AMS system.
The sulfur ions are mainly generated within the ion source if Cs beams irradiate the metal surface of
the sample holder on which an AMS sample is fixed. Therefore, the amount of sulfur ion depends on
material and dimension of the sample holder. We
investigated the relation between various sample
holders and the amount of sulfur ion. Figure 1 shows
comparison of sulfur counts for various conditions of
two sample holders S-1 and S-2, which are made of
Cu. The diameters of the surfaces of S-1 and S-2 are
3 and 7 mm, respectively. Ta and AgBr are used as
backing materials which cover the surfaces of the
holders. The results show that the smaller-sized S-1
generates larger amount of sulfur ions, probably
because the metal surface is more exposed to the Cs
beam. From this result, it is concluded that the
sample holder S-2 + AgBr backing is the most
suitable choice for 36Cl AMS measurements.
Probably, the reason why sulfur decreases for AgBr
backing is that sulfur is removed during the
purification process of producing AgBr.
For Cl/S isobar separation at the 6 MV terminal
voltage, we determined optimum conditions of the
five-anode gas ΔE-E detector [3], using the Monte
Carlo simulation code [4]. We also considered
chlorine charge state distribution at 6 MeV energy,
which is shown in. Fig. 2. While Cl7+ has the
highest beam current, we selected Cl8+ because the
Fig.1. Comparison of sulfur counts due to differences with sample holder materials. Sulfur counts normalized with 35Cl beam current.
Fig.2. Charge state distribution of Cl at 6 MeV. Carbon foil of 4.8 µg/cm2 is used as a stripper foil.
spectrum separation becomes greater than for Cl7+, as will
be discussed later. Indeed, the beam current is not an
important factor under the present conditions of 35Cl ~ 15
− 20 µA. The Cl/S isobar separation is represented by the separation ability M’ [3]. The values of M’ for Cl7+ and Cl8+
separation, listed in Table 1, clearly show better Cl/S isobar
separation for Cl8+ than for Cl7+. Figure 3 shows the histogram of 36Cl8+ obtained from the AMS
measurement. Since at dE3 the 36Cl8+ spectrum still overlaps with the 36S8+ spectrum., we gated on
2σ using dE3 signal.
After such attempts, the detection sensitivity of 36Cl/Cl reached as low as ~ 3 × 10-15. This value is
the highest performance in Japanese AMS facilities. Further refinement of the AMS system is needed to
achieve higher sensitivity realized so far by several foreign facilities.
References
[1] Y. Tosaki et al., J. Environ. Radioact., 106 (2012) 73.
[2] K. Sasa et al., Nucl. Instr. Meth. B, 268 (2010) 1193.
[3] S. Hosoya et al., UTTAC Annual Report, 2015 (2016) 17.
[4] T. Sato et al., J. Nucl. Sci. Technol., 50 (2013) 913.
Fig.3. dE1 + dE2 vs. dE4 +dE5 spectrum after gating dE3 signal on the
gas ionization detector for the sample with 36Cl/Cl ratio of 1.000 ×10⁻¹¹.
dE1 + dE2 dE4 + dE5
Cl7+ meas. 1.249 0.580
Cl8+ meas. 1.421 0.675
Table 1. Separation ability M’ for Cl7+ and Cl8+.
3.3
36Cl/Cl and
36Cl inventory in surface soils near the Fukushima Dai-ichi
Nuclear Power Plant
Y. Ohta, K. Sueki, K. Sasa, T. Takahashi, S. Hosoya, M. Matsumura
On March 11, 2011, the Great East Japan Earthquake caused the Fukushima Dai-ichi Nuclear Power
Plant (FDNPP) accident. In consequence, a large amount of radionuclides were released into environment.
Most of the radionuclides released in this accident were from 235U in the nuclear fuels. On the other hand,
radioisotopes that had their origins in coolant or nuclear reactor materials were also discharged. One of
themis 36Cl. 36
Cl in this case is generated by 35Cl (n, γ) 36Cl, where 35Cl is contained in the coolant as impurities. At
the time of the accident, therefore, 36Cl surely existed in the coolant. However, there is one published
article only which reports on the emission of 36Cl in FDNPP accident. This is probably because 36Cl in
environmental samples can only be measured by accelerator mass spectrometry (AMS) which is usually
interfered with 36S, an isobar of 36Cl. For this reason, 36Cl AMS requires a lot of chemical treatments.
In Japan, there are two AMS facilities that can measure 36Cl; University of Tsukuba Tandem
Accelerator Complex (UTTAC) and Micro Analysis Laboratory, Tandem Accelerator, The University of
Tokyo (MALT). Miyake et al. measured 36Cl in surface soils around FDNPP by AMS system in MALT
and relatively high 36Cl/Cl ratios were detected [1]. However, their results have large errors of ±20−59%
and only 10 samples have been measured so far. Accordingly, measurements of more samples with smaller
errors are necessary to discuss the release of 36Cl in detail.
For samples in the present study, surface soils with a thickness of 5 cm were collected at 10
locations to the northwest of FDNPP from June 12 to August 1, 2013. The sample preparation scheme was
designed by referring to Tamari [2], Amano [3], and Bastviken et al. [4]. The soil samples were dried at
60°C, sieved through 2 mm mesh and grinded using a mortar and pestle. The 20−40 g soil in 50 mL
centrifuge tubes were subsequently frozen at −18°C and thawed at 60°C to destruct microbial cells.
Adding 0.01 M HNO3 (3 times the amount of soil) to 50 ml centrifuge tubes, the tubes were sonicated for
3 hours, centrifuged at 2000 rpm for 15 minutes and then the supernatants were pipetted to plastic bottles.
Same extraction was repeated four times and all extracts were mixed. Activated carbon of 1−2 g was
added to the extracts in order to remove organic sulfur and also extractable organic chlorine (Clorgex).
Meanwhile, non-extractable organic chlorine (Clorg) and chlorine in mineral (Clmin) remained in the soil. In
the extracts, only inorganic chlorine (Clinorg) existed. After shaking over 3 hours, the extracts were filtered through a 0.2 μm filter. After 10 mL aliquot was transferred to plastic bottles in order to measure stable chlorine with ion chromatography, 0-200 μL carrier prepared from halite (36Cl/Cl = 3.52×10⁻¹⁴) was added
to a filtrates. After adding 30% H2O2 (half the amount of soil) to filtrates and standing for 3 hours because
of organic matter decomposition, 3 M NH3 (0.15 times amount of soil) were added and stood for 3 hours
to precipitate metal impurity as hydroxide. After filtration, the filtrates were concentrated to about 10 mL
by hot plate at 80°C.
Concentrated solutions were acidified by 13 M HNO3 and excess 0.3 M AgNO3were added. After
centrifugation (2000 rpm, 15 minutes), supernatants were removed and precipitates were dissolved in 3 M
NH3 (2 mL). 0.05 M Na2CO3 (2 mL) and then saturated Ba(NO3)2 (1 mL) were added in the solutions and BaCO3 and BaSO4 were coprecipitated and filtered through a 0.2 μm filter. Such BaCO3 method, named by Tamari [2], enables effective removal of SO4− by coprecipitating in [Ba2+]/[CO32-]=2.5−7.0. In this
work, the BaCO3 method was repeated three times although only 0.05 M Na2CO3 were added at the
second and the third time (respectively 1.4 mL and 0.9 mL) using remains of Ba2+ at the first time. After
reprecipitation of AgCl by adding 13 M HNO3 and excess 0.3 M AgNO3, AgCl were redissolved by 3 M
NH3 (2 mL) and 0.05 M Na2CO3 (2 mL) in order to remove Ba2+ as an interference element of ionization
at MC-SNICS (Multi Cathode-Source of Negative Ions by Cesium Sputtering). After filtering through a 0.2 μm filter, AgCl was reprecipitated and washed for three times with ultrapure water and twice with 99.5% C2H5OH. After drying at 110°C, the AgCl sample was used for AMS measurement of 36Cl.
Measurement results of 36Cl are summarized in Table 1. Before FDNPP accident, 36Cl/Cl ratios
varied in the range 0.09−1.14 (×10−12) and the mean value was 0.46 × 10⁻¹² around FDNPP [5]. However,
extremely higher 36Cl/Cl ratios are observed at NM-7 and NM-15. Furthermore, 36Cl inventory at NM-17
is as large as those of NM-7 and NM-15. Consequently, the release of 36Cl in FDNPP accident is evident
and influence of the accident is recognized at 3 locations as far as 8 km away from FDNPP. At other
locations of 8-28 km from FDNPP, there was little influence of FDNPP accident. The release of 36Clseems
noticeable only around FDNPP. Further investigation is required to discuss the details.
Table 1. Summary of 36Cl measurement results
References
[1] Y. Miyake et al., Nucl. Instr. Meth. Phys. Res. B361 (2015) 627.
[2] M. Tamari, Master’s thesis, University of Tsukuba 2009 (in Japanese).
[3] T. Amano, Master’s thesis, University of Tsukuba 2011 (in Japanese).
[4] D. Bastviken et al., Geochimica et Cosmochimica Acta 71 (2007) 3182.
[5] R. Seki et al., Nucl. Instr. Meth. Phys. Res. B 259 (2007) 486.
3.4 Determination of I-129 in radioactive particles by AMS
K. Matsuo, K. Sueki, T. Matsunaka, M. Matsumura, K. Sasa, T. Takahashi, S. Hosoya, A. Sakaguchi,
M. Honda, R. Inaba, Y. Satou1
In March 2011, radioactive particles were emitted into the environment from FDNPP [1]. The
particles contain various radionuclides that were produced in nuclear reactors. In this AMS study, we
focused on 129I which is a long-lived nuclide (T1/2 = 1.57×10⁷
years) so that its amount remains
effectively unchanged since the accident. The study of 129I should provide information about the
behavior of short-lived 131I which is also emitted at that time and is very serious for the environment.
We tried to understand how iodine was incorporated into radioactive particles by determining the
amount of 129I in the particles.
The four sample particles were picked from the dust which was collected at the site 2 km away to
the north-north west from FDNPP. Iodine species were extracted from the particles after the three steps
of pretreatment of the samples, as follows.
The first step was to wash the particles by Milli-Q water. One particle with 5 mL of Milli-Q water
was put in a centrifugation tube and washed in the ultrasonic cleaner (AS ONE, US-4R) for 30 minutes
before the wash liquid was filtrated through 0.2 μm filter.
The second step was extraction by 25% tetramethylammonium hydroxide (TMAH) aqueous
solution (TAMACHEMICALS, TAMAPURE-AA). The particle after the first step was put in the vessel
for the microwave digestion apparatus (BERGHOF, speedwave4) with 5 mL of TMAH aq. After
entering the vessel into the machine, the particle was irradiated by microwaves at 90 W for 3 hours and
we took out the solution.
The third step was thermal hydrolysis using the tube furnace. The particle passed through the first
and second steps was placed on a ceramic boat. Subsequently, the boat was heated in the tube furnace in
which moisture-containing oxygen flowed at 990°C for 30 minutes and a solution for trapping iodine
was fitted on the discharge side of the tube with an L-shaped tube at that time. This solution was
composed of 6.1 mL of Milli-Q water, 800 μL of 25% TMAH aq. and 100 μL of 2% Na2SO3 aq. After
finished heating, the whole solution including the wash liquid of the L-shaped tube made to 10 mL.
Also, blank samples were made in all the steps.
Each of the first-, second-, and third-step samples were fractionated into a half, 1/10 and 1/100,
respectively, and NaI aq. as carrier (2 mg of I) was added to each of these samples. And then,
purification of iodine, treatment of AgI, and the AMS measurements were carried out in accordance
with the condition by Matsunaka et al. [2, 3] .
The amount of 129I was determined from the result of 129I / 127I by Matsuzaki et al [4]. In the
reference document, the amount of 127I in the sample was determined by ICP-MS and is considered
when calculating the amount of 129I. However, the density of iodine of the particles was estimated to be
1 Japan Atomic Energy Agency (JAEA)
under 50 ppm because iodine was undetected by the elemental analysis of BL37XU at SPring-8 [5].
Therefore, the amount of 127I in the particle was neglected since it was much smaller than that in the
carrier. The numbers of 129I per one particle was calculated by summing up second and third steps.
Finally, we obtained the activity of 129I, the number of atoms, the activity of 129I and the activity ratio of 129
I / 137Cs (Bq/Bq) per one particle on March 11, 2011.
The results are shown in Tables 1 and 2. Table 1 shows the numbers of 129I atoms in the samples at
each step and Table 2 shows the numbers of 129I atoms, their activity, and 129I / 137Cs (Bq/Bq) per one
particle at the time of the occurrence of the accident. It is presumed that some amounts of 129I have
come out from the surface of particles by ultrasonic cleaning. The extraction by TMAH aq. seems to be
meaningful because 5 − 26% of the whole amounts of 129I were extracted by this step. Furthermore, the
average of 129I / 137Cs of the four particles (2.9×10⁻⁹) is smaller than that of the sampled soil [(4.3±
0.1)×10−7] by two orders of magnitude. Therefore, it is presumed that the behavior of I and Cs
absorbed into particles is different from that of singly emitted Cs and I.
Names of particles Washing by
milli-Q
Extraction by 25%
TMAH aq. Thermal hydrolysis
CF-01M02 5.04±0.16×10⁷ 3.33±0.07×10⁸ (26%) 1.24±0.06×10⁹ (74%)
CF-01M06 6.91±0.59×10⁶ 1.64±0.05×10⁸ (9%) 1.99±0.12×10⁹ (91%)
CF-01M08 4.11±0.13×10⁷ 2.75±0.08×10⁸ (23%) 9.13±0.05×10⁸ (77%)
CF-01M15-1 1.91±0.05×10⁸ 5.83±0.30×10⁷ (5%) 1.08±0.06×10⁹ (95%)
Names of particles Number of atoms Activity (Bq) 129I / 137Cs (Bq/Bq)
CF-01M02 1.29±0.08×10⁹ 1.80±0.11×10⁻⁶ 5.79±0.45×10⁻⁹
CF-01M06 1.87±0.13×10⁹ 2.61±0.18×10⁻⁶ 3.64±0.32×10⁻⁹
CF-01M08 1.19±0.05×10⁹ 1.66±0.08×10⁻⁶ 1.17±0.08×10⁻⁹
CF-01M15-1 1.14±0.06×10⁹ 1.60±0.08×10⁻⁶ 1.03±0.06×10⁻⁹
References
[1] K. Adachi et al., Sci. Rep. 3 (2013) 2554.
[2] T. Matsunaka et al., Nucl. Instr. Meth. B 361 (2015) 569.
[3] Y. Muramatsu et al., Quat. Geochronol 3 (2008) 291.
[4] H. Matsuzaki et al., Nucl. Instr. and Meth. B 123 (2007) 721.
[5] M. Suzuki et al., SPring-8 Users Info. 16(2011) 201 (in Japanese).
Table 1. Number of 129I atoms in the samples at each step
Table 2. Number of 129I atoms, their activity, and 129I / 137Cs (Bq/Bq) at the time of the accident
3.5
Preparation of a
129I standard solution for ICP-MS/MS
M. Honda, K. Sasa, T. Takahashi, T. Matsunaka, S. Hosoya, M. Matsumura, K. Sueki
A large amount of 129I (physical half-life: 15.7 Myr) has been introduced into the terrestrial environment through nuclear weapons’ tests, spent nuclear fuel reprocessing operations, and nuclear accidents. The study of anthropogenic 129I is of increasing concern in Japan from the viewpoint of a radiation risk assessment. AMS have been commonly used for the 129I analysis, but the latest triple quadrupole ICP-MS (ICP-MS/MS) is becoming an alternative analysis. ICP-MS/MS provides a high sample throughput and optimum way for the analysis of high-level 129I (129I/127I> 10−8 ) which is hard to deal with AMS [1]. Absolute ICP-MS/MS measurements require reliable standards for calibration. In this fiscal year, the 129I/127I ratio of a home-made standard solution for ICP-MS/MS was evaluated with 6MV AMS at UTTAC.
The 129I standard solution “tRIC-1” was prepared from a stored 129I solution (127I and 129I concentrations are 1 mg/mL and 0.448 Bq/mL, respectively) with 2% tetramethyl ammonium hydroxide solution (Tama Chemicals). The stable iodine (127I) concentration in tRIC-1 was determined by ICP-MS/MS to be 9.95 ± 0.10 ppm. A portion of 100 mL tRIC-1 was mixed with 698 mg iodine carrier (Orion Ionplus, Thermo scientific, which has 129I/127I = 1.80 × 10⁻¹³ [2]) and then precipitated as silver iodide (AgI). The precipitated AgI was divided into five batches and the five targets prepared from each batch were measured. The 129I/127I ratios were all normalized using the standard material provided by PRIME Lab. at Purdue University (nominal value is 6.54 × 10⁻¹²). In AMS, the charge state of 5+ was chosen for the terminal voltage of 5 MV. The 129I/127I ratio in tRIC-1 was calculated from the AMS and ICP-MS/MS results.
A good reproducibility was obtained in the 129I AMS measurements, as shown in Fig. 1. The 129I/127I ratios of tRIC-1 range from (5.93 ± 0.16) × 10−5 to (6.40± 0.05) × 10−5. The 129I/127I ratio is evaluated as the averaged value for the five batches, i.e., (6.20 ± 0.18) ×10−5.
References
[1] T. Ohno andY. Muramatsu, J. Anal. At. Spectrom. 29 (2014) 347. [2] H. Matsuzaki et al., Nucl. Instr. Meth. B 259 (2007) 721.
Fig. 1. 129I/127I ratios in a home-made standard solution.
3.6
Performance evaluation of the AMS-measurement of iodine-129 by the
6 MV tandem accelerator at University of Tsukuba
M. Matsumura, K. Sasa, T. Matsunaka, T. Takahashi, S. Hosoya, Y. Satou , K. Sueki1
A multi-nuclide AMS system for 10Be, 14C, 26Al, 36Cl, 41Ca, and 129I is now available at UTTAC [e.g.,
1, 2]. This report focuses on the performance of 129I measurement for near-future development of the
standard reference materials of 129I. The 129I measurement conditions of the accelerator were as follows;
injected ion species of I−, the terminal voltage of 5.0 MV, and the analyzed ions of 30MeV I5+. Isobutane
gas of 19 Torr was used for the gas-ionization detector with an entrance window of a 1.5-µm thick
polyester film. The 129I standard reference materials, Z94-0596 and Z94-0597, named Purdue1 and Purdue
2, respectively, were provided by PRIME Lab., Purdue University [3, 4].
The ratios of 129I/127I were measured in the experiments. The measured ratio for Purdue 1 is (8.29 ±
0.08) × 10−12 against the consensus ratio of 8.38 × 10⁻¹² with a precision error of 1.1% , while for Purdue 2
the measured ratio is (6.54 ± 0.03) × 10−11 against the consensus ratio of 6.54 × 10⁻¹¹ with a precision error
of 0.5%. These results thus indicate good agreement, including the precision errors, between the
measured and consensus values. Figure 1 shows consistency between the two values, which demonstrates
that the present experimental setup and the method of analysis are reasonable.
Figure 2 shows dependence of the beam current and transmission of 129I on the mixing ratio of the
Nb-powder to the target AgI of Purdue 2. We see that the maximum beam current, i.e., the optimum
mixing ratio is given at Nb:AgI=4:1, as is generally proposed. Figure 3 shows the results of blank
1
Japan Atomic Energy Agency
Fig. 1. Comparison between the measured and the consensus ratios of 129I/127I
for the 129I standard reference materials.
measurements. ”Old Iodine” provided from DeepWater corporation has the extremely low background
level of the 129I/127I ratio as low as 1 × 10⁻¹⁴. Therefore, the machine background is estimated to be as low
as on the order of 10−15 in the value of 129I/127I.
This work was supported by JSPS KAKENHI Grant Number 15H02340.
References
[1]K. Sasa et al., Nucl. Instr. Meth. Phys. Res. B 361 (2015) 124.
[2] S. Hosoya et al., Nucl. Instr. Meth. Phys. Res. B (2017) in press.
[3] P. Sharma, et al., Nucl. Instr. Meth. Phys. Res. B 123 (1997) 347.
[4] H. Matsuzaki, et al., Nucl. Instr. Meth. Phys. Res. B 361 (2015) 63.
Fig. 2. Dependence of beam current and transmission of
129
I standard reference materials on the Nb/AgI mixing ratio.
Fig. 3. Measured 129I/127I ratios for various
blanks.
3.7
Reconstruction of temporal variation for anthropogenic radionuclides
in the Japan Sea using a coral core sample
R. Inaba, A. Sakaguchi, T. Nomura1, H. Yamano H2, K. Sasaki K3, T. Watanabe4, M. Honda, K. Sasa, T. Matsunaka, S. Hosoya, T. Takahashi, M. Matsumura, K. Sueki
Due to recent improvements in instrumentation and chemical pretreatments, Iodine-129 (129I ; T1/2=1.57×107 y) is increasingly being used as an oceanic circulation tracer instead of the short half-life artificial nuclide, 137Cs. 129I is a long-lived anthropogenic radionuclide that is introduced to the earth surface environment, mainly by atmospheric nuclear tests and/or nuclear-related facilities. However, 129I input history to “the miniature ocean”, the Japan Sea, has not been clarified. In this study, the input history of 129I to the surface water of the Japan Sea has been reconstructed through measurement of 129I/127I atom ratios in a coral sample collected from Iki Island; the main entrance of surface water to the Japan Sea.
The coral core sample (Dipsastraea speciosa) was collected in November 2012 from a depth of 3 m at Kurosaki, Iki Island (N33o 48'22.5, E129 o 40'02.9). The annual growth bands were confirmed by X-ray imaging and Sr/Ca analysis with laser ablation (LA)-ICP-MS for coral slabs, and the coral sections were cut into annual segments in accordance with the X-ray image and the variation of the Sr/Ca ratios. The 129I/127I in each annual ring was measured by AMS after appropriate sample preparation.
The 129I/127I atom ratios were reconstructed over a wide range of (0.145−71.3)×10−12. It was observed that the ratio drastically increased in the
early1950s, and has high values even now. It may be presumed that airborne 129I, which is released from nuclear-related facilities, has been constantly absorbed by the surface seawater around this area. The recent atom ratios found in the surface water of the Japan Sea are higher than those of Guam [1], Baler in the Philippines [2]. It was also observed that the reconstructed 129I/127I atom ratios show different variations than for 236U/238U ratios that were constructed from the same coral core sample [3].
References
[1] C. Chang et al., J. Environ. Radioact. 165 (2016) 144. [2] A. T. Bautisata et al., J. Environ. Radioact. 164 (2016) 174. [3] A. Sakaguchi et al., J. Geophys. Res. Oceans 121 (2016) 4.
1 Graduate School of Science, Hiroshima University 2 National Institute for Environmental Studies 3 Kanazawa Gakuin University
4 Faculty of Science, Hokkaido University
Fig.1. Variations of 129I/127I atom ratios reconstructed from the
annual rings in the coral cores from Guam [2], Baler [1] and Iki Island (this study).
Year
Fig. 1. Red circles: the variations of excess 14C activity in the Tokai tree rings. White circles: estimated annual 14C
discharge from Tokai NPP, Tokai-2 NPP, and Tokai RP [1], calculated by multiplying the 14C emission factors for NPP
[5.5 TBq W−1 for Magnox GCR (Tokai NPP) and 0.51 TBq W−1 for BWR (Tokai-2 NPP) ] [2, 3] by the annual
electrical energy output [4].
3.8 Radiocarbon variations since 1960 in tree rings near the Tokai nuclear
facilities in Japan
T. Matsunaka, K. Sasa, T. Takahashi, S. Hosoya, M. Matsumura, K. Sueki, Y. Satou1
Tokai area in Ibaraki Prefecture is located 1.8 km south-southwest of the Tokai Nuclear Power Plants
(Tokai NPP and Tokai-2 NPP) and 1.4 km North-Northwest of the Tokai Reprocessing Plant (Tokai RP).
To evaluate the environmental impact of the atmospheric 14C discharge from the Tokai nuclear facilities, a
80-year-old pine tree grown at Tokai area was cored and 14C in each annual ring was measured using the
AMS system at UTTAC. The terminal voltage of 5.0 MV and the charge state of 4+ were chosen for
acceleration and detection of 14C. The measurement error of the system was ±0.3% for NIST-4990C
(HOx-II), and the blank levels were 0.04–0.09 pMC (55,950–63,300 yrBP) for IAEA-C1 (Marble). The 14
C specific activities varied from 232.8 Bq kg−1 C to 403.3Bq kg−1 C in the tree rings formed during the
period 1959–2013. The specific activities in 1967–2010 are significantly elevated compared with the
ambient background values, clearly indicating 14C discharges from the Tokai nuclear facilities during their
normal operation. The excess 14C activities of 0.48–70 Bq kg−1 C in 1965–2011, shown in Fig.1, are
positively correlated with the estimated annual 14C discharges of 0.02–2.0 TBq from Tokai NPP
(operational period: 1966–1997), Tokai-2 NPP (operational period: 1978–2010) and Tokai RP (operational
period: 1977–2007) with R2 of 0.72 (n = 38), as shown in Fig.2. These activity values of < 70.0 Bq kg−1 C
are corresponding to an additional annual effective dose of < 3.9 µSv via the food ingestion pathway in the
location studied.
1
Collaborative Laboratories for Advanced Decommissioning Science, JAEA
References
[1] J. Koarashi et al., J. Nucl. Sci. Technol. 53 (2016) 546.
[2] UNSCEAR, Exposures to the Public from Man-made Sources of Radiation, vol. 1 (2000).
[3] H. D. Graven and N. Gruber, Atmos. Chem. Phys. 11 (2011) 12339.
[4] IAEA (2016), http://www.iaea.org/PRIS/CountryStatistics/CountryStatisticsLandingPage.aspx.
Fig. 2. The correlation between excess 14C activity in the Tokai tree rings and estimated annual 14C
discharge from Tokai NPP, Tokai-2 NPP, and Tokai RP. The linear regression line and coefficient of
determination (R2) are shown in the correlation diagram.