Exploration of genetic factors controlling cancellous bone
Exploration of genetic factors controlling cancellous bone Exploration of genetic factors controlling cancellous bone
Exploration of genetic factors controlling cancellous bone
microstructure of mouse
microstructure of mouse microstructure of mouse
microstructure of mouse
by by by by Taro Kataoka Taro Kataoka Taro Kataoka Taro Kataoka
DOCTOR OF PHILOSOPHY DOCTOR OF PHILOSOPHY DOCTOR OF PHILOSOPHY DOCTOR OF PHILOSOPHY
Department of Genetics Department of GeneticsDepartment of Genetics Department of Genetics
School of Life Science School of Life Science School of Life Science School of Life Science The
The The
The Graduate University of Advanced StudiesGraduate University of Advanced StudiesGraduate University of Advanced StudiesGraduate University of Advanced Studies 201220122012
2012
CONTENTS CONTENTS CONTENTS CONTENTS
1. ABSTRACT 1. ABSTRACT 1. ABSTRACT 1. ABSTRACT
2. INTRODUCTION 2. INTRODUCTION 2. INTRODUCTION 2. INTRODUCTION
3. MATERIALS AND METHODS 3. MATERIALS AND METHODS 3. MATERIALS AND METHODS 3. MATERIALS AND METHODS
4. RESULTS 4. RESULTS 4. RESULTS 4. RESULTS
4.1 4.1 4.1
4.1 Consomic analysis of mouse phenotype of cancellous bone Consomic analysis of mouse phenotype of cancellous bone Consomic analysis of mouse phenotype of cancellous bone Consomic analysis of mouse phenotype of cancellous bone microstructure
microstructuremicrostructure microstructure
4.2 4.2 4.2
4.2 Characterization of consomic strain B6Characterization of consomic strain B6Characterization of consomic strain B6Characterization of consomic strain B6----Chr15Chr15Chr15Chr15MSMMSMMSMMSM (C15)(C15)(C15) (C15)
4.3 4.3 4.3
4.3 Genetic dissection of phenotypic difference in the cancellous bone Genetic dissection of phenotypic difference in the cancellous bone Genetic dissection of phenotypic difference in the cancellous bone Genetic dissection of phenotypic difference in the cancellous bone microstructure with C15
microstructure with C15microstructure with C15
microstructure with C15----derived subderived subderived sub----consomic strainsderived sub consomic strainsconsomic strainsconsomic strains
4.4 4.4 4.4
4.4 Exploration of candidates of the causative genes for the QTL in Exploration of candidates of the causative genes for the QTL in Exploration of candidates of the causative genes for the QTL in Exploration of candidates of the causative genes for the QTL in Sub
SubSub
Sub----block 1block 1block 1block 1----1 1 1 1
5. DISCUSSION 5. DISCUSSION 5. DISCUSSION 5. DISCUSSION
5.1 5.1 5.1
5.1 Complexity of genetComplexity of genetComplexity of genetic architecture controlling cancellous bone Complexity of genetic architecture controlling cancellous bone ic architecture controlling cancellous bone ic architecture controlling cancellous bone microstructure
microstructuremicrostructure microstructure
5.2 5.2 5.2
5.2 Toward discovery ofToward discovery ofToward discovery ofToward discovery of thethethe causative gene for QTL in Subthecausative gene for QTL in Subcausative gene for QTL in Sub----block 1causative gene for QTL in Subblock 1block 1block 1----1111
5.3 5.3 5.3
5.3 Cancellous bone microstructure and physical strength of boneCancellous bone microstructure and physical strength of boneCancellous bone microstructure and physical strength of boneCancellous bone microstructure and physical strength of bone
6. ACKNOWLEDGEMENTS 6. ACKNOWLEDGEMENTS 6. ACKNOWLEDGEMENTS 6. ACKNOWLEDGEMENTS
7. REFERENCES 7. REFERENCES 7. REFERENCES 7. REFERENCES
FIGURES AND TABLES FIGURES AND TABLES FIGURES AND TABLES FIGURES AND TABLES
1. ABSTRACT 1. ABSTRACT 1. ABSTRACT 1. ABSTRACT
Bones have crucial roles in supporting body as one of the locomotor apparatuses, maintaining mineral homeostasis and protecting vital organs. Bone tissues are classified into two types by visual appearance and location,
“cancellous (trabecular) bone” and “cortical bone”. Cancellous bone, also known as sponge bone, is found in vertebral body and both ends of long bone like tibia and femur. It has larger surface area but shows weaker strength than cortical bone. It provides structural strength to bone tissue. Cortical bone forms cortex of most bones. It is stronger and stiffer than cancellous bone. The outer shell surrounding the cancellous bone at the end of the joints is also made up of cortical bone.
Bones in adulthood are continuously renewed by old bone resorption by osteoclasts and new bone formation by osteoblasts. This process is called
“bone remodeling”. Bone remodeling is important for bone homeostasis, and is essential for maintenance of healthy bones. Disruption of ideal balance in bone remodeling causes abnormal bone mass such as osteoporosis and osteopetrosis. A series of longitudinal studies of human populations have showed that bone mineral density (BMD) is correlated with physical strength of bone, and a most important risk factor for bone fracture. However, human studies also indicated that BMD at any time points is well correlated with peak (highest) bone mass in the early growth phase of bone. Furthermore, these studies have also revealed that more than half of variation in the early growth phase of bone, which occurs over a short time
period during puberty, is determined predominantly by genetic factors. Recent advance in X-ray micro-computed tomography (micro-CT) has enabled to analyze three-dimensional (3D) structure of the cancellous bones without tissue destruction. Such studies have indicated that the risk of bone fracture in human elders increases as BMD decreases, but the biomechanical competence (physical strength) of bone and risk factor of bone fracture are dependent not only on BMD as the absolute amount of bone mass, but also on the 3D microstructure of cancellous bone. This fact suggests that we need to pay more attention to bone microstructure for identifying genetic risk factors for bone fracture. Recent studies also showed that there is a very good correlation between the bone microstructural measure obtained from the X-ray micro-CT and that obtained from conventional histological 2D sections. In particular, excellent correlation was found between bone volume fraction (BV/TV), which is the measure of cancellous bone volume per total volume surrounded by cortical bone, and the data of the histological 2D sections. Subsequent studies of microstructure of mouse cancellous bone by X-ray micro-CT have also showed that cancellous bone loss is observed even in the early growth phase of bone, and occurs continuously until the later adulthood stage, consistent with facts that cancellous bone is highly sensitive to change of bone metabolism, and is easily fractured in human elders.
Forward genetics approaches to explore polygenic factors responsible for bone homeostasis can be efficiently pursued in animal models. Usage of the animal models enables to control genome heterogeneity and
environmental factors, and improves the power to identify heritable regulation of bone homeostasis. Variations in genome sequences and bone phenotypes among different inbred strains of mice are amenable to genetic analyses of polygenic complex traits of bone phenotypes via the quantitative trait loci (QTL) analysis. In fact, several studies with inbred mouse strains have revealed QTLs that affect microstructure of mouse cancellous bone. However, none of causative genes for the QTLs has been identified so far.
In this study, I focused on genetic factors responsible for variation in microstructure of mouse cancellous bone at the earlier growth phase of 6 to 10 weeks of age, because the early growth phase is critical for bone density and microstructure at any time in the later adulthood stage. The genes that regulate bone formation during embryonic development have been intensively studied by reverse genetics approaches with knockout mouse strains, and the genes involved in bone homeostasis at the later adulthood stage have been extensively studied by genome wide association study for human populations. By contrast, there is only limited information for genes acting for forming bone microstructure at the earlier and growing phase of bone. This is another reason that I focused on the early growth phase of mouse bone.
For genetic analyses in this study, I used two strains, a laboratory inbred strain C57BL/6J (hereafter abbreviated B6) and Japanese wild mouse (Mus musculus molossinus)-derived MSM/Ms. These two strains are genetically very distant one another, and more than ten million SNPs have been identified between these two strains, and the SNP data are now fully
available. As a consequence of its genome divergence from B6 and other laboratory strains, MSM/Ms appeared to have unique complex traits that are never observed in standard laboratory strains. Another great advantage to use the B6 and MSM/Ms strains is that a full set of consomic strains, in which every B6 chromosome is replaced by counterpart of MSM/Ms, is now established and available for exploring QTLs.
At the beginning of this study, the X-ray micro-CT phenotyping of microstructure of cancellous bone of tibia at 10 weeks of age showed that MSM/Ms has far smaller value of bone volume fraction (BV/TV) than that of B6. This finding prompted me to pursue systematic phenotype screening of the same trait for the full set of B6-MSM/Ms consomic strains. As a result, I found that among all consomic strains B6-Chr15MSM carrying MSM/Ms-derive chromosome 15 (Chr15) shows the smallest cancellous bone volume fraction, indicating that mouse Chr15 harbors QTLs affecting bone microstructure, which is likely relevant to bone physical strength. Next, in order to further dissect genetic factors into sub-regions of Chr15, I generated nested sub-consomic strains that harbor sub-divided fragments of MSM/Ms Chr15. Bone phenotyping of these strains revealed that at least four chromosomal blocks of Chr15 genetically control the trait of cancellous bone microstructure. I named these blocks, Block 1 to 4, each of which contains at least one QTL affecting microstructure of cancellous bone. None of these four QTLs has been reported by other groups’ previous studies. It is of interest to note that the MSM/Ms alleles at the QTLs in the Block 2, 3 and 4 decrease the bone volume fraction (BV/TV) relative to B6 as were expected, but the
MSM/Ms allele at the QTL in Block 1 rather increases the BV/TV value relative to B6. Thus, the analysis with the sub-consomic strains revealed marked complexity of genetic architecture to control cancellous bone microstructure in mouse, and demonstrated that the analysis with consomic and sub-consomic strains has strong power to detect each of numerous QTLs, even if its phenotypic effect is modest.
Finally, I paid special attention to one short sub-block, named Sub-block 1-1, included in Block 1, the borders of which are defined by difference in the MSM/Ms-derived fragments of two sub-consomic strains. I intensively explored candidates of the causative gene for the QTL in Sub-block 1-1, because no known gene to be involved in bone regulation and homeostasis is assigned to this interval. I identified eight genes as candidates. In particular, four of them, Ankrd33b, Ropn1l, March6 and Fam173b, are good candidates from the aspects of expression pattern difference and amino acid change between B6 and MSM/Ms. Thus, this study provides indispensable clues for understanding genetic architecture underlying bone regulation and homeostasis of mouse, and for searching genetic factors responsible for osteoporosis in human.
2. INTRODUCTION 2. INTRODUCTION 2. INTRODUCTION 2. INTRODUCTION
Bones have crucial roles in supporting body as one of the locomotor apparatuses, maintaining minerals homeostasis and protecting vital organs. Each bone is composed of osteocytes, which are matured osteoblasts, and bone matrix consisting of collagenous fibers, non-collagenous proteins like osteocalcin and osteopontin, and non-organic salts including hydroxyapatite. The bone matrix is produced by osteoblasts. Organic compartment of the bone matrix is called osteoid. The principal component of osteoid is type-I collagen, which provides physical strength and elasticity of bone.
Bone tissues are mainly derived from mesoderm. Mesodermal mesenchymal cells condensate at sites of future bones. There are two types of bone ossification, as illustrated in Figure1. In “membranous ossification”, mesenchymal cells directly differentiate into osteoblasts, which produce bone matrix. In “endochondral ossification”, mesenchymal cells differentiate into chondrocytes first, and form cartilage primordium, defining a template for bone. The cartilage cells die through apoptosis, and the cartilage is replaced by bone matrix that is secreted by osteoblasts derived from mesenchymal stem cells. These osteoblasts initiate calcification at appropriate sites.
Formed bone tissues are classified into two types by visual appearance and location, “cancellous (trabecular) bone” and “cortical bone”. Cancellous bone, also known as sponge bone, is found in vertebral body and ends of long bone like tibia and femur (Figure 2). It has larger surface area but shows weaker strength than cortical bone. Cancellous bone is comprised
of spicules or plates that provide structural strength to bone tissue, and is also important for metabolic functions, serving as homeostatic mineral (primarily calcium) reservoir. Cancellous bone is surrounded by bone marrow that contains monocyte-lineage precursor cells, which can differentiate into osteoclast precursor cells. These precursors are recruited to the surface of bone, where they differentiate into mature osteoclasts. Cortical bone, synonymous with compact bone, forms cortex of most bones. It is stronger and stiffer than cancellous bone. This type of bone contributes to about 80% of the weight of a human skeleton. The outer shell surrounding the cancellous bone at the end of the joints is also made up of cortical bone.
Once bone tissues develop, they are continuously renewed by old bone resorption by osteoclasts and new bone formation by osteoblasts. This process is called “bone remodeling” (Figure 3). Bone remodeling is important for bone mass homeostasis, and is essential for maintenance of healthy bone. During bone remodeling, primary cancellous bone, which is formed by cartilaginous trabecula, is replaced by secondary cancellous bone. The latter has thicker trabecula, and smaller trabecula number than that of primary cancellous bone (Figure 2). Disruption of ideal balance in bone remodeling causes abnormal bone mass such as osteopetrosis and osteoporosis. Apparently, many genetic factors, environmental and hormonal factors, and their interactions are involved in the bone remodeling. Studies of human rare variants exhibiting late-onset severe phenotypes associated with loss of bone mineral density (BMD) have successfully identified genes responsible for bone homeostasis. Some studies disclosed that osteoporosis results, in
part, from the overproduction of receptor activator of nuclear factor kappa-B (RANK) ligand and other cytokines/mediators regulating osteoclast differentiation and function (Ragab et al., 2002; Han et al., 2005; Zaidi et al., 2007).
In parallel, several epidemiological studies of human populations showed that BMD is important risk factor for osteoporotic fractures. A series of longitudinal studies have revealed that BMD at any time is a function of the rate of acquisition of peak (highest) bone mass in the early growth phase of bone and the subsequent rate of bone loss during adulthood. Although environmental and hormonal factors affect bone turnover, the final adult bone mass is mostly determined by the process referred to as peak bone acquisition (Lloyd et al. 1999; Nguyen et al. 2000). Extensive studies have also revealed genetic influence on variation in BMD of adult skeleton based on twin analysis, multi-generational family and sib-pair analyses (Arden et al. 1996; Barthe et al. 1999; Christian et al. 1989; Cohen-Solal et al. 1998; Danielson et al. 1999; Eisman et al. 1993; Ferrari et al. 1998; McKay et al. 1994; Seeman et al. 1989; Slemenda et al. 1991; Smith et al. 1973). These studies, collectively, showed that more than half of variation in the early phase of skeletal accumulation, which occurs over a short time period during puberty, is determined predominantly by genetic factors (Pocock et al. 1987; Ferrari et al. 1998).
Although identifying genetic factors controlling human bone homeostasis could have huge biomedical and social implications, progress of the studies has been relatively slow, except for the studies of human rare
variants with severe bone phenotypes. Measurements of BMD, together with genotyping of alleles for single nucleotide polymorphisms (SNPs), have provided genomic linkage evidence. For example, meta-analyses of Genome Wide Association Studies (GWAS) (Hardy et al. 2009; Beamer et al. 2012) with large comparable populations have demonstrated that numerous loci are associated with the bone phenotypes, and some loci are common to different populations (Styrkarsdottir et al. 2006; Lee et al. 2009; Rivadeneira et al. 2009; Styrkarsdottir et al. 2010). Thus far, it has turned out that bone homeostasis is a complex quantitative trait. Furthermore, the number of genes involved in skeletal regulation is extensive, and the effect size of any one gene appears relatively modest. Identification of each gene involving human bone homeostasis has been hampered by human genome heterogeneity, phenotypic heterogeneity, environmental factors, population sample sizes, sex-based differences, age-related differences and ethnicity.
Recent advance in X-ray micro-computed tomography (micro-CT) has allowed us to analyze three-dimensional (3D) structure of the cancellous bones without tissue destruction. Such studies have indicated that the risk of bone fractures in human increases as BMD decreases, but there is a considerable overlap in the BMD measurements between patients with or without bone fractures (Legrand et al 2000). Therefore, the biomechanical competence of cancellous bone is dependent not only on BMD as the absolute amount of bone mass, but also on the 3D microstructure of cancellous bone. This fact suggests that we need to pay more attention to bone microstructure for identifying genetic risk factors for osteoporosis. Until the X-ray micro-CT
was developed, cancellous bone microstructure had been evaluated by conventional two-dimensional (2D) histological sections. Recent study showed that there is a very good correlation between the bone microstructural measure obtained from 3D X-ray micro-CT and that from histological 2D sections (Thonsen et al, 2005). In particular, excellent correlations were found for bone volume fraction (BV/TV), which is the measure the ratio of the cancellous bone volume to the total volume of interest (see Figure 4).
Forward genetics approaches to explore genetic factors responsible for bone homeostasis can be efficiently pursued in animal models. Usage of the animal models enables to control genome heterogeneity and environmental factors, and improves the power to identify heritable regulation of bone homeostasis. Inbred strains of mice represent a superior animal model with a short lifespan, short generation time, and lower maintenance costs than other mammals. The mouse genome has become highly defined (Waterson et al. 2002), especially with respect to SNP information among the various inbred strains (Keane et al. 2011). Variations in genome sequences and bone phenotypes among different inbred strains of mice are amenable to genetic analyses of polygenic traits of bone phenotypes via the quantitative trait loci (QTL) analysis (Lander and Botstein. 1989). Segments of many mouse and human chromosomes have been identified with homologous linked loci, known as synteny (Blake et al. 2000), which bridges genetic information between mouse and human. As the human and mouse genome sequences become available, identification of human
counterparts corresponding to mouse responsible loci and testing of candidate genes become even more easily accomplished. Such experimental studies with inbred mouse strains to ascertain numbers and linkage of loci affecting BMD have been conducted by QTL analyses. Thus far, analyses for many crosses between different inbred strains have revealed numerous loci responsible for BMD on many chromosomes (Klein et al. 1998, 2001; Beamer et al. 1999, 2001; Shultz et al. 2003).
Several studies have also employed X-ray micro-CT for evaluation of cancellous bone microstructure of mice. Halloran et al. reported in their pioneering study using X-ray micro-CT that a standard inbred mouse strain C57BL/6J (B6) shows age-dependent change in bone mass and structure, which are similar to that seen in human (Halloran et al. 2002). They also noted that cancellous bone loss in mouse is observed even in the early bone growth phase. Furthermore, the rapid early loss of cancellous bone suggests that bone loss is not just associated with old age in mouse, but rather occurs continuously from the early growth phase. In fact, the cancellous bone volume started to decrease at 6 weeks of age (see Figure 7). By contrast, BMD of cancellous bone increases from 6 weeks of age to 12 months of age, but then remained relatively constant into old age. These findings are consistent with facts that cancellous bone is highly sensitive to change of bone metabolism, and is easily fractured in human elders (Suda et al. 2007). After the method of X-ray micro-CT was established for evaluation of bone microstructure, several studies have revealed QTLs that affect bone
microstructure of mouse cancellous bone (Turner et al., 2001; Bouxsein et al., 2004; Bower et al., 2006; Beamer et al., 2012).
In this study, I focused on genetic factors responsible for variation in microstructure of mouse cancellous bone. For this purpose, I carried out phenotyping of cancellous bone volume of inbred strains of mice and their derived consomic strains, also known as chromosome substitution strains, using X-ray micro-CT at the early growth phase of 6 to 10 weeks of age, because the early growth phase is critical for bone density and microstructure at any time in the later stages. The genes that regulate bone formation during embryonic development and the genes involved in bone homeostasis in the later stage have been extensively studied so far as mentioned above. By contrast, there is only limited information for genes that act in osteogenesis and homeostasis at the early and growing phase in mice. This is another reason that I focus on the early growth phase.
With respect to inbred strains of mouse for genetic analyses, I relied on genome diversity of two strains, B6 and MSM/Ms. The latter strain was established from the Japanese wild mouse, Mus musculus molossinus (Moriwaki et al, 2009). M. m. molossinus has mosaic genome, majority of which originated from M. m. musculus, ranging from Eastern Europe to Far East and the remainder from M. m. castaneus, ranging in Southeast Asia (Yonekawa et al. 2012). Many studies have shown that M. m. musculus is genetically distant from west European subspecies M. m. domesticus (Abe et al. 2004; Sakai et al. 2005; Takada and Shiroishi, 2012). The time of divergence between M. m. domesticus and M. m. musculus is estimated to be
approximately 0.5 to 1.0 million years (Moriwaki, 1994; Yonekawa et al. 1980), which has resulted in a great genomic difference (~1% divergence) between B6 and MSM/Ms. More than ten million SNPs have been identified between these two strains, and the SNP data are now available to the public
on NIG Mouse Genome Database
(http://molossinus.lab.nig.ac.jp/msmdb/index.jsp). As a consequence of its genome divergence from B6, MSM/Ms appeared to have unique complex traits never observed in standard laboratory strains (Moriwaki, 1994; Moriwaki et al. 1999; Yonekawa et al. 1980, 1994; Takada et al. 2008). Additionally, this strain was selected as one of target strains in the Mouse Phenome Project of the Jackson Laboratory, and the accumulated phenotypic data are now available online (Grubb et al. 2009; Paigen, 2003). The MSM/Ms strain likely bears additional intriguing phenotypes that are specific to M. m. molossinus and not found in other mouse subspecies.
Another great advantage to rely on the genome diversity between B6 and MSM/Ms is that a full set of consomic strains, in which every B6 chromosome is replaced by counterpart of MSM/Ms, is now established and available for exploring QTLs (Takada et al, 2008, 2012; Nadeau et al. 2012). The inter-subspecific large-genome divergence and phenotypic differences between the two strains has allowed the identification of vast amount of QTLs by comprehensive phenotype screening. Indeed, many complex quantitative traits have been successfully dissected into multiple chromosomes as listed in NIG mouse phenotype database (http://molossinus.lab.nig.ac.jp/phenotype/index.html).
Phenotyping of microstructure of cancellous bone at 10 weeks of age by X-ray micro-CT showed that MSM/Ms has far smaller value of bone volume fraction (BV/TV) than that of B6. This finding prompted me to carry out systematic phenotype screening of the same trait for the full set of B6-MSM/Ms consomic strains. As a result, I found that among all consomic strains B6-Chr15MSM carrying MSM/Ms-derive chromosome 15 (Chr15) shows smallest cancellous bone volume fraction, indicating that mouse Chr15 harbors QTLs affecting bone microstructure, which is likely relevant to bone physical strength. Next, in order to further dissect genetic factors into sub-regions of Chr15, I generated nested sub-consomic strains that harbor sub-divided fragments of MSM/Ms Chr15. Bone phenotyping of these strains revealed that at least four chromosomal blocks of Chr15 genetically control the trait of cancellous bone microstructure. I named them Block 1 to 4, each of which possibly contains at least one QTL affecting microstructure of cancellous bone. None of these four QTLs has been reported by other groups’ previous studies. It is of interest to note that the MSM/Ms alleles at the QTLs in the Block 2, 3 and 4 decrease the bone volume fraction (BV/TV) relative to B6 as were expected, but the MSM/Ms allele at the QTL in Block 1 rather increases the BV/TV value relative to B6. Thus, the analysis with the sub-consomic strains revealed marked complexity of genetic architecture to control cancellous bone microstructure in mouse.
Finally, I paid special attention to one sub-block included in Block 1, the interval of which is defined by difference in the MSM/Ms-derived fragments of two sub-consomic strains. I intensively explored candidates of
the causative gene for the QTL in this sub-block, because there is no known gene involved in bone regulation and homeostasis in this interval. I identified seven genes as candidates, which likely regulate cancellous bone microstructure at the early bone growth phase and are critical for determining physical strength of bone. In particular, four of them seem to be good candidates from the aspects of gene expression difference and amino acid changes between B6 and MSM/Ms strains. Thus, this study provides indispensable clues for understanding genetic architecture underlying bone homeostasis of mouse, and for searching genetic factors responsible for osteoporosis in human.
The technical terms used in this study and their descriptions are listed in Table 1.
3. MATERIALS AND METHODS 3. MATERIALS AND METHODS 3. MATERIALS AND METHODS 3. MATERIALS AND METHODS
Animals Animals Animals Animals
The Animal Care and Use Committee of National Institute of Genetics (NIG) approved all of the animal experiments. Development of a full set of consomic strains was reported previously (Takada et al. 2008). Briefly, each consomic strain has the C57BL/6J (B6) genome except for one chromosome that is replaced by corresponding chromosome of MSM/Ms. The full set of consomic strains, denoted consomic panel, was established in collaboration of the NIG and The Tokyo Metropolitan Institute of Medical Science, and now is maintained in NIG and available to the public of scientific community. B6 was purchased from CLEA Japan (CLEA Japan, Inc.) and maintained at NIG. According to the consomic nomenclature, each strain was named B6-ChrNMSM, where N is the number of the chromosome transferred from MSM/Ms. All animals ware maintained under the 12h light/dark cycle (light period, 06:00-18:00; dark period, 18:00-06-00) in a temperature (23 ± 2°C) and humidity (50 ± 10%) controlled room. All mice were weaned after 4 weeks of age and housed individually in standard plastic cages on wood chips, and fed standard diet, CE-2 (CLEA Japan Inc.).
Construction of sub Construction of sub Construction of sub
Construction of sub----consomic strainsconsomic strainsconsomic strainsconsomic strains
Sub-consomic strains that have subdivided MSM/Ms-derived chromosome 15 (Chr15) were generated by cross of B6 and B6-Chr15MSM (abbreviated C15). The resultant F1 hybrid mice were then genotyped for the single nucleotide
(SNP) marker loci, and the heterozygous mice with appropriate recombinant breakpoint were intercrossed to obtain homozygotes of the recombinant Chr15 on the B6 genetic background. Established sub-consomic strains were named B6-Chr15MSM-X (abbreviated Sub-X), and maintained as homozygous lines.
Genotyping Genotyping Genotyping Genotyping
Genotyping of mice was carried out by Mass ARRAY system (SEQUENOM Inc.) according to the maker’s instructions. To assign detailed recombinant breakpoints in chromosome 15 between B6 and MSM/Ms in the sub-consomic strains, I used DNA markers listed in Table 3. For determining fine borders of Sub-block 1-1, which is defined by the two sub-consomic strains, Sub-17 and Sub-11, I designed primer sets to detect size difference in PCR-amplified products, which resulted from structural variants, e.g. in/del, between B6 and MSM/Ms genomes (Table 7).
X X X
X----ray mray mray micro computed tomographyray micro computed tomographyicro computed tomographyicro computed tomography (micro(micro(micro----CT)(microCT)CT)CT)
All mice were sacrificed at indicated age. Bone samples were dissected and fixed in 10% formalin in phosphate buffered saline without calcium and magnesium (PBS (-)) for 24h and then replaced in PBS (-). Bone architecture in metaphysis of proximal tibia was scanned by X-ray micro computed tomography (micro-CT), ScanXmate-E090S in vivo, (Comscantecno Co., Ltd.) at tube voltage peak of 60 kVp, tube current of 130 µA. Samples were rotated 360° in steps of 0.6°, generating 600 projection images of 480 x 640 pixels.
The X-ray micro-CT data were reconstructed at an isotropic resolution of 10.057x10.057x10.057 µm3. Volume rendering images were reconstructed using the TRI/3D-BON software (RATOC SYSTEM ENGINEERING Co., Ltd.). For assessment of microstructure of cancellous bone, I measured the bone volume fraction (%), bone volume/total volume (BV/TV), following the reported guideline for assessment of bone microstructure in rodents using X-ray micro-CT (Bousein et al. 2010).
Frozen section and histological analysis Frozen section and histological analysis Frozen section and histological analysis Frozen section and histological analysis
The adult mice were sacrificed by carbon dioxide (CO2). The hind leg was dissected and rapidly frozen in hexan cooled with dry ice. Frozen samples were embedded in SCEM compound (SECTION-LAB Co., Ltd.). I made frozen sections (3µm thick) of complete calcified bone tissues without demineralization using CM3000 cryostat and disposable tungsten carbide blade (Leica Microsystems) as previously described (Kawamoto 1990, Kawamoto and Shimizu 2000). For histological staining, the sections were washed with DW, dehydrate with 100% ethanol and placed in vacuum chamber to remove air bubbles from the tissues for 2min, and fixed with 10% formalin for 2min. These sections were stained with 0.01% toluidine blue (pH7.0) (Muto Pure Chemicals) for 10 to 20 sec, rinsed with tap water for 10 min, and mounted with glycerin.
RT RT RT
RT----PCR and PCR and PCR and PCR and quantitative analysis of gquantitative analysis of gquantitative analysis of gquantitative analysis of gene expression in ene expression in ene expression in boneene expression in bonebone bone
Total RNA was isolated from a tibia. Soft tissue attached to the tibia was
removed as much as possible. Dissected bone was immediately frozen by liquid nitrogen and crushed in Trizol (Invitrogen) using TissueLyzer II (QIAGEN). Disruption was carried out in high-speed (30 Hz: 1800 oscillations/minute) shaking steps for 6 min. RNA preparation was performed according to manufacturer’s recommendation except for ethanol precipitation step. For this step, I used 8M lithium chloride, not 3M sodium acetate. Total RNA was dissolved the diethylpyrocarbonate (DEPC) treated DDW. Messenger RNA (mRNA) was isolated from total RNA using the Dynabeads mRNA purification Kit (Dynabeads, Invitrogen). Complementary DNA (cDNA) was synthesized using mRNA and PrimeScript RT reagent Kit (TaKaRa), according to the manufacturer’s instructions. PCR was carried out using KAPA taq (Nippon Genetics) and Thermal Cycler Dice standard (TaKaRa). PCR condition was followed; 3min at 94°C and 30 cycles of amplification (denature step 94°C for 30 sec; annealing step, 55°C for 30 sec; extension step, 72°C for 3 min). The expression levels of several gene transcripts were assayed by quantitative real time polymerase chain reaction (qRT-PCR) amplification with SYBR Premix Ex Tap II (TaKaRa) and thermal cycler Dicer real time system (TaKaRa). Condition of qRT-PCR was followed: 30 sec at 95°C, 40 cycles of amplification step (denature step 95°C for 5 sec; annealing/extension step, 60°C for 30 sec) and dissociation step (95°C for 15 sec). All qRT-PCR reactions were carried out at least in duplicate and validated by the presence of a single peak in the melt curve analysis. The Rps18 RNA was used to normalize variations in the input cDNA. The 2(-Delta Delta C(T)) method (Livak et al. 2001) was used to perform quantitative relative
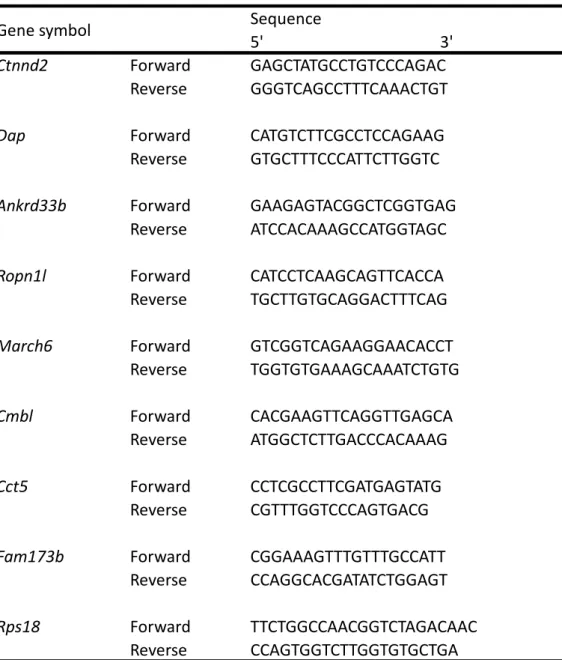
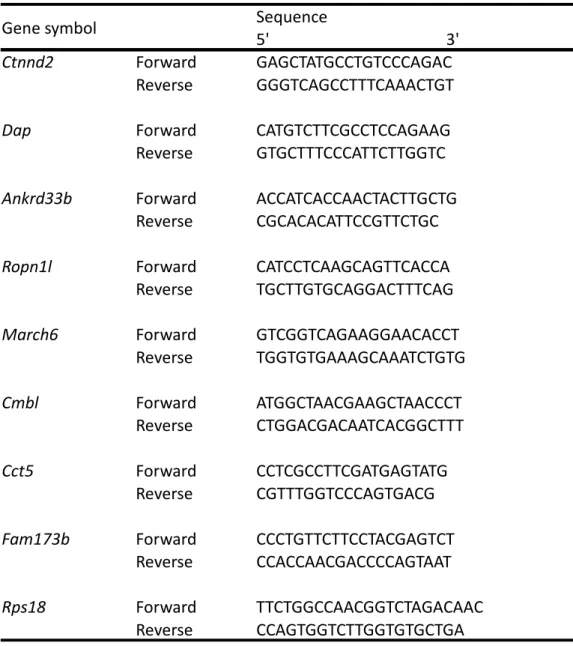
expression analyses. Primer sets used for PCR and qRT-PCR are designed by
Primer3 plus program
(http://www.bioinformatics.nl/cgi-bin/primer3plus/primer3plus.cgi) or are obtained from Primer Bank (http://pga.mgh.harvard.edu/primerbank/). Primer set for Rps18 was purchased from TAKARA BIO INC. (TaKaRa). All primer sequences are listed in Table 8 and Table 9.
Compression test Compression test Compression test Compression test
Dissected tibia was saved at -80°C until use. Soft tissues were removed from the tibia as much as possible. The physical strength of proximal tibia was evaluated by the compression test using a materials-testing machine, MZ-500S (Maruto Co. Ltd.). The tibia was placed on the loading platform, which was moved upward for load-cell (sensor, 500 kgf) at the rate of 5 mm/min. Force-Displacement data, maximum stress value and integrated stress value were analyzed by CTRwin Ver.1.05 software (System Supply Co. Ltd.).
Statistically analysis Statistically analysis Statistically analysis Statistically analysis
All data were expressed as means ± SD. Statistical analysis was performed Student’s t-test with Welch’s correction. Values of p < 0.05 were considered significant. Significance was declared when p < 0.005 (p of 0.05/10 multiple comparisons) in figure 10 and 11 or p < 0.016 (p of 0.05/3 multiple comparisons) in figure 15 were observed. The means with p value between 0.05 and 0.005 in figure 10 and 11 were declared suggestively significant.
4. RESULTS 4. RESULTS 4. RESULTS 4. RESULTS
4.1 4.1 4.1
4.1 Consomic analysis of mouse phenotype of cancellous bone Consomic analysis of mouse phenotype of cancellous bone Consomic analysis of mouse phenotype of cancellous bone Consomic analysis of mouse phenotype of cancellous bone microstructure
microstructure microstructure microstructure
The main aim of this study is to elucidate genetic architecture controlling bone homeostasis. Because accumulating reports have shown that cancellous (trabecular) bone microstructure of the early growth phase is critical for biomechanical competence in adult skeleton, and is a major risk factor of human osteoporotic fracture, I focused on mouse bone phenotype at 6 to 10 weeks of age. First, I compared cancellous bone microstructure of MSM/Ms with that of B6, relying on the genome difference between the two strains. I used X-ray micro-CT to measure bone phenotype of a long bone, tibia. The detailed protocol for the measurement is described in the Materials and Methods. Briefly, I dissected tibia from MSM/Ms and B6 at 10 weeks of age, and scanned them with X-ray micro-CT. In this analysis, I used only male samples to exclude the secondary effects by hormonal factors. Then, I quantified cancellous bone volume fraction (BV/TV) of the proximal tibia from the X-ray micro-CT data. In particular, bone volume fraction was calculated by cancellous bone volume adjusted for the volume of marrow cavity with 1mm in width, just beneath the growth plate and excluding the segment of the primary cancellous bone (Figure 4). As shown in Figure 5(A) and 5(B), the BV/TV values are significantly different between the two strains. The BV/TV of B6 is 18.5 ± 4.6%, whereas that of MSM/MS is 9.0 ± 2.8%.
As the cancellous bone microstructure was expected to be complex quantitative traits, I intended to figure out entire genetic architecture underlying the difference between B6 and MSM/Ms at the whole genome level. To do this, I conducted phenotype screening for a full set of B6-ChrNMSM consomic strains using the same protocol of the X-ray micro-CT as used in the comparison between B6 and MSM/Ms. The result of this analysis is summarized in (Table 2 and Figure 5(C)). In Figure 5(C), I aligned the all consomic strains, B6 and MSM/Ms in the order of the BV/TV value as the strain with lowest value is placed in the left side and the highest in the right side. All the consomic strains are distributed between MSM/Ms with the lowest value and B6 with the highest value, showing continuous slope of the BV/TV value. The value of the F1 hybrid of B6 and MSM/Ms is very close to that of B6. Among all consomic strains, B6-Chr15MSM (abbreviated C15 hereafter) that has MSM/Ms-derive Chr15 shows the lowest BV/TV value (9.1 ± 0.3%), which is almost same level of that of MSM/Ms (9.0 ± 2.8%). This result indicated that mouse Chr15 contains QTL(s) with strong effect on the cancellous bone microstructure, and the Chr15 of MSM/Ms tends to decrease the BV/TV value relative to B6.
4.24.2
4.24.2 Characterization of consomic strain B6Characterization of consomic strain B6Characterization of consomic strain B6Characterization of consomic strain B6----Chr15Chr15Chr15Chr15MSMMSMMSMMSM (C15)(C15)(C15) (C15)
Although the consomic strain C15 showed the lowest BV/TV value, some other strains such as C4, C14 and C2 also showed lower BV/TV values than B6. To examine whether the low BV/TV value is correlated with mouse external morphology, I measured body size (length) and body weight of these
consomic strains with the lower BV/TV values. The result clearly showed that only C15 has almost same body length and body weight as B6 (Figure 6), but three other strains have shorter body length and lower body weight than B6 (data not shown). The result suggested that the lower BV/TV values of C4, C14 and C2 are caused by secondary effects of the small body size and body weight. In order to explore QTLs responsible for the phenotypic difference in bone microstructure without influence of the secondary effects, hereafter I focused on C15 for further genetic analyses.
First, I examined age-dependent change of cancellous bone volume fraction. I measured the BV/TV value of tibia of B6 and C15 at 6, 10, 14 and 25 weeks of age. The values of both strains started to decrease at 6 weeks of age, and were gradually reduced thereafter as aging proceeds. At all the time points, C15 showed lower values than those of B6 (Figure 7), although the difference was not statistically significant in later stages at 14 and 25 weeks of age. The X-ray micro-CT images of the cancellous bone of B6 and C15 at these different time points are shown in Figure 8.
Next, I examined whether the low BV/TV value of C15 correlates with biomechanical competence of bone. Therefore, I analyzed whether the low BV/TV value affects physical strength of the tibia. For this purpose, I employed compression test for tibia of B6 and C15 strains at 10 weeks of age. In this test, isolated tibia is mechanically compressed by two plates (Figure 9(A)). When tibia is pressed up, the bone pushes back the plates toward both top and bottom. A sensor attached at the upper plate records displacement-dependent stress change (Figure 9(B)). I extracted two
parameters, maximum stress (N) and integrated stress value (N.mm). Physical strength of bone increases as the values of the two parameters goes up. The C15 tibia showed 0.75-fold and 0.78-fold smaller values of N and N.mm than those of B6, respectively (Figure 9 (C) and (D)). This result demonstrated that the tibial physical strength of C15 is weaker than that of B6, and suggested that low cancellous bone volume fraction may affect physical strength of mouse tibia.
4.3 4.3 4.3
4.3 Genetic dissection of phenotypic difference in the cancellous bone Genetic dissection of phenotypic difference in the cancellous bone Genetic dissection of phenotypic difference in the cancellous bone Genetic dissection of phenotypic difference in the cancellous bone microstructure with C15
microstructure with C15 microstructure with C15
microstructure with C15----derived subderived subderived subderived sub----consomic strainsconsomic strainsconsomic strains consomic strains
The results of characterization of consomic strain C15 indicated presence of QTL(s) that controls the cancellous bone microstructure. To investigate whether a single major gene is responsible for the C15 phenotype or multiple genes confer the phenotype, I constructed a number of sub-consomic strains that harbor various lengths of MSM/Ms-derived fragments of Chr15. The detail of the mating scheme for construction of the sub-consomic strains is described in the Materials and Methods. In total, I successfully established 9 sub-consomic strains. These strains are fully fertile, and have no reproductive problem.
Since the difference in the cancellous bone volume fraction between B6 and the original consomic strain C15 was observed at as early as 6 weeks of age, I carried out bone phenotyping of these sub-consomic strains at 6 weeks of age using X-ray micro-CT. In particular, I measured the BV/TV value of the proximal tibia, as was done in the previous analyses of C15. The
result is summarized in Figure 10. In this figure, all the sub-consomic strains, B6 and C15 are aligned in the way such that two neighboring strains have minimum difference in the C15 (MSM/Ms)-derived chromosomal fragments. The recombination breakpoints that define the borders between B6 and MSM/Ms fragments in the sub-consomic strains are indicated alphabetically on the top of the strain alignment. The genomic information of DNA markers used for determining borders of B6 and MSM/Ms fragments is summarized in Table 3. In order to assign chromosomal fragments that contain QTL(s) responsible for the difference in the BV/TV value between B6 and C15, I compared the BV/TV value between two neighboring sub consomic strains for the every pairs. As a result, five pairs showed significant difference in the BV/TV value. The most significant (p < 1.3 x 10⁻⁴) difference was detected in the pair of C15 vs Sub-5. The statistical significance still remains even after most conservative adjustment for Bonferroni correction. Interestingly, the MSM/Ms fragment rather raises the BV/TV value relative to the B6 fragment. In other three pairs, Sub-8 vs Sub-9, Sub-10 vs B6, and B6 vs Sub-20, the B6 fragments raise the BV/TV value relative to MSM/Ms fragments, consistent with the fact that B6 has higher BV/TV value than C15 (MSM/Ms). In remaining one pair, Sub-17 vs Sub-11, the MSM/Ms fragment in the short interval defined by the difference between these two strains raises the BV/TV value for the B6 fragment, as is the case in the pair of C15 vs Sub-5. This short interval is completely included in that defined by the difference in the pair of C15 vs Sub-5.
In order to clarify positional relationship among the chromosomal
intervals delineated by the five pairs, I extracted these five pairs of the two neighboring sub-consomic strains and realigned the pairs (Figure 11). From this figure, it appeared that there are non-overlapping four chromosomal blocks. I named these blocks, Block 1 to Block 4, from the proximal (centromeric) side to the distal (telomeric) side of Chr15. These four blocks possibly contain different QTL(s) one another controlling the BV/TV value and cancellous bone microstructure. The Block 1 was further sub-divided into two parts by the presence of interval defined by the pair of Sub-17 vs Sub-11. I named this distal part of the Block 1, Sub-block 1-1. As mentioned above, the phenotypic effects of the MSM/Ms fragments in the Block 1 and the Sub-block 1-1 show the same direction, that is, both raise the BV/TV value for the corresponding B6 fragments. Therefore, the QTL responsible for the phenotypic effect of the Sub-block 1-1 is likely identical to that in Block 1 or to one of the multiple QTLs in Block 1. The physical positions in the mouse genome and length of three Blocks and Sub-block 1-1 are listed in Table 4. This table also includes information of number of protein coding genes and known genes to have bone metabolism-related function in the four blocks. Sub-block 1-1 has the shortest size (3.49Mb) among the all blocks, and contains no gene known to function for bone regulation and metabolism.
4.4 4.4 4.4
4.4 Exploration oExploration oExploration oExploration of candidates of the causative genes for the QTL in f candidates of the causative genes for the QTL in f candidates of the causative genes for the QTL in f candidates of the causative genes for the QTL in SubSub
SubSub----block 1block 1block 1block 1----111 1
The Sub-block 1-1 is very short in size, and no functionally known genes are assigned in this region. These facts prompted me to explore candidates of the
causative gene for QTL in the Sub-block 1-1. By in silico analysis, I immediately found that Sub-block-1 is a gene desert region, and only eight protein coding genes are located (Table 5). They are Ctnnd2, Dap, Ankrd33b, Ropn1l, March6, Cmbl, Cct5 and Fam173b. At present, molecular functions of these genes are poorly annotated. To judge whether all 8 genes are candidates responsible for the strain difference in the BV/TV value of the proximal tibia, I investigated expression of the 8 genes in whole bone tissue of tibia dissected from B6, C15, Sub-17 and Sub-11 strains by RT-PCR. As shown in Figure 12, seven genes, Dap, Ankrd33b, Ropn1l, March6, Cmbl, Cct5 and Fam173b, are expressed in tibia of all strains, but one gene Ctnnd2 is not expressed in tibia, suggesting that Ctnnd2 is excluded from the candidates genes. Furthermore, I examined which position in the whole bone tissue of tibia the 7 genes are expressed. To do this, I flushed out bone marrow including cells of hematopoietic and adipogenic lineages from the whole bone tissue of B6, and mRNA was prepared separately from bone tissue alone and bone marrow. The result of RT-PCR indicated that expressions of all 7 genes are observed both in the bone tissue and bone marrow (Figure 12).
There are two types of genetic variation as the causality of the candidate gene. First one is allelic difference in expression level of the candidate gene. Another one is amino acid substitution in critical sites for the protein function. In order to narrow down the 7 candidate genes, first I examined whether expression levels of the 7 genes in the whole bone tissue of tibia reflect the phenotypic difference in the BV/TV value. To do this, I
carried out qRT-PCR to compare the expression level of each gene between B6 and C15 and between Sub-17 and Sub-11, respectively. The result is summarized in Figure 13, Ropn1l and Fam173b showed significantly higher expression level in the B6 allele than in the MSM/Ms allele in the both comparing pairs. March6 showed higher expression level in the B6 allele than in MSM/Ms allele only in the comparing pair of B6 vs C15 (Figure 13(A)), whereas Ankrd33b showed higher expression level in the MSM/Ms allele than in the B6 allele in the comparing pair of Sub-17 vs Sub-11 (Figure 13(B)). This result indicated that the flanking genomic regions may influence gene expression of March6 and Ankrd33b. It is noted that in the pair of Sub-17 vs Sub-11, expression level of Ankard33b is higher in the MSM/Ms allele than in the B6 allele, but this difference disappeared in the comparing pair of B6 vs C15. Other 3 genes, Dap, Cmbl and Cct5, showed no significant difference in the expression levels in the both comparing pairs.
Next, to examine whether the second type of genetic variation causes strain difference in the cancellous bone phenotype, I carried out in silico analysis to explore nucleotide sequence variations between B6 and MSM/Ms genomes for the 7 candidate genes. I found that four candidate genes, Ankrd33b, Ropn1l, Cmbl and Fam173b, show non-synonymous substitutions leading to amino acid changes (Table 5, Figure 14). Notably, the change of methionine to leucine at the amino acid residue 207th in Ankrd33b is located within functional domain, ankyrin repeat 4. This is only amino acid substitution found in functional domains among the 7 candidate genes.
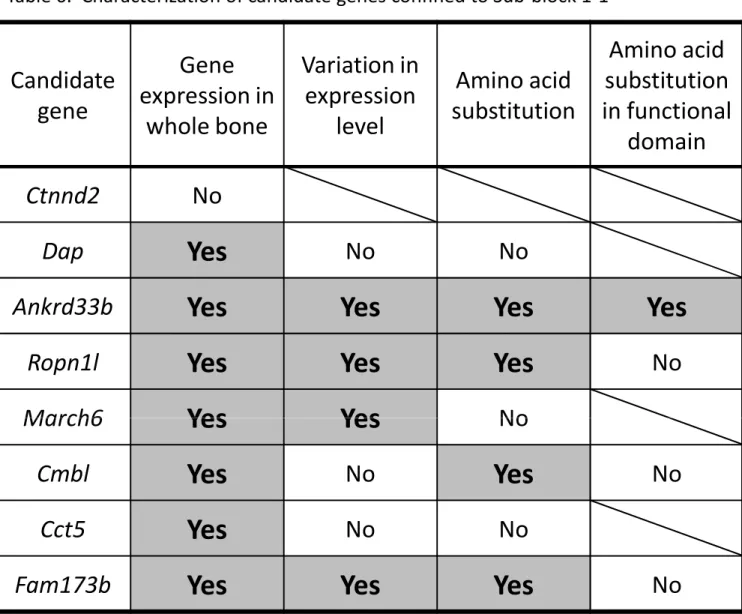
Considering the two aspects of genetic variations as the causality of
the candidate gene, I summarized the results of characterization of the candidate genes (Table 6). I infered that four genes, Ankrd33b, Ropn1l, March6 and Fam173b, are good candidates from the aspects of the two criteria, gene expression level and amino acid substitution, although the causative gene is not required to simultaneously fulfill the two criteria.
5. DISCUSSION 5. DISCUSSION 5. DISCUSSION 5. DISCUSSION
5.1 5.1 5.1
5.1 Complexity of genetic architecture controlling cancellous bone Complexity of genetic architecture controlling cancellous bone Complexity of genetic architecture controlling cancellous bone Complexity of genetic architecture controlling cancellous bone microstructure
microstructure microstructure microstructure
Elucidation of genetic architecture of complex quantitative traits and discovery of the genes underlying phenotypic variation and disease risk is new challenge in modern genetics. Genome wide association study (GWAS) for human populations has had recent success identifying susceptibility alleles for genetically complex disease (Seal et al. 2006; Erkko et al. 2007; Rahman et al. 2007; Di Bernardo et al. 2008; Tomlinson et al. 2008). However, the benefits of additional GWAS have recently been questioned (Goldstein 2009; McClellan and King 2010), because many complications, including non-additive gene interactions (epistasis), genetic heterogeneity and low penetrance, as well as technical difficulties such as limited sample size, appeared to hamper GWAS (Phillips 2008; Mackay et al. 2009; Manolio et al. 2009; Nadeau 2009; McClellan and King 2010).
It is proposed that genetic analysis with consomic strains, also known as chromosome substitution strains, of model organisms provides a novel paradigm for studying complex quantitative traits. In particular, mouse consomic strains dramatically reduce genetic heterogeneity for target complex traits while simultaneously facilitating the detection of QTLs with additive and non-additive (epistatic) effects (Shao et al. 2008; Takada and Shiroishi 2012).
In this study, I conducted genetic dissection of phenotypic variation in cancellous (trabecular) bone microstructure, which is known to be typical complex quantitative trait and an important risk factor of osteoporotic fracture. For this purpose, I carried out phenotype screening of a full set of mouse consomic strains, B6-ChrNMSM, which were constructed from genetically distant two parental strains, B6 and MSM/Ms. I used X-ray micro-CT technology to measure cancellous bone microstructure of proximal tibia. The marked difference in the BV/TV value, which is precise measure of cancellous bone volume adjusted for the volume of marrow cavity, between B6 and MSM/Ms, enabled pursuing further genetic dissection of the bone phenotype with the consomic strains. The primary phenotype screening showed that many consomic strains have lower BV/TV value than that of B6 strain (Figure 5c). This indicates that many genetic factors in multiple chromosomes are involved in determining cancellous bone microstructure in mouse.
Because consomic strain C15 has the lowest BV/TV value and its body size and body weight are almost same as those of B6, I focused on chromosome 15 for further genetic analysis of the bone phenotype with C15-derived sub-consomic strains. This study finally identified four QTLs (one highly significant and three suggestive), all of which affect cancellous bone volume fraction. None of these four QTLs has been reported by other groups’ previous studies. One reason for this is that QTL analyses of mouse bone phenotypes have so far been made by genetic crosses between two standard laboratory strains, but wild-derived strains have never been used
in the experimental crosses. Therefore, the use of unique MSM/Ms strain might contribute to detection of the novel QTLs in this study.
The phenotypes of most sub-consomic strains derived from the original consomic strain C15 can be explained by additive effects of the indentified four QTLs. One exception is Sub-6 that harbors Block 3 and 4, but not Block2 (Figure 10). I observed no difference in the BV/TV value between Sub-6 and Sub-5 that harbors Block 2 as well as Block 3 and 4. At present I have no data to interpret this contradiction. There may be two possibilities. First one is that in the interval defined by two breakpoints, c and d, has another QTL, and its MSM/Ms allele raises the BV/TV value relative to B6, as is the case in the Block 1. Another possibility is that fragment outside of Block 2 may influence the effect of the QTL in Block 2. Such non-additive interactions (epistasis), in other words context-dependent phenotypic effects, are often observed in the QTL analyses of complex quantitative traits in mouse (Shao et al. 2008; Takada and Shiroishi 2012).
In the beginning of the phenotype screening for the sub-consomic strains, I supposed that MSM/Ms has alleles exclusively to decrease the BV/TV value (relative to B6 alleles) at all QTLs in Chr15. The result clearly showed that this is not the case. The MSM/Ms allele at the QTL in Block 1 (or Sub-block 1-1), identified by comparison of the pair of Sub-5 vs C15 (or Sub-17 vs Sub-11), rather raises the BV/TV value relative to B6. Indeed, Sub-15 that harbors the MSM/Ms-derived three blocks, Block 2, 3 and 4, all of which decrease the BV/TV value, but not the Block 1, exhibits significantly lower BV/TV value (11.5 ± 0.7%) than that (13.9 ± 1.9%) of the original
consomic strain C15. Although there is no sub-consomic strain that harbor only MSM/Ms-derived Sub-block 1-1 on the B6 Chr15 background, I infer that such strain should have even higher BV/TV value than that of B6. The low BV/TV value of MSM/Ms is summation of phenotypic effects of many genes to up- and down-regulate cancellous bone volume, and the MSM/Ms genome may have similar alleles to raise BV/TV value in other chromosomes.
All results of this study collectively demonstrated that mouse genome has a numerous genes regulating cancellous bone metabolism. Considering phenotypic effects of the four QTLs identified in Chr15, many other QTLs may have modest effects on the bone phenotypes. It would be very hard to detect such QTLs by linkage analysis by general outcross experimetns, F1
intercross and backcross. Thus, this study revealed marked complexity of genetic architecture to control cancellous bone microstructure in mouse, and demonstrated that analysis with consomic and sub-consomic strains has strong power to extract each of numerous QTLs, even if its phenotypic effect is modest.
5.25.2
5.25.2 Toward discovery of causative gene fToward discovery of causative gene fToward discovery of causative gene fToward discovery of causative gene for QTL in Subor QTL in Subor QTL in Subor QTL in Sub----block 1block 1block 1----1block 1 111
Discovery of causative gene for the QTL of interest is the final step in forward genetics. In this study, I paid special attention to the QTL contained in Sub-block 1-1 as the target for gene discovery, because it is unique in that MSM/Ms allele of this QTL up-regulates cancellous bone volume fraction relative to B6 allele, and that the physical size of Sub-block 1-1 is shortest among those of the all blocks. Sub-block 1-1 is included in Block 1, and
presence of QTL(s) in Block 1 is statistically unequivocal. Moreover, there is a possibility that the QTL in Sub-block 1-1 is identical to the sole QTL in Block 1 or at least to a predominant one of multiple QTLs in Block 1, because the MSM/Ms fragments of the two blocks raise the BV/TV value relative to the B6 fragments.
Because Sub-block 1-1 is short in size and it is located to a typical gene desert region, only eight protein-coding genes were identified. Among them, Ctnnd2 is less likely to be the candidate, because it is not expressed in the whole bone tissue. Then, I carried out further analysis to narrow down the remaining seven candidate genes. From the aspects of strain difference in gene expression level and amino acid change between B6 and MSM/Ms, the four genes, Ankrd33b, Ropn1l, March6 and Fam173b, remain as good candidates.
Ankrd33b is poorly annotated gene except for the information that it contains Ankyrin repeat. In silico analysis revealed amino acid substitution (Methionine vs Leucine) at 207th residue between B6 and MSM/Ms alleles, which is located to the functional domain of Ankyrin repeat 4. I explored the polymorphism of the amino acid sequence surrounding this site for the mouse inbred strains, and the sequence conservation among evolutionary distant taxa (Figure 16). I found that the amino acid sequence of Ankyrin repeat 4 is highly conserved among mammalian species. Interestingly, Methionine at the 207th residue is observed only in standard laboratory mouse strains including B6 and WSB/EIJ, West European wild mouse (Mus musculus domesticus)-derived inbred strain. Other mouse strains, including
East European wild mouse (M. m. musculus)-derived PWD/PHJ and SPRETUS/EIJ (Mus spretus), derived from wild mouse of a neighboring species of M. musculus, have Leucine. Likewise, evolutionary distant mammalian species, Rattus, Humans and Macaca, all have Leucine. Thus, many standard laboratory strains of mouse appeared to belong to a rare group for the genetic variation at the amino acid residue 207th of Ankrd33b. It is likely that the allele with Methionine at the 207th is a new variant originated from ancestral form with Leucine. In this context, it is reminiscent that the MSM/Ms fragment of Sub-block 1-1, which contains the ancestral allelic form of mammalian Ankrd33b, up-regulates cancellous bone volume fraction, raising physical strength of bone.
Several master genes are known to act for developmental regulation of bone. For instance, studies with Runt-related transcription factor 2 (Runx2) knockout mice revealed that Runx2 controls differentiation and function of osteoblasts (Komori et al., 1997; Otto et al., 1997; Nakashima et al., 2002; Stein et al., 2004). RANKL (RANK-ligand) and its receptor RANK are expressed on osteoblast and osteoclast, respectively. Without RANKL-RUNK signaling, p50/RelB and p52/RelA dimers of NF-kB family are retained in the cytoplasm of osteoclast as complex with IkBs, (Inhibitor of Kappa Light Chain Gene Enhancer in B-Cells Protein). This inhibitory binding of NF-kB and IkBs requires Ankyrin repeats of IkBs. When RANKL binds to RANK, its signaling induces activation of IKKs (IkB Kinases) through TRAF6 (TNF Receptor-Associated Factor 6), resulting in the phosphorylation and subsequent proteasome-mediated degradation of IkBs.
The liberated NF-kBs then enter the nucleus where they bind to the downstream target genes required for osteoclastogenesis. Therefore, if Ankrd33b acts as another inhibitor for NF-kBs, competing the function of IkBs, variant forms of Ankrd33b may affect osteoclastogenesis, resulting in phenotype of cancellous bone volume fraction.
Difference in the expression level of Ankrd33b was observed in the comparing pair of Sub-17 vs Sub-11, but not in the pair of B6 vs C15. One explanation for this contradiction is that Ankrd33b has a long-range cis-regulatory element, which is likely located to the proximal part of Block 1 (the interval defined by centromere and the breakpoint marker (a)). This is an extremely interesting finding, because it accounts in part for context-dependent phenotypic effects, which are often observed in many QTLs identified in mouse chromosomes. If the long-range cis-regulatory element with a sequence variation is separated from the coding region by recombination, the same allelic form of the trans factor binding to the cis-element possibly may cause alteration of expression level of the gene, resulting in phenotype, which is never seen in the original mouse without the recombination. However, if the QTL in Sub-block 1-1 is identical to that in Block 1, strain difference in the expression level of Ankrd33b could not be the causality of the phenotypic difference, because the MSM/Ms fragments for the both blocks raise the cancellous bone volume fraction relative to the B6 fragments. In this case, amino acid change at the 207th could be more plausible causality of the phenotypic difference.
Molecular functions of Ropn1l, March6 and Fam173b are also poorly
understood. Most recent analysis with GWAS showed that SNPs linked to Ropn1l and March6 are associated with human obesity (Wang et al., 2012). Adipocyte and osteoblast are known to originate from the same mesenchymal stem cell (MSC), and it is reported that PPARg and Wnt5a act for balancing the differentiation from MSC into adipocyte or osteoblast (Takada I. et al., 2007). Furthermore, in aging-related change named “yellow bone marrow”, the bone marrow in long bones is replaced by adipocytes. This fact supports that adipocyte and osteoblast are derive from common MSC (Suda et al., 2007). In relation to this, my preliminary data indicated that obesity of a sub-consomic strain Sub-11 is significantly suppressed as compared with B6 under high fat-diet condition (Kataoka et al., unpublished data). If Ropn1l and March6 have a function to regulate differentiation of MSC into adipocyte and osteoblast, both are good candidates for the causative gene of the QTL in Sub-block 1-1.
5.35.3
5.35.3 Cancellous bone microstructure andCancellous bone microstructure andCancellous bone microstructure andCancellous bone microstructure and physical strength of bonephysical strength of bonephysical strength of bonephysical strength of bone
I started this study on the assumption that cancellous bone microstructure is correlated with physical strength of bone, which is a direct and most important parameter to assess the risk of osteoporotic fracture in human elders. Compression test in this study clearly showed that tibial bone of consomic strain C15 is physically weaker than that of B6 (Fig.9 B, C and D), suggesting that lower cancellous bone volume fraction of C15 affects the physical strength of bone. However, it is also known that thickness of cortical bone surrounding the cancellous bone is another factor to determine physical
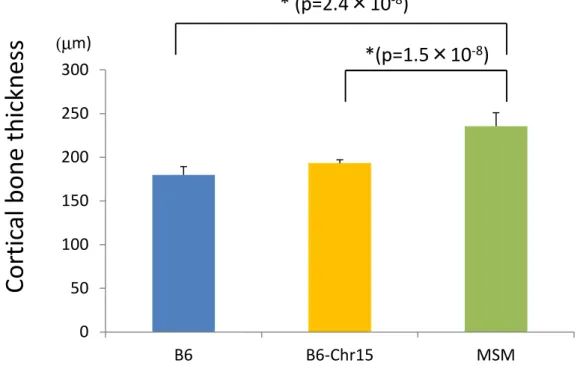
strength of bone. B6 and MSM/Ms showed phenotypic variation not only in cancellous bone volume fraction but also in cortical bone thickness. As shown in Figure 15, the cortical bone of MSM/Ms is significantly (p=2.4 x 10⁻⁸) thicker than that of B6. Another inbred mouse strain, C3H/HeJ (C3H), was reported to display bone architecture similar to MSM/Ms, lower level of cancellous bone volume fraction and thicker cortical bone, although body size and body weight are almost same as those of B6. Interestingly, physical strength of the C3H bone against compression is not significantly different from that of B6 (Turner et al. 2000). Therefore, it is highly likely that the thicker cortical bone of MSM/Ms compensates for its lower cancellous bone volume fraction to hold sufficient physical strength of bone of this strain. As the tibia of MSM/Ms is too small to measure its physical strength by the procedure used in this study, it should be investigated in future study.
Notably, as compared with MSM/Ms, thickness of the C15 cortical bone is remarkably reduced, and it is close to that of B6 (Figure 15). In consomic strain C15, many MSM/Ms alleles, which are located to chromosomes other than Chr15, and act to up-regulate the cortical bone thickness, are probably replaced by the B6 alleles at the corresponding loci. As a consequence, the QTLs of the cancellous bone volume fraction, which were identified in this study, directly affect the physical strength of tibial bone in mouse.
6. ACKNOWLEDGEMENTS 6. ACKNOWLEDGEMENTS 6. ACKNOWLEDGEMENTS 6. ACKNOWLEDGEMENTS
I wish to express my sincere gratitude to my supervisor, Prof. Toshihiko Shiroishi, for his advice and stimulating discussion. I particularly appreciate Dr. Masaru Tamura for stimulating discussion and technical advice throughout this study. I also appreciate Dr. Toyoyuki Takada for providing invaluable data of a full set of consomic strains and informative advice. I also thank Mr. Akiteru Maeno for excellent technical support of X-ray micro-CT. I also appreciate Dr. Satoshi Kuriki for useful advice of statistical analysis. I greatly appreciate all members of the progress report committee, Drs. Koichi Kawakami, Ituro Inoue, Tatsumi Hirata, Noriyoshi Sakai, Hiroyuki Sasaki and Kenta Sumiyama for useful advice and suggetions throughout this study. I also thank Mrs. Fumie Murohushi, Toshie Aoki, Shouko Hujii and other staff of animal facility of the National Institute of Genetics for taking care of the mice used in this study. I also thank Mr. Yoichi Mizushina, Mrs. Hiromi Nakazawa and Miss. Kanami Hukunaga for maintaining sub-consomic strains by embryo manipulation. I also thank Drs. Takanori Amano, Shigekazu Tanaka, Tomoko Sagai, Ayako Oka, Mrs. Hideko Watanabe, Yoriko Kato, Kumiko Masuyama, Humiko Iwase, Kyoko Takada and other members of Mammalian Genetics Laboratory for valuable suggestions and supporting this work.