VERA Observations of 43GHz SiO Masers
toward a Symbiotic Star R Aquarii
Min, Cheulhong
Doctor of Philosophy
Department of Astronomical Science
School of Physical Sciences
SOKENDAI (The Graduate University for
Advanced Studies)
定
VERA Observations of 43GHz SiO Masers
toward a Symbiotic Star R Aquarii
Min, Cheulhong
Academic Advisors Prof. Dr. Honma, Mareki
Dr. Shibata, Katsunori M. Dr. Hirota, Tomoya
Department of Astronomical Science School of Physical Sciences
The Graduated University for Advanced Studies (SOKENDAI) 2017
ii
Abstract
Symbiotic stars are generally understood as interacting binary systems comprising a cool late-type star, which is a Red Giant Branch (RGB) or Asymptotic Giant Branch (AGB) star, and a hot compact companion, which is usually a White Dwarf (WD), surrounded by ionized nebulae. The interaction between the components presents a variety of astronomical phenomena that involve mass-loss and mass-transfer processes. In particular, the ionized nebulae are mostly found around D-type symbiotic stars, and a large proportion of those nebulae show a bipolar morphology. While the detailed mechanism has been longstanding topics of debate, the binary interaction is considered to play an important role in the formation mechanism. To acquire orbital parameters is indispensable to derive fundamental physical information for understanding various uncertain aspects of the formation mechanism. However, most of the known orbital parameters are limited to S-type symbiotic stars.
R Aquarii (R Aqr) is one of the well-known D-type symbiotic stars composed of a Mira variable and a WD companion. The characteristics of the system are the pres- ence of bipolar jet-like features and the hour-glass-shape of two extended inner- and outer-bipolar nebulae. In addition, R Aqr is one of the symbiotic stars that exhibit cir- cumstellar masers associated with the Mira variable. Several progresses were made in deriving orbital parameters for R Aqr, but the observations have not yielded consistent values for those parameters yet.
A radial velocity analysis has been widely used for determining orbital parameters of a binary system, but it cannot resolve the full parameters because of an inclination ambiguity. In order to disentangle the ambiguity, an astrometry observation is com- plementary to the radial velocity method. For the astrometry, SiO masers allow us to determine the accurate positions of the central star from their distributions with a high spatial resolution of VLBI observation. Combining the astrometry and the radial velocity analysis, the full orbital parameters can be derived without any ambiguity. Moreover, the VLBI observation of the SiO maser provide the kinematics of the inner region of the stellar atmosphere, and give implications for understanding the dynamics of the initial mass-loss process.
In this study, we have performed the VLBI Exploration of Radio Astrometry (VERA) observations of SiO masers toward the symbiotic star R Aqr from 2011 to 2014 to determine its reliable orbital parameters. We made long-period, multi-transitional observations of SiO masers with the phase-referencing VLBI technique, which provides absolute positional information as well as high-resolution images, for the first time for R Aqr
The SiO masers extended over an area of about 40 mas × 40 mas, forming clumpy, partial ring-like structure and predominantly occupying eastern portion of the shell. We determine the position of the Mira variable by fitting concentric circles to the observed SiO maser distributions for each epoch. Adopting previous VERA astrometry observations, we extended the time coverage of the astrometry to about 10 years for R Aqr. Moreover, we also conducted Nobeyama and Mopra single-dish observations of the SiO masers from 2002 to 2014 to trace the radial velocity variation of the Mira variable in R Aqr for a longer period of time. Complementing previous radial velocity data, we
i
covered about 85 years of radial velocities for R Aqr. Combining the astrometry and radial velocity data, we derive the full orbital parameters using a Markov Chain Monte Carlo (MCMC) method.
Comparing the orbital parameters with the VERA observations of SiO masers in R Aqr, we found that the global distribution of dominant SiO maser features is closely related to the orbital phase of R Aqr system due to the binary interaction. In our VERA observations, most of SiO maser components were detected in eastern hemi- sphere during the three stellar phases. Our orbital solution suggests that the dominant SiO maser region tends to appear in the direction of the WD companion with respect to the Mira variable. Besides, this tendency has been persistently observed through VLBI observations for over 20 yrs. Since the strong maser emission is preferentially observed in the region where the material density and velocity coherence are higher, the observed tendency indicates that high density of material properly concentrates in the direction of the companion, where the mass-transfer process may occur between the components.
Moreover, we newly obtained several stellar properties including the component masses of 1.55 M⊙for the Mira variable and 1.01 M⊙for WD companion, respectively. Applying the stellar masses to observed SiO maser distribution, the mass-transfer is likely to occur via the (wind) Roche-lobe overflow in R Aqr. The observed SiO maser region occupied over 70% of the Roche-lobe radius of 19.75 mas, and the material can effectively fill the Roche lobe with the assistance of the dust-driven winds. Applying a simple kinematic model, we define the inner boundary of the SiO maser region, where the radius and outflow velocity are Rin = 12 and Vin= 7.7 km s−1, respectively. Moreover, we derive the outflow velocity at the Roche lobe radius of Vout = 12.2 km s−1 for a logarithmic velocity gradient. Adopting the outflow velocities, the mass-loss rate of the Mira variable is as high as 4.1 × 10⁻⁵ M⊙ yr−1 in R Aqr.
Finally, our orbital parameters imply that the formation mechanism of a bipolar nebula involves not only the binary interaction but also other processes in R Aqr. For the bipolar nebulae, the binary interaction is the most preferred mechanism. From the morphology and structure of the bipolar nebulae, several orbital parameters can be estimated based on theoretical studies. Comparing our orbital solution and the morphology of R Aqr nebulae, we found a misalignment between our orbital parameters and morphologically estimated values. Our result indicates that the binary interacting scenario alone cannot explain this discrepancy, and other processes, such as some effects of magnetic fields, are necessary to explain the misalignment.
ii
Contents
Abstract i
1 Introduction 1
1.1 Symbiotic Stars . . . 1
1.1.1 Subclasses of Symbiotic stars . . . 4
1.1.2 Symbiotic nebula . . . 5
1.2 Mira variables . . . 7
1.2.1 SiO masers in Mira variables. . . 12
1.3 R Aquarii . . . 14
1.3.1 Orbital parameters for R Aquarii . . . 19
1.4 VLBI astrometry . . . 21
1.4.1 VERA projects . . . 22
1.5 Aim of the present study . . . 24
2 Observations and Data analysis 27 2.1 VLBI observations . . . 27
2.1.1 VERA observations . . . 27
2.1.2 VERA data analysis . . . 28
2.2 Single Dish observations . . . 30
2.2.1 Nobeyama & Mopra observations . . . 30
3 Results 33 3.1 VERA observations . . . 33
3.1.1 Spatial distributions of the SiO masers . . . 33
3.1.2 Concentric circular fitting . . . 35
3.2 Radial velocity of R Aqr . . . 43
3.2.1 Previous radial velocity data of R Aqr . . . 43
3.2.2 Radial velocities from Nobeyama & Mopra SiO maser observations 44 3.3 Determination of orbital parameters for R Aqr . . . 48
4 Discussions 59 4.1 SiO maser distributions in R Aqr . . . 59
4.2 Distance toward R Aqr . . . 62
4.2.1 Stellar properties . . . 64
4.3 Relations of the orbit & symbiotic phenomena . . . 67 iii
4.3.1 Mass transfer process . . . 67
4.3.2 Symbiotic nebulae in R Aqr . . . 71
5 Conclusions and Future prospects 75 Bibliography 77 Appendix 87 A.1 Geometry of Keplerian orbit . . . 87
A.1.1 Radial Velocity model . . . 92
A.1.2 Astrometry model. . . 92
A.2 Bayesian Inference and Markov Chain Monte Carlo (MCMC) method . . . 94
A.2.1 Bayes theorem . . . 95
A.2.2 Metropolis-Hasting Markov Chain Monte Carlo method . . . 95
A.2.3 Choice of prior . . . 97
A.2.4 Setting in this paper . . . 98
A.3 Testing analysis for estimating orbital parameters with MCMC method 101 A.3.1 Application to mock data . . . 101
A.3.2 Case study: HR7672 - Crepp et al. (2012) . . . 102
A.4 Radial velocities in visual wavelength . . . 106
A.5 Radial velocities from single-dish observations . . . 107
A.5.1 Mopra 22m observations . . . 107
A.5.2 Nobeyama 45m observations . . . 108
A.6 List of SiO maser components from VERA observations . . . 111
iv
List of Tables
1.1 Resolved symbiotic nebulae with properties. . . 6
1.2 Orbital parameters for symbiotic stars . . . 8
1.3 Summary of historical orbital parameters for R Aqr . . . 19
2.1 Summary of VERA observations. . . 28
2.2 Summary of Nobeyama 45m telescope observations . . . 30
2.3 Summary of Mopra 22m telescope observations . . . 31
3.1 Summary of the concentric circular fitting result of R Aqr . . . 41
3.2 Radial velocities of R Aqr from Gromadzki & Miko lajewska (2009) . . . 45
3.3 Radial Velocities of R Aqr from Nobeyama & Mopra observations. . . 46
3.4 Positions of the Mira variable from previous VERA observations . . . 50
3.5 The MCMC result of the model parameters . . . 52
4.1 Historical distance measurements toward R Aqr . . . 62
A.2.1Model parameters used in this study . . . 100
A.3.1A comparison between input parameters of the mock data and parameters estimated with MCMC analysis. . . 102
A.3.2Orbital parameters for HR7672 . . . 104
A.4.1Radial velocities for R Aqr in visual wavelength . . . 106
A.5.1Radial Velocity of R Aqr from Mopra-22m . . . 107
A.5.2Radial Velocity of R Aqr from Nobeyama-45m. . . 108
v
vi
List of Figures
1.1 Artist’s Impression of the Symbiotic Star R Aquarii . . . 1
1.2 Optical spectra of symbiotic star . . . 3
1.3 Spectrum difference between S-type and D-type symbiotic stars . . . . 5
1.4 Formation scenario of the symbiotic nebula . . . 6
1.5 H-R diagram of evolution of low- and intermediate-mass stars . . . 9
1.6 Schematic view of the structure in Mira variables . . . 10
1.7 Interrelationship of M, S and C type of AGB stars. . . 11
1.8 Example of the period luminosity relation . . . 12
1.9 VLBA observation of SiO maser emission . . . 13
1.10 Images of the R Aqr nebulae . . . 15
1.11 HST images of the jet and counter-jet of R Aqr . . . 16
1.12 Chandra X-ray images of R Aqr jet . . . 17
1.13 VLBI observation images of R Aqr . . . 18
1.14 The radial velocities and fitted orbital models for R Aqr. . . 20
1.15 The arrangement of four VERA antennas . . . 23
2.1 Procedures for VERA data analysis . . . 29
3.1 VERA observations and the optical light curve from AAVSO toward R Aqr. . . 33
3.2 SiO maser emissions towards R Aqr . . . 36
3.2 SiO maser emissions towards R Aqr . . . 37
3.2 SiO maser emissions towards R Aqr . . . 38
3.2 SiO maser emissions towards R Aqr . . . 39
3.3 Time variations of the size of SiO maser region for R Aqr . . . 42
3.4 Radial velocity variation of R Aqr . . . 47
3.5 Comparison of SiO maser spectra . . . 49
3.6 The posterior probability distributions of the MCMC analysis. . . 53
3.7 The astrometric motion of R Aqr in the sky plane with best-fit model . 55 3.8 The best-fit orbital motion . . . 56
3.9 The radial velocities with the best-fit model. . . 57
4.1 Histograms of the SiO maser distribution . . . 60
4.2 The permitted mass range of R Aqr components. . . 67
4.3 Roche lobe in R Aqr . . . 68 vii
4.4 Distribution of the SiO maser distances from the center (radius) versus their LSR velocities . . . 69 4.5 Symbiotic nebulae in R Aqr with the orientations of the orbital planes. 72 4.6 Spiral arcs in Mira AB with orbital orientation . . . 74 A.1.1Graphical representation for the Keplerian orbit of ellipse . . . 88 A.1.2Graphical representation for the Keplerian orbit of ellipse in the obser-
vational frame. . . 90 A.3.1The posterior probability distributions for the simulated data. . . 103
viii
Chapter 1
Introduction
1.1 Symbiotic Stars
The class of “Symbiotic star” was first introduced by Merill (1941), who presented peculiar spectra showing a combination of the continuum with molecular absorption features from the cool giant stars and emission lines from high-temperature ionized gasses. The explanation of this composite spectra would be considered as binaries containing two stars with different temperatures, both bright enough to contribute to the spectra. These stars are nowadays generally understood as interacting binary systems comprising of a cool late-type star and a hot compact companion surrounded by an ionized nebula. The late-type star is a red giant branch (RGB) or asymptotic giant branch (AGB) star, and the hot companion is usually a white dwarf (WD), in a few cases of a low-mass main-sequence star or a neutron star. Roughly 200 symbiotic stars are known in our Galaxy and Magellanic Cloud (catalog by Belczynski et al. 2000). According to other estimations, the total number of a symbiotic population might be from 3 × 10³ (Allen 1984) up to 4 × 10⁵ (Magrini et al. 2003) in our galaxy.
Figure 1.1: Artist’s Impression of the Symbiotic Star, R Aquarii (credit by NASA/Dana Berry).
1
2 CHAPTER 1. INTRODUCTION
Interactions between the components in the symbiotic star play an important role in various astrophysical phenomena, such as the formation of an accretion disk, a col- limating fast jet-like outflow, a nova-like thermonuclear outburst, and a photo-ionized nebula as illustrated in Figure1.1. These symbiotic phenomena make them unique as- trophysical laboratories for investigating a variety of astronomical processes of binary evolutions with important implications and applications. Moreover, studying the sym- biotic stars give clues for better understanding a wide range of objects, such as Type Ia supernovae, post-AGB stars (e.g. Barium stars), planetary nebulae, soft X-ray sources, and cataclysmic binaries.
The definition of the symbiotic star has been crystallized after Kenyon (1986) de- scribed specific observational properties. Though Kenyon (1986) referred that the defi- nition of the symbiotic star highly depends on the choice of prototype stars, the specific properties of original samples of prototypes were described as follows:
1. Irregular optical variability
2. The absorption features of a late-type giant star such as TiO bands and neutral metals
3. Prominent high ionization emission of recombination Hi, Hei, Heii, and forbidden [Oiii], [Niii] etc
4. A bright red continuum 5. A weak blue continuum
6. Usually found in planetary nebulae
Belczynski et al. (2000), who recently categorized the symbiotic stars, suggested that the classification criteria of symbiotic stars have following observational characteristics. 1. The presence of the absorption features of a late-type giant; in practice, these include (amongst others) TiO, H2O, CO, CN, and VO bands, as well as Cai, Caii, Fei and Nai absorption lines
2. The presence of strong emission lines of Hi and Hei and either
- Emission lines of ions with an ionization potential of at least 35eV (e.g. [Oiii]), or
- An A-or F-type continuum with additional shell absorption lines from Hi, Hei and singly-ionized metals
- The latter corresponds to the appearance of a symbiotic star in outburst 3. The presence of the λ6825 (Raman scattering) emission features, even if no fea-
tures of the cool star (e.g. TiO bands) are found
They also denoted that symbiotic stars are variables with timescales often exceeding a dozen years and that –as Kenyon very sensibly noted- “every known symbiotic star has, at one time or another, violated all the classification criteria invented”.
1.1. SYMBIOTIC STARS 3
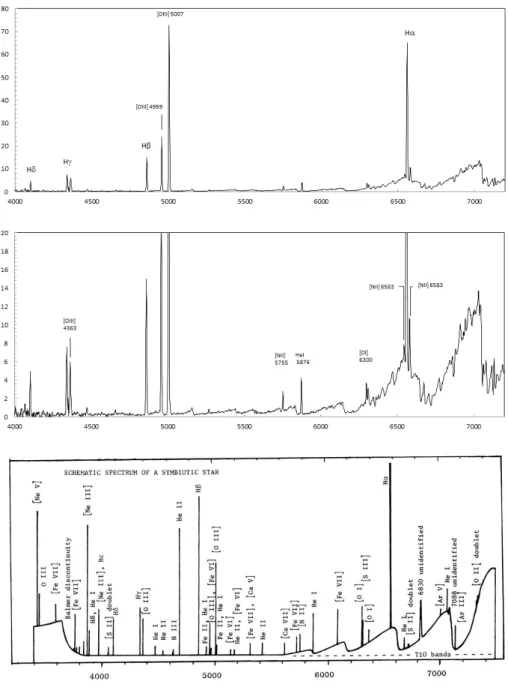
Figure 1.2: Optical spectra of symbiotic star with combination of cool giant’s con- tinuum with molecular absorption features and high ionized emissions. (Top,Middle) Optical spectra1 of the symbiotic star, R Aquarii near minimum luminosity. (Bottom) Schematic spectrum of the symbiotic star.
1The data were released with the support by ARAS (Astronomical Ring for Access to Spectroscopy) http://www.astrosurf.com/aras/
4 CHAPTER 1. INTRODUCTION
1.1.1 Subclasses of Symbiotic stars
All symbiotic stars can be divided into several sub-classes. According to the hot com- panion’s properties and outburst activities, there are three types of symbiotic stars: Recurrent novae, Symbiotic(Slow) novae, and Classical symbiotic stars. In addition, symbiotic stars can be classified into mainly two types of S(Stellar)-types and D(Dusty)- types based on the cool giant’s properties.
Recurrent novae, Symbiotic(Slow) novae & Classical symbiotic stars
In the outburst phase, three types of symbiotic stars can be characterized based on the duration and spectroscopic changes(evolutions).
Recurrent novae and Symbiotic(Slow) novae are believed to be due to thermonu- clear runaway on the accretion surface of the hot companion (WD), as in classical novae. They can be treated as a same subclass of nova, that shows no WD material enhancement (Kato 2002). However, the recurrent novae, as the name implies, repeat outbursts on the time scales from a few month to several-tens of year, and show a rapid decline in their light curves. They usually have a massive hot companion, over 1.1 M⊙. While the symbiotic(slow) novae present a single and decade-long outburst. They contain a low to a medium mass of hot companion between 0.4 and 0.6 M⊙.
Classical symbiotic stars are the most common in the symbiotic outburst, showing occasional eruptions on the timescale from months to years. However, their outburst mechanism is not clearly known (Miko lajewska 2011).
S-type and D-type Symbiotic stars
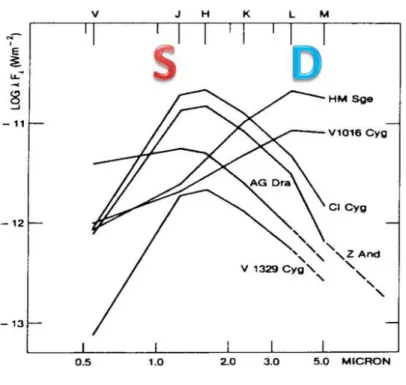
On the basis of infrared spectra in quiescent phase, there are mainly two types of symbiotic stars: S(Stellar)-type and D(Dusty)-type (Webster & Allen 1975). Figure1.3 shows the difference between the S-type and D-type symbiotic stars in the infrared spectral energy distribution range between 1-4 µm.
The majority of symbiotic stars (about 80% of known symbiotic stars) belong to the S-type. They possess a star-like infrared continuum with modest mid-infrared ex- cesses, which indicates a temperature of 2500-3500 K, and strong CO absorption bands. Besides their infrared spectra, they can be characterized by relative strengths of their forbidden and intercombination lines suggesting a high electron density of Ne ∼ 109 cm−3 in nebulae ionized by a hot companion of T>75000 K. The S-type symbiotic stars generally have a normal RG star (spectral type of M) as a cool component. The known orbital periods of S-type symbiotic stars have a range between 200 and 1000 days.
The D-type symbiotic stars exhibit a warm dusty spectrum with high mid-infrared excesses, corresponding to a lower temperature about 800-1000 K, with H2O and CO absorption bands. Since the D-type symbiotic stars contain a Mira variable as a cool component, they also called ”symbiotic Miras”. They have a lower electron nebula density of Ne <106 cm−3 and longer orbital periods of about >20 yrs than those of S-type symbiotic stars.
A small number of symbiotic stars are included as D’-type (or yellow) symbiotic star (Allen 1982). They show very red colors of dust emission in the far infrared spec- trum which is typically lower temperatures than those observed in D-types. They are
1.1. SYMBIOTIC STARS 5
Figure 1.3: Spectrum differences between S-type and D-type symbiotic stars (Eiroa et al. 1982).
characterized by the cool component in which spectral type of F, G, K, or early R giants, in contrast to other symbiotic stars.
1.1.2 Symbiotic nebula
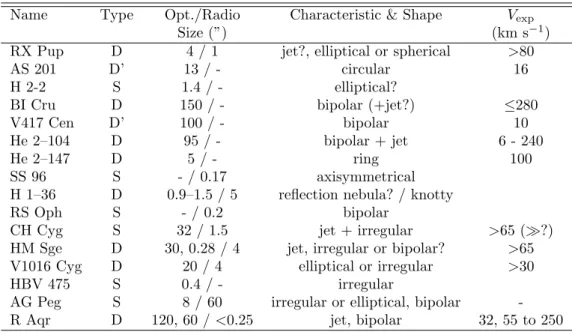
Large scale, extended and ionized nebulae are usually found around symbiotic stars. A comprehensive symbiotic nebula was compiled by Corradi et al. (1999,2000). Table1.1 shows the resolved symbiotic nebulae with their brief properties.
An important characteristic is that most of the symbiotic nebulae are found around D-type symbiotic stars. These nebulae are more extended in D-type than S-type sym- biotic stars and resemble planetary nebulae (PNe) in terms of morphology, spectra, exciting conditions and chemical abundances. Accordingly, those symbiotic nebulae were initially classified as PNe. After the character of symbiotic nebulae became ob- vious, a number of the misclassified PNe belonged to symbiotic stars, and the nature of symbiotic stars made them distinct objects formed in different stages of stellar evo- lution. Nevertheless, the fact that their morphology and kinematics are very similar to those of PNe tells us that similar dynamical processes are likely to occur in both classes of objects.
Another important characteristic of the symbiotic nebulae around D-type symbiotic stars is their wide variety of shapes. Many of symbiotic nebulae have an asymmetric morphology, and more than 40% show a bipolar morphology (Corradi et al. 2000). Since the underlying physics of the asymmetric morphology should be similar to those of PNe
6 CHAPTER 1. INTRODUCTION
Table 1.1: Resolved symbiotic nebulae with properties
Name Type Opt./Radio Characteristic & Shape Vexp
Size (”) (km s−1)
RX Pup D 4 / 1 jet?, elliptical or spherical >80
AS 201 D’ 13 / - circular 16
H 2-2 S 1.4 / - elliptical?
BI Cru D 150 / - bipolar (+jet?) ≤280
V417 Cen D’ 100 / - bipolar 10
He 2–104 D 95 / - bipolar + jet 6 - 240
He 2–147 D 5 / - ring 100
SS 96 S - / 0.17 axisymmetrical
H 1–36 D 0.9–1.5 / 5 reflection nebula? / knotty
RS Oph S - / 0.2 bipolar
CH Cyg S 32 / 1.5 jet + irregular >65 (≫?)
HM Sge D 30, 0.28 / 4 jet, irregular or bipolar? >65 V1016 Cyg D 20 / 4 elliptical or irregular >30
HBV 475 S 0.4 / - irregular
AG Peg S 8 / 60 irregular or elliptical, bipolar - R Aqr D 120, 60 / <0.25 jet, bipolar 32, 55 to 250
in spite of different physical parameters, several scenarios have been proposed in order to explain this complex and varied morphology from the PNe formation mechanisms. However, there remains as elusive as ever. For the bipolar morphology, a widely ac- cepted mechanism is a combination of a binary interaction and interacting wind model as shown in Figure 1.4.
Figure 1.4: Formation scenario of the symbiotic nebula (created by NASA & ESA). In symbiotic stars, a mass-losing giant star emanates a copious amount of material via stellar winds. A companion has influence on the wind material via Bondi-Hoyle- Lyttleton (BHL) wind accretion (Hoyle & Lyttleton 1939; Bondi & Hoyle 1944; Bondi 1952), Roche Lobe Overflow (RLOF) (Morris 1981,1987; Mastrodemos & Morris 1999; Soker 1994) wind Roche lobe Overflow (WRLOF) (Mohamed & Podsiadlowski 2007), or Gravitational focusing (de Val-Borro et al. 2009; Kim 2011; Kim & Taam 2012). This binary interaction produces slow winds (expanding velocity of 20-30 km s−1) of
1.2. MIRA VARIABLES 7
a circumbinary envelope, which shows a highly aspherical geometry. Hydrodynamic simulations have provided a detailed insight of the binary interacting geometry, which has an equatorial density enhancement in common. Most of the material strongly con- centrates on the equatorial region, which corresponds to the orbital plane. Moreover, the slow winds generated on the orbital plane mainly form spiral structures (or arc-like structures depending on the viewing angle and the orbital inclination) with gravita- tional wakes breaking the spherical symmetry. Such spiral structures were found in several objects which have a binary nucleus (R Scl: Maercker et al. 2012, o Ceti: Ram- stedt et al. 2014, IRC+10216(CW Leo): Decin et al. 2015). At the same moment, the companion accumulates some part of the material to form an accretion disk, and disk-driven bipolar jets (or collimated fast outflows) are possibly produced.
When enough(sufficient) mass concentrates on the companion’s surface, a fast wind would be formed by a nova-like outburst expanding velocity of a hundred or thou- sand km s−1. The fast wind catches up with the previous slower, denser winds, and compresses them into lobes above and below on opposite side of the dense equatorial region (Balick & Frank 2002). This formation stage is relevant to the scenario of the Generalized Interacting Stellar Winds (GISW) model, first proposed by Kwok et al. (1978).
The binary interaction is one of the main prerequisites for the formation mecha- nisms of a variety of symbiotic phenomena, and information of orbital parameters is necessary for further detail knowledge and modeling in symbiotic stars. To provide the orbital parameters can be applied to basic physical properties for a binary separation, period, component masses, which are relevant to a mass-loss and mass-transfer pro- cesses. Table 1.2 is the known orbital parameters of symbiotic stars so far (Belczy´nski et al 2000; Miko lajewska 2003). Although the orbital parameters are critical for the understanding of the symbiotic phenomena, only about a dozen of the known symbi- otic stars currently have determined their orbits. Moreover, most of systems belong to S-type symbiotic stars, and fully known binary orbits are very rare with high uncer- tainties. Thus, determining orbital parameters for D-type symbiotic stars is a current issue and necessary to understanding the formation mechanism of symbiotic nebulae as well as various symbiotic phenomena.
1.2 Mira variables
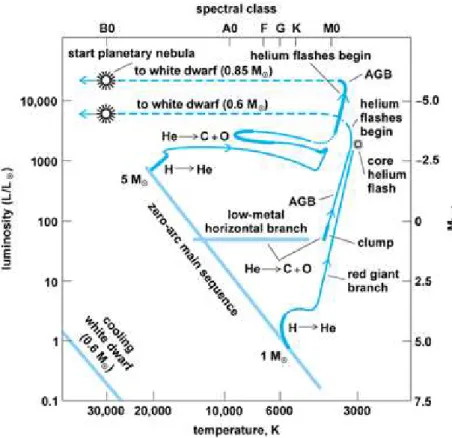
Mira variables, named after their prototype of omicron Ceti (o Ceti), are a sub-class of Long Period Variables (LPVs). They are at a very late stage of low- and intermediate- mass stellar evolution located on the tip of the AGB phase in the Hertzsprung-Russell (H-R) diagram (Figure 1.5). They show a strong luminosity variation, larger than 2.5 and up to 10 magnitudes in the visual amplitude, due to stellar pulsations with changes in the opacity. The period of the variation and pulsation is typically between 100 and 1000 days. Typically, the masses for Mira variables are one to two solar masses. To this day the ”General Catalogue of Variable Stars” lists more than 8000 Mira-type variables.
The schematic structure of the Mira variable is presented in Figure1.6. In the AGB
8 CHAPTER 1. INTRODUCTION
Table 1.2: Known orbital parameters for symbiotic stars (Belczy´nski et al. 2000; Miko lajewska 2003)
Name Type Porb Kg q4 γ0 e T0 agsin i f (M )
(days) (km s−1) (km s−1) (JD5) (R⊙) (M⊙)
EG And S 482.6 7.3 95 0 508043 70 0.020
AX Per S 680.8 7.5 2.5 116.5 0 45511.8 100 0.030
682.1 7.8 2.3 -117.4 0 50964 105 0.033
BD Cam 596.21 8.5 22.3 0.09 427941 99.7 0.037
V1261 Ori 642 7.5 3.0 79.7 0.07 467783 95 0.028
BX Mon S 1401 4.3 6.7 29.1 0.49 49530 104 0.0076
1259 4.6 29.1 0.44 49680 103 0.0092
SY Mus S 624.5 7.4 12.9 0 490823 91 0.026
TX CVn S 199 5.7 2.3 0.16 45195.251 22 0.004
RW Hya S 370.2 8.8 12.4 0 45071.6 65 0.026
370.4 8.8 12.9 0 49512 0.026
BD21 3873 S 281.6 10.6 203.9 0 49087.33 59 0.035
T CrB S 227.57 23.9 0.6 27.8 0 47918.6 107 0.322
AG Dra S 554 5.1 148.3 0 46366.4 56 0.008
549 5.9 -147.2 0 50775 64 0.0115
KX TrA S 1350 6.8 2.3 -123.7 0.29 51703 175 0.039
AE Ara S 812 5.4 4 -15.7 0 50217 87 0.0133
RS Oph S 455.7 16.7 0.35 40.2 0 50154.13 150 0.221
V343 Ser 451.3 2.6 -5.63 0 503983 23 0.0008
450.5 2.7 -5.65 0.14 505751 23.5 0.0009
FG Ser S 650 8.3 2.8 71.2 0 48491 107 0.039
633.5 6.9 73.3 0 51031 87 0.022
AR Pav S 604.5 9.6 2.7 68.4 0 48139 115 0.055
604.5 10.9 2.5 -68.3 0 48139 130 0.079
V443 Her S 594 3.2 49.2 0 46007.7 39 0.002
594 2.5 -55.5 0 50197 30 0.0010
FN Sgr S 568.3 10.5 2.1 -53.7 0 50269 118 0.0689
BF Cyg S 757.2 6.7 3.6 -3.75 0 51395 100 0.0239
CH Cyg S 5700 4.9 57.7 0.47 45086 478 0.045
756.0 2.6 60.6 0 46643.7 39 0.0014
5292 4.8 0.06 455921 500 0.060
CI Cyg S 855.3 6.7 3 18.4 0 45241.8 114 0.027
853.8 6.7 15.0 0.11 50426.4 112 0.026
V1329 Cyg S 956.5 7.9 2.9 -23.1 0 51565 149 0.0481
CD43 14304 S 1448 4.4 27.6 0 459293 126 0.013
1442 4.6 27.5 0.22 455601 128 0.014
AG Peg S 816.5 5.3 4 15.9 0 31667.5 84 0.012
818.2 5.4 15.9 0.11 46812 87 0.0135
Z And S 758.8 6.8 1.8 0 45703.0 102 0.025
758.8 6.7 -1.8 0 50260 102 0.024
CD27 8661 763.3 10.5 5.5 0 49280.53 158 0.092
1T
0- time of the passage through periastron
2Assumed from photometric ephemeris (eclipse)
3Time of maximum velocity
4Mass ratio of q = Mg/Mh 5Julian Date = 2400000 + JD
1.2. MIRA VARIABLES 9
Figure 1.5: H-R diagram of evolution of low- and intermediate-mass stars. (After J. B. Kaler, Stars, W. H. Freeman, 1992, 1993, from work of I. Iben (1985))
phase, stars have an electron-degenerate core, consisting mostly of carbon and oxygen, surrounded by a nuclear burning of helium and hydrogen shells. In particular, convec- tions between the core and the stellar envelope (called “dredge-up”) occur in the AGB stage, and a stellar atmosphere would be abundant in various elements produced by nucleosynthesis. In addition, it is generally thought that AGB stars, including Mira variables, become unstable to produce radial pulsations. Shock waves induced by the pulsations bring material out to larger distances of the stellar atmosphere. The at- mosphere of AGB stars expands to several hundreds of solar radii. Since an effective temperature of AGB stars is as low as 2500 K, the atmosphere enables to form(develop) a rich variation of molecule species. When the temperature is low enough, solid dust particles can condense at the further out region. Due to the highly extended atmosphere and a low surface gravity, in combination with a large amplitude pulsation, a large frac- tion of the mass drifts away through the strong stellar wind initiated by circumstellar dust formation. The greatly extended outer envelope becomes gravitationally unbound from the star and carries away mass with a mass-loss rate as high as 10−4 M⊙ yr−1.
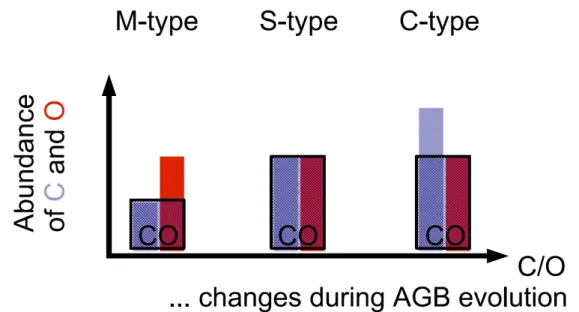
According to the chemical composition of the stellar atmosphere, Mira variables divide into three spectral types, M-, S- and C-type, depending on the relative abun- dances of carbon and oxygen. Figure 1.7 shows the simple interrelationship along the three types of stars. As nucleo-synthesis (nuclear burning) and convection (dredge-up) progress, stars evolve into S- and C-type stars accompanied by the ratio of carbon and
10 CHAPTER 1. INTRODUCTION
Figure 1.6: Schematic view (not to scale) of the structure in Mira variables. (Origin figure from Le Bertre T., 1997, ‘”Cool Stars Winds and Mass Loss: Observations”, Lecture Notes in Physics, Springer, Vol. 497, p. 133)
oxygen changes. The changes of the ratio can be recognized by examination of their spectra.
When the ratio of C/O < 1, all carbons are bound in CO molecules, and the excess of oxygens is available for a formation of oxygen-bearing molecules and dust species such as amorphous aluminum oxide (Al2O3). This state is called M-type, also said to be an oxygen-rich star which is the largest class in Mira variables. They are characterized by TiO molecular absorption bands in the optical spectrum. Absorption bands due to VO and emission lines of Ca I also exist. In addition, they present strong near-infrared absorptions of H2O and significant mid-infrared emissions of dust. The plentiful oxide molecules are also shown in radio wavelength as stellar masers such as SiO, H2O and OH.
When the ratio of C/O ≈ 1, nearly all carbons and oxygens are bound in CO molecule, and less abundant elements are crucial for the molecular composition of the gas. Also, no abundant grain-forming material are available. This state takes place in S-type stars. The dominant feature is ZrO absorption bands in the optical spectrum. The presence of ZrO bands is often considered as a direct consequence of molecular equilibrium in the special circumstances where the atmospheric CO ratio is within
1.2. MIRA VARIABLES 11
Figure 1.7: Interrelationship of M, S and C type of AGB stars. The relative abundances of carbon and oxygen lead to mainly three type of AGB cases. The excess of O (M- type) and C (C-type) is available for silicate grains (M-type) and carbon grains (C-type) respectively (H¨ofner 2009).
10% of unity (e.g. Scalo & Ross 1976). Sometimes, TiO absorption bands are strong as well. They show strong near-infrared CO absorptions and modest emissions from circumstellar dust at the infrared spectrum between 10 and 100 µm.
When the ratio of C/O > 1, all oxygens are bound in CO molecules, and the excess carbon is mainly in form of hydrocarbon molecules and carbon-bearing species. This is C-type(or N-type) stars, also said to be a carbon-rich star. They show spectral features of molecules containing the carbon, such as CN, CH and C2 and so on, in the optical spectrum. The abundant carbon molecules can be sometimes observed as a maser emission of HCN in those stars.
Similar to other variable stars, Mira variables are known to have a relationship between the pulsation period and luminosity, which is an important distance indicator for an old and intermediate-age population. Figure 1.8 shows the pulsation period and the K-band magnitude in which they have a significant correlation in the Mira variables. Large numbers of studies for determining the period-luminosity relationship have been carried out over the years (e.g. Feast et al. 1989; Hughes and Wood 1990; Groenewegen and de Jong 1994; Groenewegen and Whitelock 1996; van Leeuwen et al. 1997; Whitelock et al. 2000, 2008; Cioni et al. 2001; Feast 2004; Ita et al. 2004; Wang et al. 2010; Nakagawa et al. 2016). The nature of Mira variables and the period- luminosity relation has been uncertain, and the construction of the period-luminosity relation has been difficult since they have a large uncertainty in their luminosity due to distance measurement. Thus, accurate distance measurement toward Mira variables is necessary to provide their precise magnitude and promise to calibrate the accurate period-luminosity relation.
12 CHAPTER 1. INTRODUCTION
Figure 1.8: Example of the period-luminosity diagram (Nakagawa et al. 2016). The red squares are those measurements with VLBI astrometry. Dots are measurements of LPVs in the LMC and labels of C and C’ correspond to the dashed lines at two sequences by Ita et al. (2004)
1.2.1 SiO masers in Mira variables
It is widely known that the extended circumstellar envelope of M-type (Oxygen rich) Mira variables shows one or more of three “classical” maser emissions: SiO, H2O, and OH maser. These masers exist at different distances from the central star as shown in Figure 1.6. In addition, they play an important role in studying kinematics and dynamics of the stellar atmosphere from the inner to the outermost envelope.
SiO masers arise from rotational transitions of excited vibrational states with a high density (> 109 cm−3). The characteristic temperature of the first excited vibrational level (v = 1), about 1800K, requires the region that is inside of the dust formation and wind acceleration point, distance about 3×1013cm from the center of the star. The outer boundary of SiO masers is thought to be limited by the availability of the SiO in the gas phase before its condensation onto dust particles. This region between the photosphere and the dust formation point is sometimes termed as the extended atmosphere, where stellar pulsations, shocks, and localized mass ejections play a large role in governing(determining) the velocity field.
The first detection of SiO maser emissions was achieved by Snyder & Buhl (1974) toward a star-forming region of Orion A. Instantly, stellar SiO masers were discovered toward late-type stars by Thaddeus et al. (1974), Buhl et al. (1974) and Kaifu et al. (1975). Thereafter, thousands of late-type stars, including Mira variables, have been found to emit maser emissions in various SiO transitions.
1.2. MIRA VARIABLES 13
Figure 1.9: SiO v=1 J=1-0 maser emission toward the Mira variable TX Cam using VLBA observation. Each frame is displayed as an intensity contour plot with contour levels at -10, -5, -2, -1, 1, 2, 5, 10, 20, 40, 80, 100% of the frame peak intensity spaced at a phase interval of ∆φ = ∼0.1 (Diamond & Kemball 2003)).
14 CHAPTER 1. INTRODUCTION
High resolution of Very Long Baseline Interferometry (VLBI) observations enables us to obtain spatial distributions of the SiO masers in the stellar atmosphere of the Mira variables. Several observations have verified that the spatial structure tends to show a clumpy and ring-like structure (e.g. Figure 1.9) located between 2 and 4 stellar radii, where the region from the stellar photosphere to the dust formation region (Diamond et al. 1994; Greenhill et al. 1995; Boboltz et al. 1997; Desmurs et al. 2000; Diamond and Kemball 2003; Yi et al. 2005; Cotton et al. 2004 references therein).
Monitoring and multi-transition observations of stellar SiO maser with VLBI also carried out to understand dynamics and kinematics of the stellar atmosphere for Mira variables. Along with theoretical studies, VLBI observations have demonstrated that the stellar atmosphere have complex motions of an expansion, contraction, rotation, asymmetric acceleration, and bipolar outflow with respect to the stellar pulsation (Gray
& Humphreys 2000; Humphreys et al. 2002; Kemball et al. 2009; Assaf et al. 2011; Gonidakis et al. 2010, 2013). Therefore, these VLBI observations using SiO masers are a unique technique for studying complex processes occurring in the inner region of the envelope.
As other classical masers of OH and H2O, an astrometry of SiO masers is available for Mira variables using the VLBI observation. One of essential in several applications of the astrometry is to obtain a distance using an annual (trigonometric) parallax measurement. The parallax is the basic and direct distance measurement without any other calibration or model dependence. By knowing the distance to the star, we can derive several physical parameters, such as an absolute luminosity, a stellar radius, physical scale of orbital separation with component masses and proper motions in actual velocities. For Mira variables, the distance measurement is a vital role in the period-luminosity relation. The classical masers of OH and H2O have been successfully used for measuring the annual parallaxes in star forming regions and late-type stars e.g. comprehensive VLBI parallaxes are listed in Honma et al. (2012) and Reid et al. (2014). However, the parallax measurements of the SiO maser is rare and challenging, and only a few sources have been conducted (Orion KL: Kim et al. 2008; VY CMa: Zhang et al. 2012; R Aqr: Kamohara et al. 2010, Min et al. 2014). The interferometric phase coherence time is only in the order of dozens of seconds and there are very few available extragalactic sources for phase-referencing method at 43 GHz and higher frequencies in the observational and technical scheme. Moreover, typical lifetime of SiO maser components, which is both spatially and velocity coherent, is relatively short and they have complicated internal motions. These make it difficult to estimate the parallax by tracing the SiO maser components.
1.3 R Aquarii
R Aquarii (R Aqr) is one of the well-known symbiotic stars after the discovery by Harding (1816). R Aqr is known to be composed of a Mira variable as a cool late-type and a putative WD as a hot companion. The Mira variable is classified as a M-type (oxygen-rich) star showing an optical variation of over 5 magnitudes with a pulsation period of about 387 days.
1.3. R AQUARII 15
R Aqr shows unique characteristics of (1) two extended inner & outer nebulae, (2) a bipolar jet-like feature, and (3) stellar maser emissions associated with the Mira variable. Numerous studies have been performed to examine those characteristics of symbiotic phenomena toward R Aqr in radio, infrared, optical, ultraviolet, and X-ray wavelength.
Figure 1.10: Images of the R Aqr nebulae. [Left] Optical image taken from Adam Block/Mount Lemmon SkyCenter/University of Arizona. [Right] Optical image over- lapping the geometric structure of the inner & outer nebula (Solf & Ulrich 1985). North is up and East is left.
The extended inner & outer nebulae surrounding R Aqr, also known as Cederblad 211, were first discovered by Lampland (1923a, b). As shown in Figure1.10, the outer nebula consists of two intersecting arc-shaped features of an equatorial dense region extending about 60 arcsec in the East and 70 arcsec in the West direction. The in- ner nebula looks like a wedge-shaped, extending about 30 arcsec in the North-South direction, nearly perpendicular to the outer nebula.
The outer nebula was considered to have an outward motion, which was firstly sus- pected by Hubble (1940, 1943) using the difference of images taken 17 years interval. The outward motion was confirmed by Baade (1943, 1944) using 16-years-apart optical plates. They inferred that the outer nebula was formed by a nova-like eruption ap- proximately 600 years ago. Assuming a constant expansion, they deduced a kinematic distance of 260 pc for R Aqr.
Solf & Ulrich (1985) carried out an extensive study on the R Aqr nebulae using optical spectroscopic observations during 1982 to 1983. They showed that both inner and outer nebula have a same geometrical structure resembling a bipolar and hour- glass-like shape. In addition, they introduced a simple(empirical) bipolar outflow model to describe the structure and expansion of the nebulae. Applying the model to the observations, both inner and outer nebula had a same bipolar axis oriented with a P.A. of 355 degrees and an inclination of 18 degrees with respect to the plane of the sky as shown in Figure1.10. Expansion velocities on the equatorial regions were found to be 32 km s−1 for the inner nebula and 55 km s−1 for the outer nebula, respectively. Solf & Ulrich (1985) also suggested that both inner and outer nebulae are the result of two nova-like ejecting events, which were occurred approximately 185 and 640 years
16 CHAPTER 1. INTRODUCTION
ago. Assuming constant expansion velocities and proposed expansion ages, a kinematic distance is derived from 180 and 185 pc.
For the nova-like ejecting events on R Aqr, Yang et al. (2005) found historical records of two successive outbursts associated with R Aqr in A.D. 1073 and A.D. 1074. The outburst histories were also supported by a nitrate ion recorded in the Antarctic ice core (Tanabe & Motizuki 2012). Yang et al. (2005) suggested that these two records may provide astronomically meaningful constraints to the nebulae formation processes on R Aqr and symbiotic stars as well as the outburst models for other relative objects. In addition, they also derived a kinematic distance of 273 pc for R Aqr assuming the expansion velocity for the outer nebula from Solf and Ulrich (1985).
Recently, Herschel /PACS photometry observed a bright and extended central source with two opposing NE and SW arms in far-IR wavelength (Mayer et al. 2013). The arms reflected parts of the equatorial dense region of the outer nebula observed by Solf & Ulrich (1985). Two different wavelengths (70 µm and 160 µm) of PACS images provided that the arms are inclined by 77 degrees, which implies an elliptical structure of the equatorial dense region rather than circular. If the equatorial dense region of the outer nebula corresponds to the orbital plane, they inferred that the inclination of the binary orbit is also 77 degree with respect to the plane of sky.
Figure 1.11: HST images of the jet and counter-jet of R Aqr (Paresce & Hack 1994). The binary is located at position of M in right figure. (Left) image taken by F190M (UV) filter (Right) image taken by F501N (optical) filter.
The most remarkable characteristic in R Aqr is the bipolar jet-like feature, probably powered by an accretion disk on the WD. The first detection of this feature was re- ported by Wallerstein and Greenstein (1980), who called the feature as “spike”, in the northern portion of R Aqr. Subsequent VLA observations found the jet-like structure to extend about 6-10 arcsec in NE direction with a position angle of 22-24 degree from a central system (Sopka et al. 1982; Spergel et al. 1983). Further radio interferometry observations resolved the structure into (1) a series of knots for the NE jets, (2) a compact region of the central system and (3) SW jets, which are the counterpart of the NE jet. (Hollis et al. 1985, 1986, 1993; Kafatos et al. 1989; Hege et al. 1991). From the observations with different wavelengths, the jet was initially nonthermal radiation,
1.3. R AQUARII 17
Figure 1.12: Chandra X-ray images of R Aqr jet (Kellogg et al. 2007). The images are taken at (Left) 2000.7 and (Right) 2004.0. The arrows point to the central R Aqr binary.
probably produced by a synchrotron emission, and become an optically thick thermal emission (Dougherty et al. 1995).
The Hubble Space Telescope (HST) also detected the jet-like feature in R Aqr as shown in Figure 1.11 (Paresce & Hack 1994). By comparing HST images taken with optical and UV filters, Paresce & Hack (1994) were able to identify a position of the central system, denoted as M. In addition, the jet was clearly shown as a narrow collimated stream tracing down to a distance ranging about 15 AU out to about 750 AU from the central system. The HST data provided that emissions of the jet were due to a shock driven through material left over from an earlier mass ejection and pre-ionized by a hot companion and/or an accretion disk.
In later Chandra X-ray images (Figure 1.12), the series of NE knots were not so well resolved as in the HST observations, but several large clumps were detected, cor- responding to the NE jet, the central source observed in radio and HST. Furthermore, a next strongest SW jet feature was also detected in the X-ray image located at ∼30 arcsec with a P.A. of ∼211 degrees (Kellogg et al. 2001,2007). This SW jet had no counterpart of the radio and optical jet. Further UV spectroscopic observations sug- gested a bow shock model that have a shock speed of approximately 235-285 km s−1 and an inclination angle of about 10 and 35 degrees with the plane of the sky for the NE and SW jets, respectively (Nichols & Slavin 2009). Moreover, both jet features had similar physical parameters indicating a common origin and supporting a precessing accretion disk on the WD in R Aqr system.
Comparing two X-ray images, the central source had shown a morphological change and spectral characteristic between 2000 and 2004. The morphological difference indi- cated a new formation of a SW jet at the inner region of the central source. Contempora- neous VLA observations presented the spectral characteristic supporting a nonthermal, synchrotron emission from the new SW jet at the early stage of the jet development (Nichols et al. 2007).
18 CHAPTER 1. INTRODUCTION
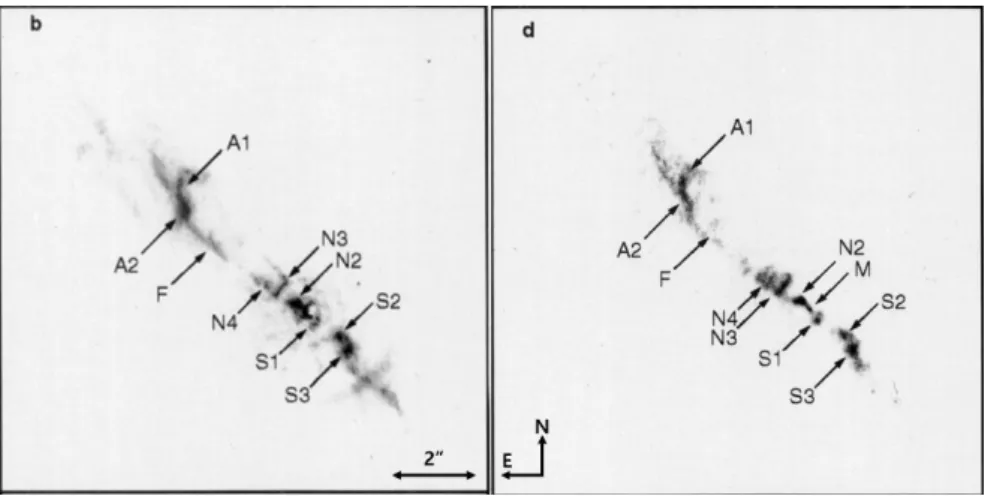
(a) (b)
Figure 1.13: VLBI observation images of R Aqr. (Left) VLBA observation image taken by Boboltz et al. (1997) (Right) VLBA observation suggesting differential rotation shell (Hollis et al. 2001)
R Aqr is one of the symbiotic stars to have circumstellar masers associated with the Mira variable. Since the first detection of a SiO maser toward R Aqr by L´epine et al. (1978), there have been several single-dish observational studies of 43/86/128 GHz SiO masers (Zuckerman 1979; Cohen & Ghigo 1980; Spencer et al. 1981; Mart´ınez et al. 1988; Jewell et al. 1991; Schwarz et al. 1995; Cho et al. 1996; Alcolea et al. 1999; Pardo et al. 2004; Kang et al. 2006) as well as 22/321 GHz H2O masers (Seaquist et al. 1995; Ivison et al 1994, 1998). Through the single-dish observations, the spectra of the SiO maser emission varied from one period to the next period, following the optical light curve with a phase lag of 0.1 to 0.2. This phase lag usually found in SiO masers for Mira variables, and indicated a possibility of a collisional maser pumping mechanism of the SiO maser emission.
The first high spatial resolution of VLBI observations was performed by Boboltz et al. (1997). They obtained four epochs of v = 1, J = 1−0 SiO maser distributions around the Mira variable in R Aqr (Left in Figure 1.13). The SiO maser distributions showed a ring-like structure with approximately 31 mas in radius, corresponding to about 3.4 AU assuming a distance of 220 pc. They argued that the SiO maser is located within 2-4 stellar radii, where the region is an outside of a stellar photosphere and inside of a circumstellar dust shell, similar to those of isolated AGB stars and Mira variables. In addition, they measured an averaged inward proper motion of ∼4 km s−1 for SiO maser components. Subsequent VLBA observations of SiO masers were performed by Hollis et al. (2001) and Cotton et al. (2004, 2006). Especially, Hollis et al. (2001) observed a velocity pattern implying a differential rotation in the SiO maser (Right in Figure 1.13). They suggested that the rotating maser shell has a rotational period between 8
1.3. R AQUARII 19
to 34 years following a quasi-keplerian rotation as v ∝ (1/rq)1/2, where q ≈ 1.09. In a precedent study with VERA, Kamohara et al. (2010) observed both v = 1 and v = 2 J = 1 − 0 SiO maser transitions simultaneously toward R Aqr. Assuming a position of the Mira variable from the SiO maser distribution, they measured a parallax of π = 4.7 ± 0.8 mas, corresponding to a distance of 214+45−32 pc with proper motions of (µRA, µDec) = (32.2 ± 0.8, −29.5 ± 0.7) mas yr−1 in the right ascension and declination, respectively. They also confirmed that both of the SiO maser transitions appeared in similar regions, but not exactly coincident within the spatial and spectral resolution. This result demonstrated that new theoretical studies are required for looking into the finer details of the maser emissions around Mira variables.
1.3.1 Orbital parameters for R Aquarii
Since the nature of symbiotic stars, there have been several attempts to define orbital parameters for R Aqr. However, its solution still has wide differences and large uncer- tainties. To date, the determination of the orbital parameter for R Aqr is a debatable issue.
Table 1.3: Summary of historical orbital parameters for R Aqr
T0 Period V0 e ω a sin i
(JD) (yr) (km s−1) (deg.) (AU)
(1) 2429850 26.7 −42 0.5 265 22.7
(2) 2442100 44 −28.4 0.6 0 5.91
(3) 2442100 44 0.8 ±90 16.4 ± 0.5
(4) 2444349 ± 292 34.6 ± 1.2 −26.5 ± 0.3 0.52 ± 0.08 110.7 ± 18.4 3.5 ± 0.4 (5) 2444019 ± 728 43.6 ± 1.3 −24.9 ± 0.2 0.25 ± 0.07 106 ± 19 5.68 ± 0.85
(1) Merrill (1950) (2) Hinkle et al. (1989) (3) Hollis et al. (1997) (4) McIntosh & Rustan (2007) (5) Gromadzki & Miko lajewska (2009)
Table 1.3 is the summary of historical results of the orbital parameter analysis for R Aqr. The first orbital solution for R Aqr was reported by Merrill (1950), who used radial velocities of nebular emissions of [O iii] and [Ne iii] taken from 1920 to 1950. However, their solution was disproved by Jacobsen & Wallerstein (1975), who showed the nebular emissions did not vary periodically and not directly connected to the true orbital motion.
Willson et al. (1981) suggested an orbital period of ∼44 yr from the light curve of R Aqr. They found that the maximum brightness of the light curve had been depressed by over two magnitudes in comparison with the usual brightness between 1974 and 1980. A similar event was also discovered from 1928 to 1935. Willson et al. (1981) interpreted that the depressions of the light curve were attributed to the obscuration of the Mira variable by an extended accretion disk or dusty cloud around the companion. The orbital period of 44 yr for R Aqr was supported by later spectroscopic observations in the optical (Wallerstein 1986) and the infrared (Hinkle et al. 1989).
In an attempt to resolve the binary components of R Aqr, Hege et al. (1991) car- ried out speckle interferometry with a 1.8 nm bandpass centered on Hα (λ6563) in
20 CHAPTER 1. INTRODUCTION
October 1983. They obtained three components of a bright central component (C1) and relatively fainter components in NE (C2) and SW (C3) of the central component in a 45-mas-resolution image. The C1 was the brightest Hα source, probably arising from a hot companion and its accretion disk. The C2 was the weakest Hα components and corresponded to a radio jet-like feature observed by Hollis et al. (1986). On the other hand, the C3 had no radio counterpart, and the origin was unknown. They sur- mised that the C3 component might be associated with the Mira variable or another unidentified jet feature.
Another attempt to resolve the binary components was performed by Hollis et al. (1997), who simultaneously observed a 43 GHz of SiO maser emission with a 3.125 MHz bandpass and an adjacent lineless continuum emission with a 50 MHz bandpass using VLA. They were motivated to resolve the binary components because the SiO maser is associated with the Mira variable and the continuum comes from the Hii region, presumably surrounding the hot companion/accretion disk. The position of the continuum was found to lie 55 ± 2 mas with a P.A. of 18 ± 2 degree relative to the position of the SiO maser measured by elliptical Gaussian fittings. With reasonable assumptions of the orbital period of 44 yr, they suggested a preliminary estimation of the orbital parameters. In addition, they argued that if these parameters are accurate, then the component C3 observed by Hege et al. (1991) is probably a knot of emission in the jet, rather than the Mira variable.
(a) McIntosh & Rustan (2007) (b) Gromadzki & Miko lajewska (2009)
Figure 1.14: The radial velocities and fitted orbital models for R Aqr.
Recently, McIntosh & Rustan (2007) collected an extensive, wide range of radial velocity data for R Aqr in visual, near-infrared and radio wavelength in a period be- tween 1946 and 2007. As shown in Figure 1.14, they derived the orbital parameters from radial velocity analysis. However, the orbital period was 34.6 ± 1.2 yr, and their solution indicated a system mass function of f (M ) = 0.043 M⊙applying the inclination of 72 degree by Solf & Ulrich (1985). This mass is far less than assumed mass of the R Aqr system. To reduce and eliminate this problem, they suggested that the orbital inclination of the orbit is small of approximately 20 degrees.
1.4. VLBI ASTROMETRY 21
Subsequently, Gromadzki & Miko lajewska (2009) complemented and reanalyzed the data collected by McIntosh and Rustan (2007) and obtained the orbital parameters of R Aqr as shown in Figure 1.14. Their solution was consistent with the previous orbital period by Willson et al. (1981) and indicated a reasonable system mass function of f (M ) = 0.096+0.042−0.032 M⊙. Comparing the VLA observation by Hollis et al. (1997), their orbital parameters were consistent under the assumption of a distance lower than 200 pc. According to their orbital model, the last obscuration, called “Eclipse” event coincided with the predicted time from their orbital model.
1.4 VLBI astrometry
VLBI (Very Long Baseline Interferometry) is a technique which combines the radio emission simultaneously observed with several not-physical-connected radio telescopes. Distances between the telescopes of array range up to a few thousands of kilometers to achieve the high angular resolution in astronomy.
Special VLBI observational method called “phase-referencing” allows us to conduct precise astrometry of astronomical maser with accuracy much less than 1 mas. This method requires a reference source close to the target source (typically within a few degree separation) in order to compensate interferometric fringe(visibility) phase vari- ations mainly caused by atmospheric fluctuations. Detail descriptions can be found in Thompson, Moran and Swenson (2001), Alef (1989), and Beasley and Conway (1995). In interferometry observations, the phase Φ, which is given by the path-length difference of the signals from the different stations, contains the information about the position of the observed source. The output of a quasi-sinusoidal correlator response in an interferometry is expressed as V = A × exp(i(ΦT − ΦM)) for each antenna pair at frequency ν, where A is the visibility amplitude, ΦT is the measured total phase and ΦM is the modeled correlator phase. Since the correlator model phase has a limited accuracy, there exists residual phase error. This residual can be written as
Φresi = ΦV + Φinst+ Φant+ Φpos+ Φatmo+ Φiono (1.1) where ΦV is the visibility phase for extended source (visibility phase for the point source is zero), Φinstis the instrumental phase (effected by telescope path-length (cable) changes and so on ), Φantand Φposare the error of the antenna and source positions, and Φatmo and Φiono are the phase error caused by the neutral atmosphere and ionosphere, respectively. If the target source is strong enough and its absolute position is not needed, these residual phases are generally corrected by using the source itself (global fringe-fitting and self-calibration).
For determining the position of the source, “phase-referencing” can be used to correct these phase errors by using the reference source closed to the target source. The concept of phase-referencing is that the target source phase can be corrected by interpolating the reference source phase. Considering the three measured phases, the reference (at time t1) – target (at time t2) – reference again (at time t3) sequentially, the measured phases for the target and reference source will be
22 CHAPTER 1. INTRODUCTION
Φrefresi(t1) = ΦrefV (t1) + Φrefinst(t1) + Φrefant(t1) + Φrefpos(t1) + Φatmoref (t1) + Φrefiono(t1) Φtarresi(t2) = ΦtarV (t2) + Φtarinst(t2) + Φtarant(t2) + Φtarpos(t2) + Φatmotar (t2) + Φtariono(t2) Φrefresi(t3) = ΦrefV (t3) + Φrefinst(t3) + Φrefant(t3) + Φrefpos(t3) + Φrefatmo(t3) + Φrefiono(t3) (1.2) Then differencing the target and interpolated reference source phase, the difference phases will be
Φtar− eΦref = (ΦtarV − eΦrefV ) + (Φtarinst− eΦrefinst) + (Φtarant− eΦrefant) + (Φtarpos− eΦrefpos) +
(Φtaratmo− eΦrefatmo) + (Φtariono− eΦrefiono) (1.3) where eΦref is the interpolated phase at time t2. Assuming that both the interpo- lated reference and target data are equally affected by the instrumental, atmospheric, ionospheric, antenna position error, and that the reference source is a point source (ΦrefV (reference visibility) or its structure is known, then, the phase difference between the reference and target source is obtained as follows.
Φtar− eΦref = ΦtarV + (Φtarpos− eΦrefpos) (1.4) Thus, phase-referenced phase difference only depends on the structure of target source ΦtarV and the difference in relative position between the reference and target source. This means that the result of phase-referenced difference contains only the information about the position of target source relative to the reference source (with the structure). Sometimes the phase-referenced result contains the errors occurred by fluctuations of the total path length in the atmosphere and the interpolation error due to the time difference between two reference source scans. The VERA (VLBI Exploration of Radio Astrometry) has a dual beam system, and observes the target and reference source simultaneously, reducing these phase errors effectively.
1.4.1 VERA projects
The VERA (VLBI Exploration of Radio Astrometry) in NAOJ (National Astro- nomical Observatory of Japan) is a Japanese VLBI array aimed at obtaining 10 micro- arcsecond (10 µas) level accuracy of the parallax and proper motions for CH3OH, H2O and SiO maser sources using the phase-referencing VLBI observation (Honma et al. 2000).
The VERA array consists of four 20-m-diameter stations in Japanese archipelago lo- cated at Mizusawa (Iwate Prefecture), Iriki (Kagoshima Prefecture), Ogasawara (Tokyo), and Ishigaki-jima(Okinawa Prefecture), providing six baselines with the maximum length of 2270 km (Mizusawa to Ishigaki) and the minimum of 1019 km (Iriki to


![Figure 1.10: Images of the R Aqr nebulae. [Left] Optical image taken from Adam Block/Mount Lemmon SkyCenter/University of Arizona](https://thumb-ap.123doks.com/thumbv2/123deta/6162059.104243/27.892.168.787.300.510/figure-images-nebulae-optical-lemmon-skycenter-university-arizona.webp)