sustainability
ISSN 2071-1050 www.mdpi.com/journal/sustainabilityArticle
Lithium-Ion Batteries: Thermal Behaviour Investigation of
Unbalanced Modules
Odile Capron *, Ahmadou Samba, Noshin Omar, Thierry Coosemans, Peter Van den Bossche and Joeri Van Mierlo
MOBI—Mobility, Logistics and Automotive Technology Research Centre, Vrije Universiteit Brussel, Pleinlaan, 2, Brussels 1050, Belgium; E-Mails: [email protected] (A.S.);
[email protected] (N.O.); [email protected] (T.C.); [email protected] (P.V.B.); [email protected] (J.V.M.)
*Author to whom correspondence should be addressed; E-Mail: [email protected]; Tel.: +32-2-629-3396.
Academic Editors: Cornelia A. Bulucea and Nikos E. Mastorakis
Received: 3 June 2015 / Accepted: 23 June 2015 / Published: 29 June 2015
Abstract: In this paper, the thermal behaviour of an unbalanced battery module made of large lithium iron phosphate cylindrical cells of 18 Ah nominal capacity is investigated during its discharge with 18 A, 54 A and 90 A currents. For this study, several cells were assigned in the module to 5%, 10% and 20% initial depth of discharge (DoD). The thermal management of the cells in the module is achieved based on a forced air cooling. The computations of the temperature distribution inside the cells and the module are performed with a two-dimensional modelling approach. During the discharges, the cells with a non-zero initial DoD show a more pronounced temperature increase up to 5% compared to the reference cells. In the end of the three discharges, the highest temperatures 26.5◦C (18 A), 29.6 ◦C (54 A) and 32.3 ◦C (90 A), respectively, are reached for the cells with the highest initial DoD. For these cells, with the increase in the current rate, the highest amount of total heat exceeds 25 W. The reactive and the active heats are found to be the main contributors to the total heat generated by the cells. This study provides the effect of the initial DoD of the cells on the temperature development occurring in an unbalanced battery module during its discharge.
1. Introduction
With their sustainable character and reliable performances as energy storage systems, batteries represent more than ever a relevant solution for use in current and future electromobility [1–5]. However, temperature affects the performances of the batteries and the overall performances of the electric vehicles by influencing, among others, their lifetime, their power and energy capabilities and their reliability [6,7]. For lithium-ion batteries, the best operating temperatures are in the range between 25◦C and 40◦C [7]. To avoid the occurrence of an excessive temperature rise [8] leading to the degradation in their lifetime or, even worse, to the thermal runaway phenomenon, the local temperature of lithium-ion batteries should be carefully monitored. For a battery module, the operating temperature and the uniformity of the temperature distribution are two important factors [9]. Inside the modules, the non-uniformity of the temperature can even lead to the non-uniformity of the performances of the individual cells [6].
For these reasons, battery thermal management systems are developed for these modules. The goal of these systems is to regulate the temperature of the cells in the battery module to extend their lifetime and increase their performances by keeping the cells in their best operating ranges. These systems are either active or passive and should be designed based on the conditions in which the modules will operate. To avoid premature aging of the cells leading to the increase in their internal resistance and their capacity loss, battery management systems should be able to keep the differences between the temperature of the cells less than 5 ◦C [10]. Passive thermal management with a thermal phase change material, such as graphene, has been demonstrated to be suitable in [11,12] for lithium ion batteries and particularly for cylindrical cells. Passive thermal management solutions via enhancement of lithium-ion battery electrodes have also been investigated in [13] with multi-walled carbon nanotubes to achieve a higher in-plane thermal conductivity of the electrodes and in [14] with a very thick anode to achieve high thermal and electrical conductivity, respectively. In the case of active systems, thermal management can either be air- or liquid-based. Compared to liquid-based thermal management, air-based systems are less expensive, because no additional costs are required for the implementation of cooling channels into the structure of the modules [10]. The air in the air-based thermal management systems is blown from the heat exchanger towards the cells inside the module, which in turn blows the heated air out of the module. In the literature, research has been done on the thermal management of battery modules implementing a forced air cooling.
For modules made of cylindrical cells, a three-dimensional electro-thermal model has been achieved in [15] for the study of a battery module made of 26,650 (0.026 m diameter) cells. A three-dimensional electrochemical-thermal model was developed in [16] for the investigation of a battery module made of 18,650 (0.018 m diameter) cylindrical cells. For the study of an in-line battery module made of 26,650 cylindrical cells, the authors in [17] used a two-dimensional computational fluid dynamics model in which the heat generation has been derived from a temperature-dependent correlation of the electrical resistance of the cells. For the thermal management study of a battery module made of LiMn2O4 cylindrical battery cells, a two-dimensional computational fluid dynamics model has been developed in [18].
discharge (DoD). In practice, differences in the initial DoD of the cells in a battery module can occur. As mentioned in [19], the series connection of the cells in a module can be used in electric vehicles (EVs) and hybrid electric vehicles (HEVs) to allow one to reach the required voltages. Although in this configuration, even if the current in each cell is the same, voltage differences from cell to cell may occur. During their discharge and their charge, because of the voltage unbalances, the weakest cells in the module will reach the cut-off voltage first and suffer from over-discharge or over-charge. In the worst case (e.g., failure of the balancing system of the battery module), these weakest cells may lead to fast and large internal temperature increases inside the cells and to reductions of the performances of the module. So far in the literature, no two-dimensional study has been conducted regarding the thermal behaviour of battery modules made of large cylindrical cells, and no specific study has been addressed regarding the thermal behaviour during the discharge of unbalanced battery modules, including cells at different initial depths of discharge.
It is why in this paper, the thermal behaviour of an unbalanced battery module is achieved through its analysis during a discharge performance test defined by several discharges at different constant current rates and a 25 ◦C operating temperature. The studied battery module is made of large-size (0.06 m diameter) cylindrical lithium iron phosphate cells of 18 Ah nominal capacity. For the modelling, a two-dimensional approach has been used. Based on this modelling approach, the effects of the initial depth of discharge of the cells, the discharge current rate and the inlet air velocity on the temperature distribution inside the battery module are investigated. The results demonstrate an increase in the temperature and the heat generation of the cells with the increase in the initial DoD and the discharge current rate applied to the cells.
2. Module Description
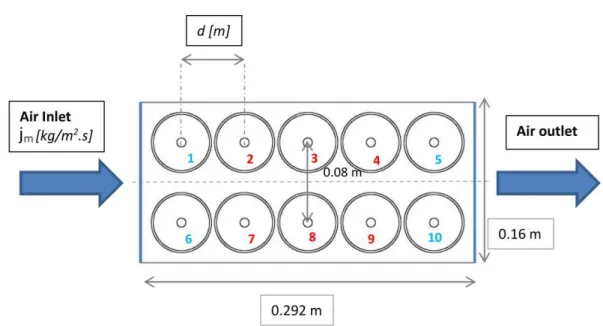
In the context of a previous study, the thermal conductivity of large-size cylindrical cells in the longitudinal direction was observed to be much greater compared to the thermal conductivity value in the radial direction [20]. Therefore, for a single cell, the temperature gradients observed in the longitudinal direction are significantly lower in value compared to the ones in the radial direction. Considering the smaller temperature difference in the longitudinal direction of each single cell at the end of a 90 A constant current discharge compared to the radial direction, a reduced two-dimensional thermal study of the module is achieved in this paper. With its accuracy and its reduced computational time, this two-dimensional modelling approach is suitable for the study of battery modules made of large cylindrical cells, as investigated in this paper. The schematic of the module is presented in Figure1. The distance from the top and the bottom of the cells to the sides of the module, as well as the distance from the left- and right-hand side of the cells to the sides of the module are equal to 0.01 m.
Figure 1. Schematic of the battery module.
3. Mathematical Modelling of the Module
The modelling of the large-size and high-power lithium iron phosphate cylindrical cells (GAIA HP 601300 LFP) involves different length scale physics. In order to study the thermal behaviour of these cells, a coupled electrochemical-thermal model was implemented, whose input parameters are the electrical, the chemical and the thermal parameters of the cells. COMSOL Multiphysics 4.3 ⃝R and
MATLAB R2012a⃝R were used as simulation tools for the solving and the processing of the multi-scale
equations governing the behaviour of the module and the cells.
3.1. Governing Equations
3.1.1. Electrochemical Equations of the Cells
In this study, the electrochemical modelling of the cells is based on the pseudo-two-dimensional (P2D) model of Doyleet al. [21,22]. The governing non-linear partial differential equations (PDEs) and their constitutive equations are summarized in Table1for the modelling of the behaviour of the cells by means of transport phenomena and electrochemical relationships.
During the discharge of the cells, the electrochemical processes are characterized by the conversion of the chemical energy into electrical energy and vice versa during the charge of the cells. These energy conversions are observed at the solid electrolyte interface (SEI) according to the electrochemical reactions taking place at the cathode (Equation (1)) and the anode (Equation (2)).
xLi+
+xe−+Li1−xF eP O4 ⇀↽ LiF eP O4 (1)
Table 1.Electrochemical governing equations of the cells.
Physics Governing Equations Mathematical Expressions
Chemical kinetics
Butler–Volmer equation jLi=as·i0{exp(αRTaηF)−exp(−αRTcηF)}
Electrode overpotential η= (ϕs−ϕe)−U
Exchange current density i0=k·(ce)αa·(cs,max−cs,e)αa·(cs,e)αc
Charge conservation
Solid phase ∇(σef f · ∇ϕs)−jLi= 0
Electrolyte phase ∇(κef f · ∇ϕe) +∇(κef fD ∇ln(ce)) +jLi= 0
Mass Transfer
Species conservation in solid phase ∂cs
∂t =
Ds
r2
∂ ∂r(r
2·∂cs
∂r)
Species conservation in electrolyte ∂(ϵe·ce)
∂t =∇(D
ef f
e ∇ce) + 1−t+
F ·j
Li
The electrochemical parameters of the lithium iron phosphate cylindrical cells obtained from the literature are summarized in Table 2. Since the electrochemical parameters are intrinsic to the battery chemistry type, no effects due to the difference in scale between the large-size cylindrical cells and the cylindrical cells in [23,24] were expected nor observed.
Table 2. Electrochemical parameters of the cells.
Parameters Anode Separator Cathode
Thickness[24], (m) 3.4×10⁻⁵ 2.5×10⁻⁵ 8×10⁻⁵ Active material volume fraction[24], (/) 0.58 0.55 0.374 Filler volume fraction[24], (/) 0.0326 - 0.0535 Volume fraction electrolyte, (/) 0.3874 0.45 0.5725 Particle radius[24], (m) 5×10⁻⁶
- 5×10⁻⁸ Electrolyte phaseLi+diffusion[24], (m2/s) 2×10⁻¹⁰
Initial electrolyte concentration[23], (mol/m3) 2000
Maximum solid phase concentration[24], (mol/m3) 30,555 - 22,806
For the lithium ion diffusion and the reaction rate coefficients of both negative and positive electrodes, the temperature dependence is considered with the Equations (3) and (4).
Ds,i=Ds,i,25◦C·exp (
Ea,Ds,i
R · ( 1 298K − 1 T )) (3)
ki =ki,25◦C ·exp (
Ea,ki
The values forDs,i,25◦C andEa,Ds,i andki,25◦CandEa,ki were equal to1×10−13m2/s and20kJ/mol
for the positive electrode [25] and3×10−14
m2/s and4kJ/mol for the negative electrode [25].
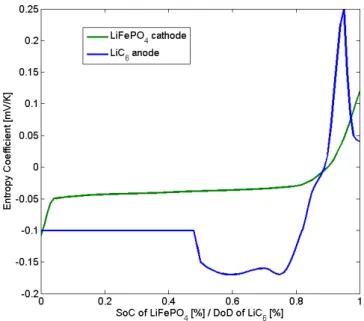
The evolutions of the potential of the anode and the cathode during the discharge of the cells are illustrated in Figure2. At the anode, an increase in the open circuit potential occurs, while at the anode, a decrease occurs. The variations of these open circuit potentials with the temperature define the entropy coefficient of the electrodes, which are represented in Figure3.
Figure 2. Open circuit potential of the electrodes.
Figure 3. Entropy coefficient of the electrodes.
3.1.2. Electrochemical-Thermal Equations of the Cells
ρcp· ∂T
∂t =∇(k∇T) +Q (5)
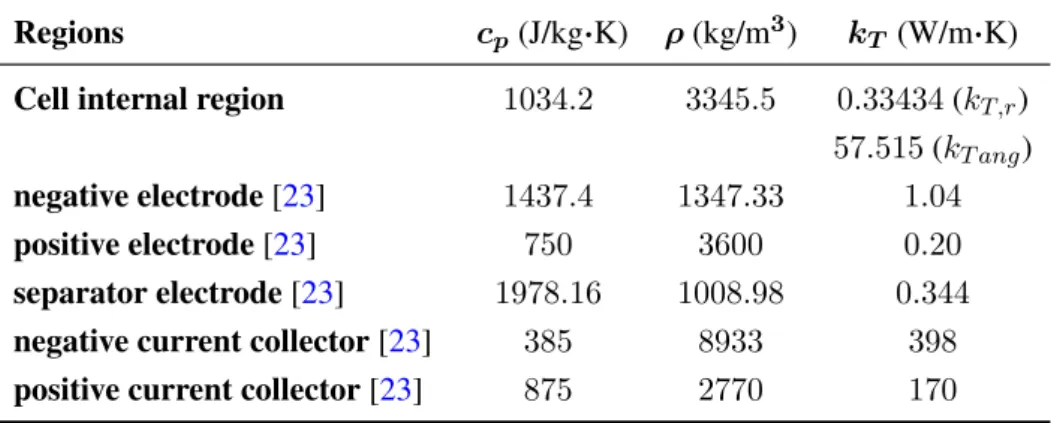
whereρrepresents the density,cpthe heat capacity,T the temperature,kthe thermal conductivity andQ the heat generation. The internal region, the electrodes and the separator thermo-physical properties of the cells are presented in Table3.
Table 3. Cell internal region, electrodes and separator thermo-physical properties.
Regions cp(J/kg·K) ρ(kg/m3) kT (W/m·K)
Cell internal region 1034.2 3345.5 0.33434(kT,r) 57.515(kT ang) negative electrode[23] 1437.4 1347.33 1.04 positive electrode[23] 750 3600 0.20 separator electrode[23] 1978.16 1008.98 0.344 negative current collector[23] 385 8933 398 positive current collector[23] 875 2770 170
To study the thermal behaviour of the cells based on their electrochemical-thermal modelling, the internal region of the cells (or active material region) were considered as homogeneous. With this approach, the properties of the internal region of the cells were defined by the mean values of the thermo-physical properties associated with each layer inside the cells. This is assuming perfect thermal contact existing between the different layers thanks to the electrolyte that surrounds the electrodes and the separator layers and fills in, therefore, the gaps that would lead to differences in the temperature of the different layers. For the modelling, as in Inui et al. [26], the centers of the cells were filled in with air.
In the module, a time varying heat generation and a transient heat transfer are considered for the cells. The heat generationQinside the cells is derived from Equation (6):
Q=jLiT(∂U ∂T) | {z } reactive heat
+jLi(ϕ
s−ϕl−U)
| {z }
active heat
+ [σef f
s ∇ϕs∇ϕs+σlef f∇ϕl∇ϕl+κef fD ∇ln(cl)∇ϕl]
| {z }
ohmic heat
(6)
where jLi is the transfer current due to the intercalation or deintercalation of lithium ions, ϕ
s is the potential of the solid phase,ϕlis the potential of the electrolyte phase,U is the open circuit voltage,T is the temperature, σef f
s is the effective value of the electrical conductivity of the solid phase, σ ef f l is the effective value of the electrical conductivity of the electrolyte phase andclrepresents the concentration of the electrolyte [27]. By definition,κef fD is given by Equation (7):
κef fD = 2RT σ ef f
l (1−t+)
where R represents the universal gas constant equal to 8.314 J/mol·K, T is the temperature, σef fl is the effective electrical conductivity of the electrolyte,t+ is the transference number of lithium ions and F represents the Faraday constant, which is equal to 96,485C/mol[27].
The first term in Equation (6) defines the reactive heat; the second term defines the active heat; while the third one (in brackets) defines the ohmic heat generation [23,28]. By definition, the active and the reactive heat generations take place at the negative and the positive electrodes, while the ohmic heat generation originates from the electrolyte and both the negative and positive electrodes. To convert the volumetric heat generation given by Equation (6) into a heat generation expression in Watts, Equations (8) and (9) [29] are introduced:
L=πN(D+d)
2 (8)
Vi = 2wihL (9)
whereL represents the total length of the spiral formed by the layered internal region of the cell,N is the total number of layers inside the cell,Dis the diameter at the end of the spiral (or the cell diameter), dis the diameter at the beginning of the spiral (or the internal diameter of the cell),Vi is the volume of a layer,wi is the width of a layer inside the cell,his the height of the cell andiidentifies each layer.
3.1.3. Thermo-Hydrodynamic Equations of the Module
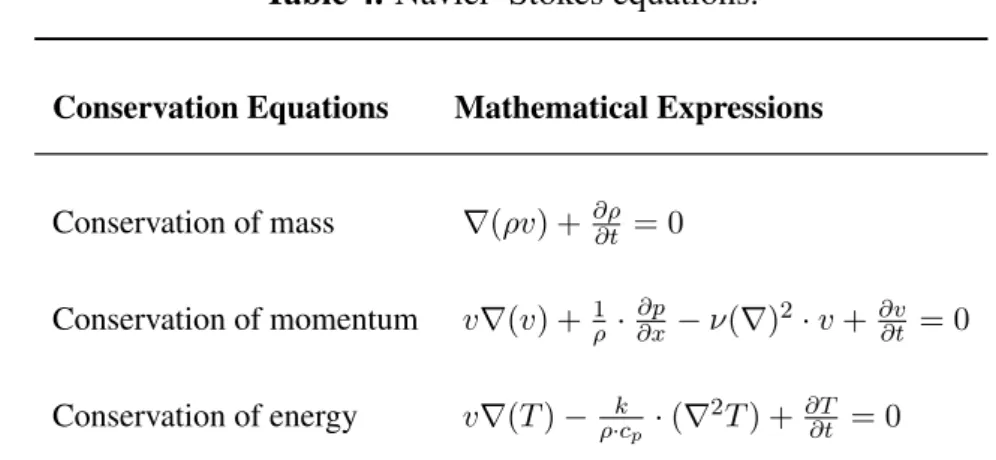
The modelling of the thermal behaviour of the air flow in the module is achieved with the two-dimensional formulation of the Navier–Stokes equations (conservation of mass, conservation of momentum and conservation of energy) defined in Table4. In these equations, the air flow is considered as steady (∂v
∂t = 0), and its properties at the entrance temperature are assumed to be constant in time(∂ρ∂t = 0).
Table 4. Navier–Stokes equations.
Conservation Equations Mathematical Expressions
Conservation of mass ∇(ρv) +∂ρ∂t = 0
Conservation of momentum v∇(v) +1 ρ·
∂p
∂x−ν(∇) 2
·v+∂v∂t = 0
Conservation of energy v∇(T)− k ρ·cp ·(∇
3.2. Boundary Conditions
At the entrance of the module, the temperature is set constant to25◦C, and the velocity of the inlet air is considered to be unidirectional in the axial direction: vx = v (m/s) andvy = 0(m/s). At the exit of the module, a pressure equal to 1 atm is defined and the normal gradient of the temperature is set to zero: ∂T∂n = 0. To bound the fluid and the solid regions, walls boundaries are defined for the cells and the upper part of the module casing. At the interface between the cells and the air, the no-slip condition is defined, so that the normal velocity of the air is equal to zero. The module is considered to be thermally insulated from the ambient environment, so that no transfer of heat and no variation of the temperature occurs through the outer walls of the module casing: ∂T∂n = 0. The uniformity of the temperature and the heat flux are considered at the interfaces between the cells and the air. To reduce the computational effort of the simulations, a symmetry axis has been introduced in the module, so that the simulations are achieved on its half only. At this symmetry axis, the normal velocity of the air and the normal gradient of the temperature are set to zero: vn = 0and ∂T∂n = 0.
3.3. Numerical Solution and Validation
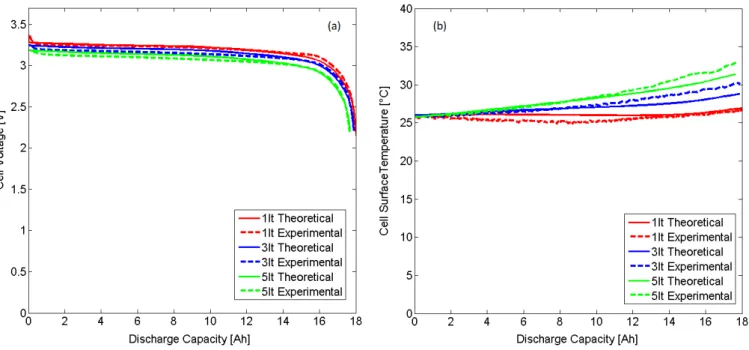
Figure 4. Validation of the voltage (a) and the temperature (b) of the cell.
The numerical simulations of the thermal behaviour of the module are based on the solving of the governing equations for the battery cells and the cooling air on half of the module, by using the symmetry property highlighted in Figure 1. The simulations used a MUMPS (Multifrontal Massively Parallel Solver) time-dependent solver with a relative tolerance of10−3
for all of the variables to obtain the solutions for which the mesh independence was verified. The meshing of the module is achieved with 487,562 triangular elements and a 0.000402 maximum element size. The solving of the module governing equations for the computation of the numerical solutions was achieved based on a segregated approach. At each time step, the Navier–Stokes equations are solved at each node of the mesh to compute the temperature and the air velocity inside the module, from which the temperature solution serves as input for the solving of the electrochemical-thermal equations governing the behaviour of the cells.
4. Results and Discussion
4.1. Module Design Considerations 4.1.1. Influence of the Cooling
Figure 5. Closed module at the end of (a) 18A and (b) 90A constant current discharges.
4.1.2. Influence of the Air Flux
Figure6b illustrates the cooling of a battery module discharged with a high current rate (90 A). For cooling purposes, a0.024kg/m2
.s air flux is entering at 25◦C on the left-hand side of the module. From Figure6b, the maximum air velocity is equal to 0.14m/s and is reached in the channel made between the two rows of cells. In the regions between the cells and the upper and lower sides of the module, the air is slowed down by the geometry configurations of the cells in the module. At the end of the discharge, Figure6b indicates lower temperatures (around 25◦C) at the front and higher temperatures (around 30◦C) at the rear of the module. Therefore, Figure6b emphasises the need for a sufficient inlet air velocity for a proper thermal management of the cells located in the rear of the module.
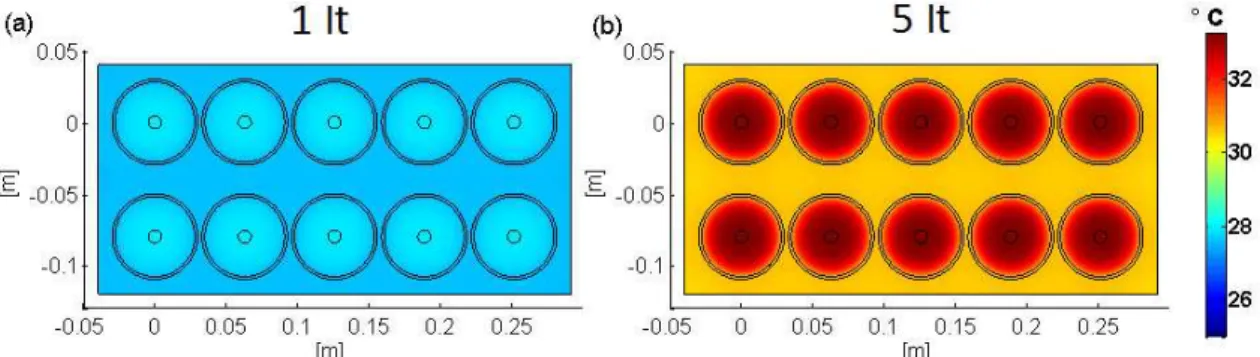
Figure 6. Temperature distribution at the end of the discharge of a module initially at25◦C (a) without cooling and (b) cooled with air(jm = 0.024kg/m2·s).
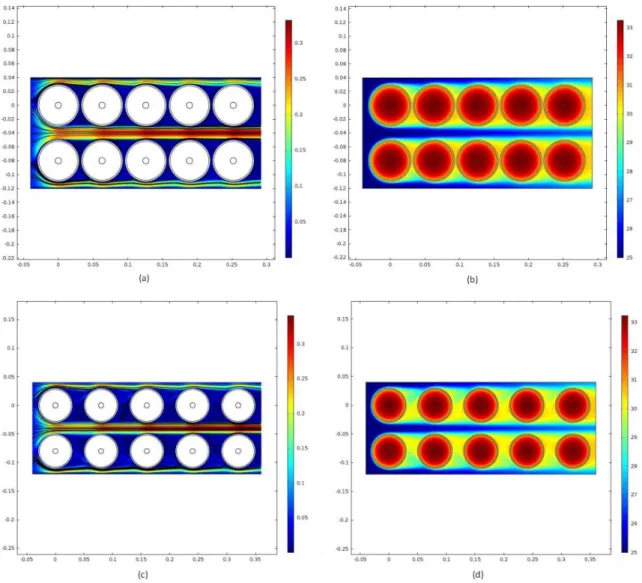
Figure 7. Air velocity field (m/s) (a,c) and temperature distribution (◦C) (b,d) for a cooled module with 0.063 m cell inter-distance and air fluxes equal to 0.024 kg/m2
·s and0.059kg/m2
·s.
4.1.3. Influence of the Spacing
To assess the influence of the spacing between the cells on the same row, on the temperature distribution in the battery module, the distance between two consecutive cells has been increased from 0.063 m (in Figure 8b) to 0.08 m (in Figure 8d). The air velocity field inside the module is illustrated in Figure8c. In this figure, the flow of air in between the cells on the same row is facilitated, although because the velocity of the air in these regions has not increased, no significant decrease in the temperature is observed in Figure 8d in these regions. Considering this, the spacing between the cells has therefore a rather limited influence on their cooling.
arrangement of cells, the lower the pressure drop throughout the module will be and the better the cooling of the cells is achieved. After examination, the pressure drop across the module is less than 1% for both 0.063 m and 0.08 m spacings between the cells. In addition, no significant decrease in the temperature is observed between the cells with an increased spacing of 0.08 m between the cells. Therefore, the module design with 0.063 m spacing is chosen as a valuable design for study purposes of the unbalanced battery module.
Figure 8. Cooled module (jm = 0.059 kg/m2·s) with 0.063 m and 0.08 m cells inter-distance: air velocity field (m/s) (a,c) and temperature distribution (◦C) (b,d).
4.1.4. Validation of the Computational Fluid Dynamics Model
N uD = 0.93×0.52×Re0D.5P r 0.36
100≤ReDmax≤103
N uD = 0.93×0.27×Re0D.63P r 0.36
103
≤ReDmax≤2.105
(10)
For validation purposes, the theoretical Nusselt number is computed based on the simulations results with Equation (11a), in which the convection coefficienthis determined from the total heat transfer rate from the battery cells to the air surrounding them (Equation (11b)).
N uD = hk·D
f (a)
˙
Q=hN πDL·∆Tlm=ρvNTSTL·cp ·(Ti−To) (b)
(11)
In Equation (11b), ∆Tlm represents the log mean temperature difference, which is described in Equation (12).
∆Tlm =
((Tw−Ti)−(Tw−To) ln((Tw−Ti)/(Tw −To))
(12)
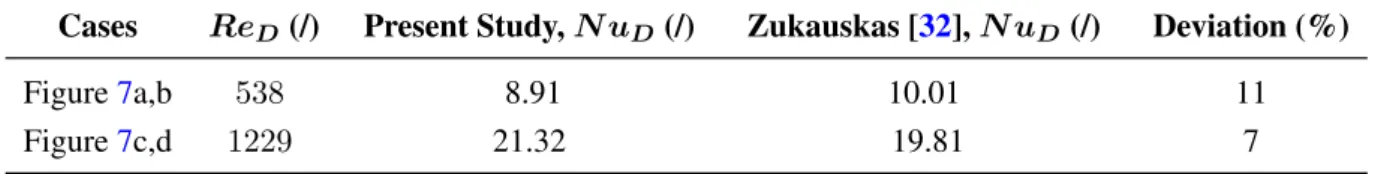
Table 5 summarizes the results obtained for the Nusselt number based on both experimental correlations and simulations. The comparison of these values outlines the good performances of the CFD model and the simulations of the module with a maximum of 11% deviation between the theoretical and the experimentally-correlated Nusselt numbers.
Table 5. Comparison of the Nusselt numbers for the CFD model validation.
Cases ReD(/) Present Study,N uD(/) Zukauskas [32],N uD(/) Deviation (%)
Figure7a,b 538 8.91 10.01 11
Figure7c,d 1229 21.32 19.81 7
4.2. Unbalanced Battery Module
Table 6. Initial depth of discharge of the cells
Cell number Initial Depth of Discharge
2 5%
3 10%
4 20%
4.2.1. Voltage of the Cells
Figure9shows the voltage of the cells in the module initially at different DoD during their discharges at 1It, 3Itand 5Itcurrent rates. Figure9emphasises the faster voltage drop of the cells in time, with the increase in their initial DoD and the discharge current rate.
Figure 9. Voltage of the cells during their discharge with different current rates.
4.2.2. Temperature Distribution
or 6%, while at the end of the discharge with 90 A an increase equal to 7.3◦C or 29% is observed in the temperature of this cell.
Figure 10.Temperature increase of the cells and temperature distribution in the module after its discharge with 18 A (a,d), 54 A (b,e) and 90 A (c,f) currents.
Figure11illustrates the evolutions of the maximum temperature of the cells during their discharges with 18 A, 54 A and 90 A. At low current rates, the evolutions of the maximum temperature of the cells are limited, which reflects the small increases in the surface and the internal temperatures observed for the cells. This can be explained by the fast equilibrium reached at low current rates between the heat generated inside the cells and the heat removed out of the cells. With the increase in the current rate, the curves show steeper slopes, which indicates that faster temperature rises occur during the discharge of the cells. This is due to the larger amount of heat generated inside the cells at high current rates, which prevents the cells from achieving, in a shorter time, a proper dissipation of the heat towards the air in the module.
the increase in the temperature of Cell 4 is four-times greater compared to that of the reference cells. Figure 11also demonstrates therefore the increase in the maximum temperature of the cells with their initial DoD.
Figure 11. Evolution of the maximum temperature of the cells during (a) 18 A (b) 54 A and (c) 90 A discharges.
4.2.3. Heat Generation
Figure 12. Total heat generation during (a) 1It(b) 3It(c) 5Itdischarge current rates.
Figure13illustrates the difference in the reactive heat of the cells with a non-zero initial DoD and the reference cells during their discharges.
The reactive heat originates from the heat generation due to the charge transfer involved in the electrochemical reactions at the electrode-electrolyte interfaces. This reactive heat is reversible and is proportional to the changes in the entropy coefficients of the electrodes occurring during the discharge of the cells. If positive, because of the exothermic character of the electrochemical reactions, the reactive heat behaves as a heat source. Similarly, when negative because of the endothermic character of the electrochemical reactions, the reactive heat behaves as a heat sink. In Figure13, according to the entropy changes of the electrodes, the reactive heat evolves from the heat sink at the beginning to the heat source at the end of the discharges.
At the beginning of the discharges, negative differences are observed for the reactive heat of the cells with a non-zero initial DoD. These cells present a greater negative reactive heat compared to the reference cells because of the greater entropy coefficient reached for their cathode. In the middle of the discharges, no significant differences are observed, since the cells present the same constant reactive heat because of the almost constant entropy coefficient of the cathode. At the end of the discharges, positive differences are noticed in the reactive heat of the cells with a non-zero initial DoD. These cells show a higher reactive heat because of the higher increase in the entropy coefficients of their anode and their cathode near the end of the discharge. Due to the change in the entropy coefficient of the anode, a peak is observed in the reactive heat of Cell 4 near the end of the discharge. This peak corresponds to the one found in the total heat generation of this cell in Figure12. In Figure13, because of the proportionality of the reactive heat to the exchange current density involved in the electrode reactions, the differences observed between the reactive heat of the cells in the module are amplified with the increase in the current rate. In Figure11, the reasons for the lower increase of the temperature for the non-zero DoD cells at the beginning and the higher increases at the end of the discharges are respectively due to the more negative and the more positive characters of the reactive heat.
Figure 14. Active heat generation differences.
Figure 15. Ohmic heat generation differences.
5. Conclusions
In this paper, the thermal behaviour of an unbalanced battery module made of large-size and high-power lithium iron phosphate cylindrical cells is investigated based on its two-dimensional modelling. In the module, several cells are assigned to 5% up to 20% initial DoD. Initially, the module is at 25 ◦C and is cooled by a0.059 kg/m2
·s air flux. The investigation of the thermal behaviour of the module is achieved during the discharge of the cells with 18 A, 54 A and 90 A constant currents. From the results, an increase in the internal temperatures of the cells due to the higher total heat generation inside the cells occurs with the increase in the initial DoD and the discharge rate. At the end of the discharges, the highest temperatures are reached for the cells with the highest initial DoD. The major contributors to the total heat inside the cells were found to be the reactive and the active heats. This study demonstrates the effects of the initial DoD of the cells on the temperature distribution, the temperature increase and the heat generation occurring inside an unbalanced battery module made of cylindrical cells.
Acknowledgments
We acknowledge “Flanders make” for the support to our team.
Author Contributions
in the manuscript. Noshin Omar and Joeri Van Mierlo contributed to the guidance and the supervision of the research. All authors have read and approved the final manuscript.
Conflicts of Interest
The authors declare no conflict of interest.
List of Symbols (Variables and Parameters)
Symbols
as Active surface area (1/m)
c lithium ions concentration (mol/m3 ) cp Heat capacity (J/kg·K)
d Diameter at the start of the spiral or internal diameter of the cell (m) D Diffusion coefficient (m2
/s)
D Diameter taken at the end of the spiral or cell diameter (m) Ea Activation energy (J/mol)
F Faraday constant, 96,485 C/mol
h Convection heat transfer coefficient W/m2
·K
i0 Exchange current density of an electrode reaction (A/m2)
jLi Transfer current due to the intercalation or deintercalation of lithium ions (A/m3 ) k Electrochemical reaction rate constant (m/s)
k Thermal conductivity (W/m·K)
L Total length of the spiral constituting the internal structure of the cell (m) L Length of the cells in the vertical direction (i.e., height) (m)
N Total number of layers in the jelly roll structure of the cell (/) N Total number of cells in the battery module (NT·NL) (/)
NL Number of cells in the longitudinal direction of the battery module (/) NT Number of cells in the transverse direction of the battery module (/) Q Heat generation (W/m3)
r Radius of the spherical particle (m) R Universal gas constant, 8314 J/mol·K
ST Transverse distance between two consecutive cells on the same row (m)
t Time (s)
t+
Transference number of lithium ions (/)
T Temperature (◦C)
U Open circuit voltage (V)
v Fluid velocity at the entrance of the module (m/s) V Volume of layer (m3)
Greek letters
α Charge transfer coefficient (/)
ϵ Volume fraction (/)
η Overpotential (V)
κ Ionic conductivity (S/m)
ϕ Potential (V)
ρ Density (kg/m3)
σ Electrical conductivity (S/m)
Subscripts
a Anode
c Cathode
e or l Electrolyte phase
eff Effective
f Fluid
i Inlet
max Maximum
measured Measured by experiment model Modeled by simulation
o Outlet
s Solid phase
w Wall
Abbreviations
DoD Depth of discharge
EV Electric vehicle
HEV Hybrid electric vehicle LFP Lithium iron phosphate
MUMPS Multifrontal Massively Parallel Solver
SoC State of charge
References
1. Van den Bossche, P.; Omar, N.; Al Sakka, M.; Samba, A.; Gualous, H.; van Mierlo, J. The Challenge of PHEV Battery Design and the Opportunities of Electrothermal Modeling. In Lithium-Ion Batteries: Advances and Applications; Elsevier: Amsterdam, The Netherlands, 2014; Chapter 11.
3. Omar, N.; Daowd, M.; van den Bossche, P.; Hegazy, O.; Smekens, J.; Coosemans, T.; van Mierlo, J. Rechargeable Energy Storage Systems for Plug-in Hybrid Electric Vehicles-Assessment of Electrical Characteristics. Energies2012,5, 2952–2988.
4. Mulder, G.; Omar, N.; Pauwels, S.; Meeus, M.; Leemans, F.; Verbrugge, B.; de Nijs, W.; van den Bossche, P.; Six, D.; van Mierlo, J. Comparison of commercial battery cells in relation to material properties. Electrochim. Acta2013,87, 473–488.
5. Van Mierlo, J.; van den Bossche, P.; Maggetto, G. Models of energy sources for EV and HEV: Fuel cells, batteries, ultracapacitors, flywheels and engine-generators. J. Power Sources2004,128, 76–89.
6. Lu, L.; Han, X.; Li, J.; Hua, J.; Ouyang, M. A review on the key issues for lithium-ion battery management in electric vehicles. J. Power Sources2013,226, 272–288.
7. Pesaran, A.A. Battery thermal models for hybrid vehicle simulations. J. Power Sources 2002, 110, 377–382.
8. Sabbah, R.; Kizilel, R.; Selman, J.R. Active (air-cooled) vs. passive (phase change material) thermal management of high power lithium-ion packs: Limitation of temperature rise and uniformity of temperature distribution. J. Power Sources2008,182, 630–638.
9. Fathabadi, H. High thermal performance lithium-ion battery module including hybrid active-passive thermal management system for using in hybrid/electric vehicles. Energy 2014, 70, 529–538.
10. Warner, J. Lithium-Ion Battery Packs for EVs. In Lithium-Ion Batteries: Advances and Applications; Elsevier: Amsterdam, The Netherlands, 2014; Chapter 7.
11. Goli, P.; Legedza, S.; Dhar, A.; Salgado, R.; Renteria, J.; Balandin, A. Graphene-enhanced hybrid phase change materials for thermal management of Li-ion batteries. J. Power Sources 2014, 248, 37–43.
12. Renteria, J.; Nika, D.; Balandin, A. Graphene Thermal Properties: Applications in Thermal Management and Energy Storage . J. Appl. Sci.2014,4, 525–547.
13. Koo, B.; Goli, P.; Sumant, A.; dos Santos Claro, P.; Rajh, T.; Johnson, C.; Balandin, A.; Shevchenko, E. Toward Lithium Ion Batteries with Enhanced Thermal Conductivity. ACS Nano 2014,8, 7202–7207.
14. Evanoff, K.; Khan, J.; Balandin, A.; Magasinski, A.; Ready, W.; Fuller, T.; Yushin, G. Towards Ultrathick Battery Electrodes: Aligned Carbon Nanotube-Enabled Architecture. Adv. Mater.2012, 24, 533 –537.
15. Ma, Y.; Teng, H.; Thelliez, M. Electro-Thermal Modeling of a Lithium-ion Battery System. SAE Int. J. Engines2010,3, 306–317.
16. Wang, T.; Tseng, K.; Zhao, J.; Wei, Z. Thermal investigation of lithium-ion battery module with different cell arrangement structures and forced air-cooling strategies. Appl. Energy 2014, 134, 229–238.
17. He, F.; Li, X.; Ma, L. Combined experimental and numerical study of thermal management of battery module consisting of multiple Li-ion cells. Int. J. Heat Mass Transf. 2014,72, 622–629. 18. Li, X.; He, F.; Ma, L. Thermal Management of cylindrical batteries investigated using wind tunnel
19. Xing, Y.; Ma, E.; Tsui, K.; Pecht, M. Battery Management Systems in Electric and Hybrid Vehicles. Energies2011,4, 1840–1857.
20. Capron, O.; Samba, A.; Omar, N.; Gualous, H.; van den Bossche, P.; van Mierlo, J. Battery Thermal Modelling—Assessment of heat distribution and optimization of battery design concept. In Proceedings of the 2013 International Conference on Renewable Energy Research and Applications (ICRERA), Madrid, Spain, 20–23 October 2013; pp. 304–309.
21. Doyle, M.; Fuller, T.; Newman, J. Modeling of Galvanostatic Charge and Discharge of the Lithium/Polymer/Insertion Cell. J. Electrochem. Soc. 1993,140, 1526–1533.
22. Fuller, T.; Doyle, M.; Newman, J. Simulation and Optimization of the Dual Lithium Ion Insertion Cell. J. Electrochem. Soc. 1994,141, 1–10.
23. Saw, L.; Ye, Y.; Tay, A.A.O. Electrochemical-thermal analysis of 18650 Lithium Iron Phosphate cell. Energy Convers. Manag. 2013,75, 162–174.
24. Prada, E.; Di Domenico, D.; Creff, Y.; Bernard, J.; Sauvant-Moynot, V.; Huet, F. Simplified Electrochemical and Thermal model of LiFePO4, Graphite Li-Ion Batteries for fast charge applications. J. Electrochem. Soc. 2012,159, A1508–A1519.
25. Jiang, F.; Peng, P.; Sun, Y. Thermal analyses of LiFePO4/graphite battery discharge processes. J. Power Sources2013,243, 181–194.
26. Inui, Y.; Kobayashi, Y.; Watanabe, Y.; Watase, Y.; Kitamura, Y. Simulation of temperature distribution in cylindrical and prismatic lithium ion secondary batteries. Energy Convers. Manag. 2007. 48, 2103–2109.
27. Somasundaram, K.; Birgersson, E.; Mujumdar, A. Thermal-electrochemical model for passive thermal management of a spiral-wound lithium-ion battery. Power Sources2012,203, 84–96. 28. Ye, Y.; Shi, Y.; Tay, A.A.O. Electro-thermal cycle life model for lithium iron phosphate battery.
J. Power Sources2012,217, 509–518.
29. Somasundaram, K. Mathematical Modeling of Transport Phenomena in Electrochemical Energy Storage Systems. Ph.D. Thesis, Department of Mechanical Engineering, National University of Singapore, Singapore, 2012.
30. PEC. Available online: http://www.peccorp.com/SBT0550-tabs-glance.html (accessed on 2 February 2015).
31. Samba, A.; Louahlia-Gualous, H.; le Masson, S.; Nörterhäuser, D. Two-phase thermosyphon loop for cooling outdoor telecommunication equipments. Appl. Therm. Eng.2013,50, 1351–1360. 32. Zukauskas, A. Heat transfer from tubes in crossflow. Adv. Heat Transf.1972,8, 93–160.
33. Martinez, C.; Sorlien, D.; Goodrich, R.; Chandler, L.; Magnuson, D. Using Cell Balancing to Maximize the Capacity of Multi-cell Li-Ion Battery Modules. Available online: http://www.intersil.com/content/dam/Intersil/documents/an16/an167.pdf (accessed on 25 June 2015).
c