DP RIETI Discussion Paper Series 03-E-002
Price Level Dynamics in a Liquidity Trap
WATANABE Tsutomu
RIETI
IWAMURA Mitsuru
Waseda University
The Research Institute of Economy, Trade and Industry
http://www.rieti.go.jp/en/
RIETI Discussion Paper Series 03-E-002
Price Level Dynamics in a Liquidity Trap
Mitsuru Iwamura and Tsutomu Watanabe
December 2002
Abstract
This paper studies the dynamic behavior of the general price level when the natural rate of interest declines substantially. Particular attention is paid to two constraints: the non-negativity constraint of nominal interest rates, and the government's intertemporal budget constraint. In a normal situation, nominal bond prices rise in response to the shock, which restores equilibrium. However, if the non-negativity constraint is binding, nominal bond prices cannot rise sufficiently. Equilibrium can then be restored only by a sufficient fall in the current price level. The required fall is greater when the maturity of government debt is shorter. To avoid deflation, the government must coordinate with the central bank by committing itself to reducing the current and future primary surplus.
P r ice L evel D y nam ics in a L iqui dit y Tr ap
not
not
any
not
, , ,
,
t
not
© ª £ ¤
and
real
,
NB NB NB NB NB NB
NB NB
NB NB NB NB NB
NB
0.000 0.002 0.004 0.006 0.008 0.010
-10 0 10 20 30 40 50 60 70 80 90 100
0.000 0.002 0.004 0.006 0.008 0.010 0.012
-10 0 10 20 30 40 50 60 70 80 90 100
Optimal path Taylor rule
-0.060 -0.050 -0.040 -0.030 -0.020 -0.010 0.000 0.010
-10 0 10 20 30 40 50 60 70 80 90 100
Optimal path Taylor rule
Figure 1
Optimal responses when the natural rate of interest stays above zero
ˆ 1
ˆ − −
j
j P
P 1
ˆ , + j
Qj 1
ˆ , + j
Dj
0.000 0.002 0.004 0.006 0.008 0.010 0.012 0.014 0.016
-10 0 10 20 30 40 50 60 70 80 90 100
0.000 0.002 0.004 0.006 0.008 0.010 0.012
-10 0 10 20 30 40 50 60 70 80 90 100
Optimal path Taylor rule
-0.110 -0.090 -0.070 -0.050 -0.030 -0.010 0.010
-10 0 10 20 30 40 50 60 70 80 90 100
Optimal path Taylor rule
Figure 2
Optimal responses when the natural rate of interest falls below zero
ˆ 1
ˆ − −
j
j P
P 1
ˆ , + j
Qj 1
ˆ , + j
Dj
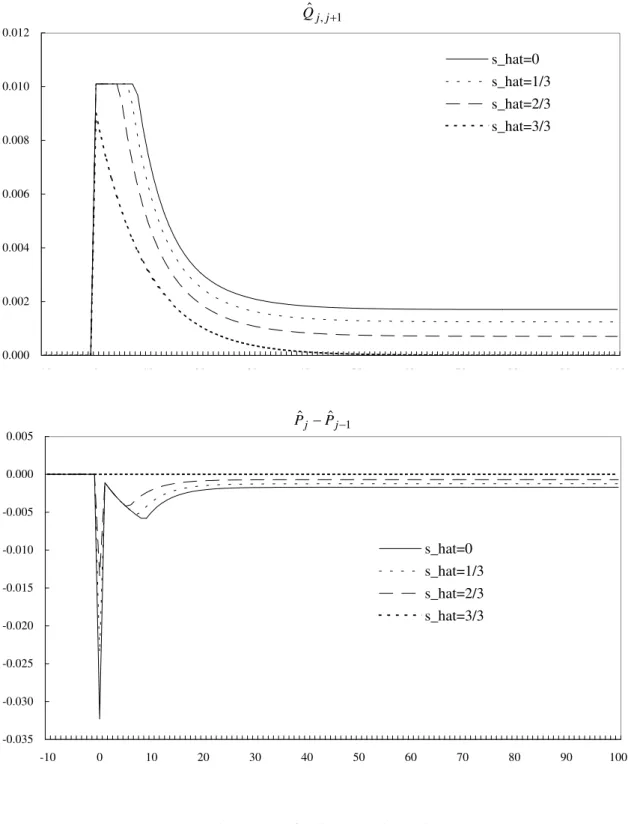
0.000 0.002 0.004 0.006 0.008 0.010 0.012
-10 0 10 20 30 40 50 60 70 80 90 100
s_hat=0 s_hat=1/3 s_hat=2/3 s_hat=3/3
Figure 3 Optimal policy mix
-0.035 -0.030 -0.025 -0.020 -0.015 -0.010 -0.005 0.000 0.005
-10 0 10 20 30 40 50 60 70 80 90 100
s_hat=0 s_hat=1/3 s_hat=2/3 s_hat=3/3 ˆ 1
ˆj −Pj−
P 1
ˆ , + j
Qj
