Diagnosing At-Speed Scan BIST Circuits Using a Low Speed and Low Memory Tester
Yoshiyuki Nakamura
1,2, Thomas Clouqueur
1, Kewal K. Saluja
3and Hideo Fujiwara
11
Graduate School of Information Science, Nara Institute of Science and Technology
Kansai Science City, 630-0192, Japan
2
NEC Electronics Corporation, Kawasaki, 211-8668, Japan
3
Department of Electrical Engineering, University of Wisconsin-Madison, WI 53706-1691, USA
E-mail: [email protected], [email protected], [email protected]
Abstract
Numerous solutions have been proposed to reduce test data volume and test application time during manufactur- ing testing of digital devices. However, time to market challenge also requires a very efficient debug phase. Er- ror identification in the test responses can become impracti- cally slow in the debug phase due to large debug data, slow tester speed and limited memory of the tester. In this pa- per, we investigate how a relatively slow and limited mem- ory tester can observe the at-speed behavior of fast circuits. Our method can identify all errors in at-speed scan BIST environment without any aliasing and negligible extra hard- ware while taking into account the relatively slower speed of the tester and the re-load time of the expected data to the tester memory due to limited tester memory. Experimental results show that the test application time by our method can be reduced by a factor of 10 with very little hardware overhead to achieve such advantage.
1. Introduction
Built-in self-test (BIST) has become one of the major test techniques for today’s large scale and high speed de- signs. Since BIST compacts test responses, BIST requires only small tester memory and it can perform at-speed test even if the tester frequency is substantially lower than the frequency of the circuit during test.
On the other hand, BIST causes problems in diagnosis due to its compacted responses. Indeed, pass/fail informa- tion obtained from a BIST response analyzer is insufficient for diagnosis. Two kinds of information are required to identify a fault in a circuit under test (CUT), namely the time information, and the space information. High reso- lution diagnostic for a given fault model can be achieved by diagnosis techniques combining space information with time information [4, 5]. A number of methods to identify space information have been proposed, especially for scan-
based BIST architecture [6-11], however, only a few prac- tical techniques have been developed to identify time infor- mation.
Some of the existing techniques are based on signature analysis using cycling register [11,12] and error correcting codes [13]. These methods compact the complete test re- sponse into one signature and attempt to identify errors from the signature. Since they observe signature only once, they are usable even if the circuit frequency is much higher than the tester frequency. However, for large number of error bits, sayr errors, they need as many as r-LFSRs or signa- ture registers and may have over 40% diagnostic aliasing if the actual number of errors is higher thanr [13]. Thus, they either have poor diagnostic resolution or require impracti- cally high hardware overhead to achieve maximum diagnos- tic resolution. An alternative approach trades off overhead for time by repeating the test sequence and compacting it at each iteration into a different signature [14]. Thus, in- stead of using r°LFSRs, the test sequence is repeated r times using programmable LFSR to identifyr errors. Since it is mathematically equivalent to [13], diagnostic aliasing is same as usingr-LFSRs. Thus, identifying all the errors requires repeating the test sequence an impractically large number of times. Techniques that use two phases for di- agnosis have also been proposed [15-17]. During the first phase, intermediate signature is checked a few times during test in order to narrow down the failing candidates within some windows of fixed or variable size. The failing patterns are then identified inside the windows by applying the cor- responding patterns one at a time [15]. These methods use small hardware overhead and/or reduce test application time but they assume the existence of a mechanism to observe the at-speed behavior inside of failing windows. Enhance- ment of these methods has also been studied using multiple signature analyzers [17], but they do not achieve maximum diagnostic resolution. A commonly used diagnosis tech- nique requires and collects the failing space and time infor- mation, without compacting responses, during the diagno- sis phase [18] but suffers from the following two problems. 15th IEEE Asian Test Symposium (ATS'06), pp. 409-414, November 2006.
One, it requires the circuit to operate at the tester frequency during test; therefore, the faults that affect only at-speed operation may not be diagnosable. Two, this method re- quires all expected responses of scan cells to be loaded into tester. Even the high-end testers often do not have sufficient memory to store all expected scan cell data of all BIST se- quences. Therefore, expected data in such a scheme must be re-loaded many times to the tester memory. Clearly, this can be very time consuming. The method proposed in [19] solves the first problem, but the second problem remains.
In this paper, we investigate methods to identify every error occurrence in at-speed scan based BIST environment. Every error can be identified even if the circuit test fre- quency is higher than the tester frequency. In Section 2 we briefly introduce a procedure to identify every error without any aliasing in at-speed scan BIST environment proposed in [19]. In Section 3, we formulate the problem of identify- ing every error occurrence in minimum test time, including tester loading time, and propose a method to reduce test ap- plication time by pattern grouping and using signature ana- lyzers. In Section 4, we analyze the test time of the method proposed in Section 3 to find the optimal group size. In Sec- tion 5 we show the effectiveness of our method through ex- perimental results and discuss the relationship between the error probability and optimal group size. Section 6 summa- rizes the conclusions of our analysis.
2. Observing Responses by a Slow Speed Tester
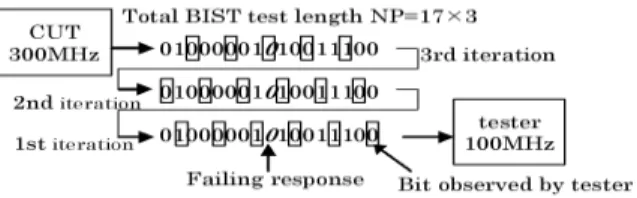
Before providing a formulation of the problem we de- scribe the method given in [19] that can identify all failing responses by observing scan outputs even if the CUT test frequency is faster than the maximum tester frequency (in sequel, we will call the maximum test frequency tester fre- quency limitation). Fig. 1 demonstrate this through an ex- ample. When the CUT clock period is 2ns and the tester observing period is 6ns, a tester can observe only 1/3 of the responses. Thus, it will not be able to identify all possi- ble failing responses in one BIST sequence. Nevertheless, there is a way to observe all responses without adding any extra hardware. We assume that the pattern generator (PG) is reset to the initial state after generating the last pattern. If the BIST sequence is 17 cycles long, as shown in Fig.1, ev- ery cycle can be observed by repeating the BIST sequence three times (i.e., applying 51 clocks). During the first se- quence, the tester observes response bit 0, 3,.., 15. Then bits 1, 4,. . . , 16 are observed during the second sequence and bits 2, 5,. . . , 14 during the third sequence. Note that such a method may not always allow observing all bits by simple repetition of the sequence. For example if the length of the BIST sequence is 18, the tester cannot observe every response by simply repeating the sequence since only bits 0,3,. . . ,15 are observed repeatedly. LetN be the length of the BIST sequence,fc be the clock frequency of the CUT,
Figure 1. Multiple iteration observation and ft be the tester frequency limitation, then the condi- tions to observe all responses is gcd(N, P ) = 1, where P = fc/ft. The tester can observe all responses by ap- plying the BIST test sequenceP times, while observing its response at every time periodP . If N is not co-prime to P , both N or P can be adjusted to make it co-prime. It is shown in [19] that increasing only the length of BIST se- quenceN by inserting no more than P additional dummy clock cycles achieves minimum test application time in gen- eral.
We can identify all erroneous responses with a slow speed tester using this method, albeit requiring all expected responses of scan cells to be loaded into the tester. Usual testers do not have enough memory to store all expected scan cell data of all BIST sequences. Therefore, we have to re-load expected data many times to the tester which can be quite time consuming.
3. Using Signature Analyzers
3.1. Problem Formulation
In this section, we formulate the problem of identifying failing responses in minimum testing time. We first iden- tify some characteristics of the diagnosis process and pro- duction testing process. Diagnosis can be performed for devices that didn’t pass the production test or devices that passed the production test and were found to be faulty in the field. In each case, testing during diagnosis should be per- formed at the speed that resulted in the failure of the device. Another characteristic is that the test application time is not the first priority for diagnosis. Rather, the quality of diag- nosis is far more important than the test application time. However, the fault diagnosis must not be overloaded by the error information to achieve the required diagnostic resolu- tion. It is imperative that the reported (required) number of errors be limited to achieve the targeted diagnosis resolu- tion. Our formulation concerns the error identification of a scan based BIST circuit. We constrain BIST to operate at- speed during diagnosis. In the at-speed BIST environment, we assume that the CUT operates at frequencyfc, whereas the tester has a frequency limitation and cannot operate at a frequency higher than ft, such thatft < fc. We also constrain the number of errors to be identified to E, and no error-free response should not be identified as erroneous. The objective of the problem is to minimize the testing time.
Test data of first phase
Test data of second phase
Figure 2. Test data for error identification Note that the tester loading time should be included in test time as mentioned in Section 2.
3.2. Signature Analyzers for Error Identifi- cation
The method introduced in Section 2 does not use signa- ture analyzers. Therefore, it can achieve maximum diagnos- tic resolution without aliasing; however, the test time, in- cluding tester loading time significantly increases when the test sequence becomes very long. On the other hand, the er- ror identification methods using signature analyzer require less tester memory, i.e., fewer re-loadings, therefore, test- ing time will be much shorter than the method introduced in Section 2. Note that the method using signature analyzer causes diagnostic aliasing and it is undesirable when an er- roneous response is miss-identified as error-free since it can lead to misdiagnosis. Also, as argued in the previous sub- section, it is important that the fault diagnosis algorithm is not overwhelmed by excessive error information Therefore; it will be acceptable to base a diagnostic decision when suf- ficiently many erroneous responses for diagnosis are identi- fied.
In this paper, we propose an error identification proce- dure that uses signature analyzers in two phases. During the first phase, the intermediate signature is checked in order to narrow down the error candidates within some windows [15-17]. The failing responses are then identified inside the windows during the second phase using the method intro- duced in Section 2 for at-speed BIST environment. This study aims at minimizing the test time, in particular by de- termining the optimal window size for use in phase one.
To enable two phase error identification, all the BIST se- quences are divided into groups. Each pattern group in- cludes the seed for the pattern generator that consists of the state of the pattern generator at the end of the previ-
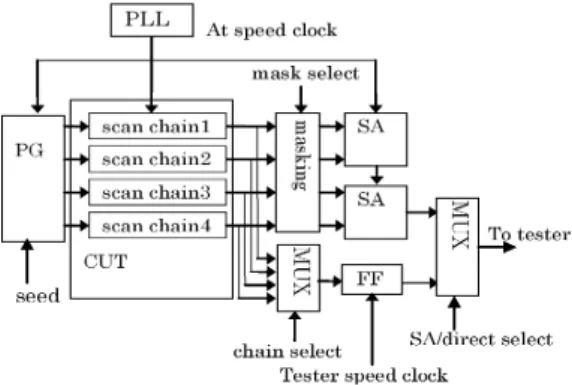
Figure 3. BIST architecture
ous group. Each pattern group also includes the expected signature for the group.
The first phase identifies erroneous groups. The seeds of the first group and all expected signatures are loaded onto the tester as shown in Fig.2. The test pattern is then gener- ated by the pattern generator and the scan out responses are compacted into signature analyzers. The erroneous pattern groups are identified by observing the result of the signature analyzers. The group size should be large enough to reduce the test data in first phase. The second phase identifies erro- neous responses in the erroneous pattern groups. The seeds and the expected responses of the erroneous pattern group, which is identified in first phase, are loaded onto the tester. By using error identification procedure proposed in Section 2 for all erroneous groups, all errors can be identified. Note that the test data size for error identification is much smaller than the prior approach explained in Section2 since only test data of erroneous groups is loaded onto tester.
Some erroneous responses may be dropped due to alias- ing of signature analyzers in the first phase; however, any error-free response cannot be identified as erroneous, thus satisfying the constraints of the problem formulation.
In the first phase, larger groups result into a larger re- duction in test data and this reduces test time including tester loading time. Whereas, in the second phase, larger groups result into a smaller reduction in test data since larger groups increase the error probability of a pattern group. Therefore, there is an optimal group size for min- imum test time. Later in this paper, we deduce the optimal group size for two phase error identification.
3.3. A BIST Architecture
Fig.3 shows a BIST architecture with the logic required for diagnosis. MISRs are used as signature analyzers during testing, and during diagnosis, a masking circuit allows only one scan chain to feed a signature analyzer which is selected by input “mask select”.
As shown in Fig.3, scan outs are connected to an out- put port via a multiplexer during diagnosis as in the non-
compaction based approach [19]. A Register, FF, is inserted at the multiplexer output to synchronize the scan chain with the tester since the CUT test frequency may be higher than the tester frequency. The FF samples the signal produced by the scan chain and holds the value during one tester period. In the first phase of identification procedure, each signa- ture analyzer compacts responses of one scan chain which is selected by masking circuit. If there arenSA signature analyzers,nSApattern groups in different scan chains can be simultaneously tested.
On the other hand, in the second phase, only one group in one scan chain, selected by multiplexer, can be tested since we don’t use signature analyzers in the second phase. 3.4. Procedure of Error Identification
Summarizing Section 3.1-3.3, the procedure for identi- fying error occurrence is as follows.
Given condition
Test frequency of CUT :fc
Tester frequency limitation:ft
Number of signature analyzers:nSA
BIST test length:N
Number of pattern groups:g
Number of scan cells in a scan chain:L Target number of errors identified:E Step 1. identify erroneous pattern groups
Step 1.1. Select untested pattern groups for each signa- ture analyzers.
Step 1.2. Apply BIST sequence and identify erroneous signature analyzers, i.e, erroneous pattern groups.
Step 1.3. Repeat step 1.1-1.2 until all pattern groups are tested. Total number of BIST iterations is:g/nSA
Step 2. Identify erroneous scan cell and pattern
Step 2-1. Select an erroneous group which is identified in Step1. The size of pattern group isw = N/g.
Step 2-2. Set observing time period P as P = fc/ft. Adjust the BIST test length by adding minimumα dummy clocks (i.e.,w0 = w + α) such that w0andP are co-prime. Reset the BIST iteration counterr = 0 and tester observa- tion counteri = 0.
Step 2-3. ApplyP w0 clocks to BIST pattern generator, observing one scan output everyP test cycles.
Step 2-4. If an error is detected at the (i + 1)thobserva- tion, then:
Relative time of error occurrencee is: e = iP mod w0 Failing scan pattern =be/(L + 1)c
Erroneous scan cell =e mod (L+1)
Step 2-5. Repeat Step2.1-2.4 untilE errors identified.
4. Optimizing Group Size
4.1. Tester Loading Rate
Test data is prepared for each faulty chip in the fault di- agnosis phase. Therefore, tester loading time can not be
ignored especially in view of the fact that the tester may not have sufficient memory for all test data. In this case, the tester should load the test data several times.
The tester loading time will normally be proportional to the test data volume and the overhead associates with each tester loading. Thus the tester loading timeTLoad can be expressed using two constantsLCandLV as
TLoad= LC· (#of tester loads) + LV · V (1) whereV is the test volume. Let M be the tester memory size, then the number of tester loading isV /M . Therefore:
Tload= V µ LC M + LV
∂
(2) Note thatLC,LV,M are parameters associated only with the tester. Denote rLoad = M/ (LC+ M LV), the tester loading time is:
Tload = V rLoad
(3) In this paper, we userloadas the bit rate of tester loading. Note that the parameterrloadreflects tester memory limita- tion also.
4.2. Analysis of Test Time
In this section, we estimate the test time for the error identification procedure.
We use following notation in the analysis below. N : total length of the BIST sequence
w: Size of the expected response of one group g: number of groups of all scan chains(g = N/w) SSA: bit size of signature
SP G: bit size of pattern generator nSA: number of signature analyzers rLoad: bit rate for loading to the tester fc: CUT test frequency
ft: tester frequency
ge: number of groups identified erroneous in Step1 Analysis of Step1 The error identification procedure Step1 identifies erroneous pattern groups.
The total test time including tester loading time is Total test time= test application time + tester loading time
The test application time of Step1 can be estimated as follows. In Step1 we testnSA groups simultaneously us- ing nSA signature analyzers. Therefore the BIST pattern should be applied ing/nSAtimes. At the end of the BIST session, we read out the signature. We assume that we read out signatures on one output port as shown in Fig.3.
Therefore, the test application time of Step1 is T ATStep1= g
µ w
nSAfc
+SSA ft
∂ +SP G
ft
(4)
The total test volume for Step1 is
VStep1= gSSA+ SP G (5) Therefore total test time including loading time is:
Tstep1= T ATStep1+ VStep1/rLoad (6) Analysis of Step2 We identify erroneous responses in the error identification procedure Step2. The error identifica- tion procedure will be finished when we identify predeter- minedE errors. And since only erroneous groups are tested in Step2, the expected number of erroneous bit in one group is
Ew= w Pr{1 bit error} Pr{1 group error}=
w Pr{1 bit error} 1°(1°Pr{1 bit error})w
(7) Therefore, the expected number of groups containsE errors is:
ge0 = E Ew
= E (1 ° (1 ° Pr{1 bit error})w) w Pr{1 bit error} (8) We must apply BIST sequencefc/ft times for erroneous groups. Therefore the test application time of Step2 is:
T ATstep2=fcge0 ft
µ w fc
+SP G ft
∂
=ge0 ft
µ
w+fcSP G ft
∂ (9) The test volume is
VStep2= g0e(w + SP G) (10) Total test time including loading time is:
Tstep2= T ATStep2+ VStep2/rLoad (11) In this section, we analyze the total test time including tester loading time for Step1 and Step2. We can find the optimal grouping sizew (1 ∑ w ∑ N ), which minimizes
TStep1+ TStep2 (12)
by using common solver tools. However, there is a un- known parameter Pr{1bit error} in Eq.(12) which depends on the existence fault in the chip and its manifestation as an error. In the next section, we will do some experiments to show the relationship between error probability and optimal group sizew, and propose a practical group size w.
5. Experimental Results
We have shown that the test time of error identification depends on the error probability. In Fig.4, we show the dis- tribution of the error probability for a large industrial circuit which is obtained by simulating randomly selected 100 sin- gle stuck-at faults. The experimental circuit is a part of a
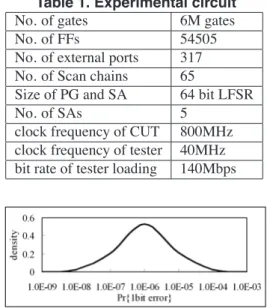
Table 1. Experimental circuit
No. of gates 6M gates
No. of FFs 54505
No. of external ports 317 No. of Scan chains 65
Size of PG and SA 64 bit LFSR
No. of SAs 5
clock frequency of CUT 800MHz clock frequency of tester 40MHz bit rate of tester loading 140Mbps
Figure 4. The distribution of error probability SoC developed at NEC Electronics co. and details of the circuit are provided in Table 1.
As shown in Fig.4, the error probability is almost in the range of10°8 < Pr{1 bit error} < 10°4 , and typically near10°6.
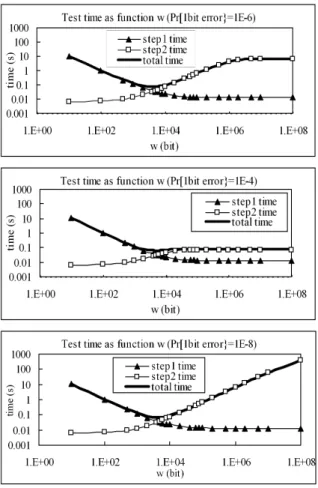
We plot the total testing time including tester loading time using equations deduced in Section 4. The parame- ters reflect the experimental circuit shown in Table 1. Fig.5 shows the Step1, Step2 and total testing time as a function of group sizew, to identify 200 errors which is enough error information for diagnosing scan based design [3-5]. Fig.5 shows that there is an optimal point of group size to min- imize total testing time. In typical and low error probabil- ity cases, 5860bit is the optimal grouping size. The opti- mal grouping size for high error probability case may be as large as possible, i.e., no-grouping is needed. However, Fig.5 shows that when the group size is larger than 5000, which is around optimal solution for typical case, testing time is almost constant. Therefore, the solution of the opti- mal group size under typical error probability is also practi- cally suitable for higher error probability case.
Therefore, we conclude that the optimal grouping size which minimizes testing time can be obtained by solving Eq.(12) under the assumption of Pr{1bit error} to be fairly low.
6. Conclusions
In this paper, we proposed a method for identifying er- roneous responses for the BIST architecture in minimum testing time. Our approach is efficient even if the CUT test clock frequency is much higher than the tester frequency.
Figure 5. Test time as a function of group size (at typical,high and low error probability)
Our approach requires only multiplexer and masking circuit for diagnosis which is quite negligible hardware overhead.
We also proposed how to decide the size of pattern group to minimize testing time. We also take into account for tester loading time. The proposed equations to decide the optimal group size includes the error probability, however, the experimental results show that the group size which ob- tained under assumption of enough low error probability is also optimal for higher error probability cases. Experimen- tal results also show that the test time by our method can be reduced by a factor of 10. Therefore, we can identify enough number of errors for diagnosis with minimum test application time with very little hardware overhead by using our proposed method.
Acknowledgments This work was supported in part by JSPS (Japan Society for the Promotion of Science) under Grants-in-Aid for Scientific Research B (No.15300018) and in part by 21st Century COE (Center of Excellence) Pro- gram (Ubiquitous Networked Media Computing).
References
[1] P.H.Bardell, W.H.McAnney and J.Savir, “Built-in Test for VLSI: pseudorandom techniques,” Wiley Interscience, 1987.
[2] H.Y.Chen, E.Manning and G.Mets, “Fault diagnosis of dig- ital systems,” John Willy & Sons Inc., 1970.
[3] J.A.Waicukauski and E.Lindbloom, “Failure diagnosis of structured VLSI,” IEEE Design & Test, pp.49-60, 1989. [4] M.Abramovici and M.A.Breuer, “Multiple fault diagnosis in
combinational circuits based on effect-cause analysis,” IEEE Trans. on comput., Vol.C-29, pp.451-460, 1980.
[5] K.Shigeta and T.Ishiyama, “An improved fault diagnosis al- gorithm based on path tracing with dynamic circuit extrac- tion,” Proc. ITC., pp.235-244, 2000.
[6] J.Rajski and J.Tyszer, “Fault diagnosis in scan-based BIST,” Proc. ITC, pp.894-902, 1997.
[7] I.Bayraktaroglu, A.Orailoglu, “Improved fault diagnosis in scan-based BIST via superposition,” Proc. DAC, pp.55-58, 2000.
[8] I.Bayraktaroglu, A.Orailoglu, “Deterministic partitioning techniques for fault diagnosis in scan-based BIST,” Proc. ITC, pp.273-282, 2000.
[9] J. Ghosh-Dastidar and N.A.Touba, “A rapid and scalable di- agnosis scheme for BIST environments with a large number of scan chains,” Proc. VTS, pp.73-78, 2000.
[10] C.Liu and K.Chakrabarty, “A partition-based approach for identifying failing scan cells in scan-BIST with application to system-on-chip fault diagnosis,” Proc. DATE, pp.230- 235,2003.
[11] J.Ghosh-Dastidar, D.Das, A.Touba, “Fault Diagnosis in scan-based BIST using both time and space information,” Proc. ITC, pp. 95-102, 1999.
[12] J.Savir and W.H.McAnney, “Identification of failing tests with cycling registers,” Proc. ITC, pp.322-328, 1988, . [13] T.R.Damarla, C.E.Stroud and A.Sathaye, “Multiple er-
ror detection and identification via signature analysis,” J.Electron. Testing: Theory and Applicat., vol.7, pp.193- 207,1995.
[14] Y.Wu and S.Adham ,”BIST fault diagnosis in scan-based VLSI environments,” Proc. ITC., pp.48-57, 1996.
[15] J.Savir, “Salvaging test windows in BIST diagnostics,” Proc. VTS, pp.416-425, 1997.
[16] T.Clouqueur, O.Ercevik, K.K.Saluja and H.Takahashi, “Effi- cient signature-based fault diagnosis using variable size win- dows,” Proc. VLSI Design, pp.391-396, 2001.
[17] C.Liu and K.Chakrabarty, “Failing vector identification based on overlapping intervals of test vectors in a scan-BIST environment,” IEEE Trans. on CAD, vol 22, pp.593-604, 2003.
[18] P.Wohl, J.A.Waicukauski, S.Patel and G.Maston, “Effec- tive diagnostics through interval unloads in a BIST environ- ment,” Proc. 39th DAC, pp.10-14, 2002.
[19] Y.Nakamura, T.Clouqueur, K.K.Saluja and H.Fujiwara, “Er- ror identification in at-speed scan BIST environment in the presence of circuit and tester speed mismatch,” IEICE Trans. on Inf. and Syst., Vol.E89-D,No.3, pp.1165-1172,2006.