sustainability
ISSN 2071-1050www.mdpi.com/journal/sustainability
Article
Sustainability Assessment in Wine-Grape Growing in the New
World: Economic, Environmental, and Social Indicators for
Agricultural Businesses
Irina Santiago-Brown 1,2, Andrew Metcalfe 3,†, Cate Jerram 4,† and Cassandra Collins 1,†,*
1 Inkwell Wines and Consulting, P.O. Box 404, McLaren Vale SA 5171, Australia;
E-Mail: [email protected]
2 School of Agriculture, Food and Wine, University of Adelaide, Waite Campus, Private Mail Bag 1,
Glen Osmond SA 5064, Australia
3 School of Mathematical Sciences, University of Adelaide, North Terrace Campus, 6.43 Ingkarni
Wardli, Adelaide SA 5005, Australia; E-Mail: [email protected]
4 Adelaide Business School, University of Adelaide, 09.03 Nexus 10, Adelaide SA 5064, Australia;
E-Mail: [email protected]
† These authors contributed equally to this work.
* Author to whom correspondence should be addressed; E-Mail: [email protected]; Tel.: +61-8-8313-6813; Fax: +61-8-8313-0431.
Academic Editor: Douglas Constance
Received: 21 April 2015 / Accepted: 11 June 2015 / Published: 25 June 2015
qualitative indicators that, in the context of distinct wine regions or crops should be quantified to maintain their relevance and usefulness.
Keywords: indicator; sustainability; agriculture; wine grape; assessment; adapted nominal group technique; rank; evaluation; viticulture; triple bottom line
1. Introduction
Sustainability awareness has been increasing since the World Commission on Environment and Development (WCED) was created by the United Nations in the 1980s [1]. A variety of sustainability assessment methods have been proposed since then [2], including agricultural assessments [3–6]. However, most of these assessments are mainly focused on the components of environmental sustainability [7], and a few on economic sustainability [8], but very few are focused on the evaluation of sustainability (environmental, economic, and social components) for the individual farms [4,6,9,10]. Gray drew attention to this need as early as 1992, when he pointed out that levels of sustainability that range from “planetary, national or community” [8] (p. 418) could be addressed if we “translate these concepts to the level of the individual organisation” [8] (p. 418). This study was developed to support farm management through the evaluation of the sustainability status of agricultural businesses (farms) through a case study of wine-grape growers.
To address the issue of sustainability at the individual farm level, an extensive, multi-phase, multi-stage, three-year project was designed. Project goals were to help agricultural organisations improve their individual sustainability outcomes; contribute to improved communication between farmers and consumers; and facilitate effective governmental funding allocation in agricultural regions. Originally, it was assumed that the project could be built upon existing definitions of sustainability and indicators for the measurement of sustainability, yet these assumptions were found to be unfeasible. There were no common definitions that could be considered universally accepted, nor were there consistent indicators that could evaluate individual organisations systemically or comparably. As depicted by Gray: “what may be required, is a more nuanced understanding of what ‘sustainability’ actually is and how, if at all, it can have any empirical meaning at the level of the organisation” [11] (p. 47).
A fundamental problem underlying all the other sustainability issues is the problematic definition of sustainability—or the indiscriminate “plethora” of sustainability definitions [11] (p. 49)—and the initial aim of the revised project was to determine a single self-explanatory definition that was recognisable to and relevant for all stakeholders in the study [12].
of a set of indicators for assessing sustainability that would be genuinely representative and viable. Indicators needed to be significant and consistent across all variables of vineyard type and circumstance, yet contextually flexible and able to be tailored meaningfully to the circumstances of each individual farm, while maintaining comparability between farms and supporting management decision-making [3,8]. Only once a viable set of representative and effective indicators was selected could the comparison of the sustainability of vineyards commence.
The project was re-designed to be developed in three distinct but complementary stages. Stage 1 was the development of a sustainability definition relevant to wine-grape growers [12], and the findings and definition from Stage 1 are summarised in the following section. This current article works with and from the resultant definition and the research that supports it to describe and discuss Stage 2—the development of a methodology for the establishment of valid, representative indicators for assessment of the sustainability of vineyards. The methodology constructed for developing and using such indicators is the primary contribution of this article and, while targeted to sustainability at the level of the individual organisation for vineyards, can potentially be transferable to other agricultural businesses. In the third stage of this project, sustainability programs for viticulture worldwide were documented and compared, as were their certification processes. This stage also presented an overall characterisation of assessment methods and related them to the documented programs [13].
2. Stage I Summary: Sustainability Definition and Conceptual Framework
To understand the work presented in this article about Stage II of the project, it is necessary to outline primary aspects of the Stage I results, including a definition of sustainability that is relevant to the individual agricultural organisation, and an understanding of the conceptual framework [12].
2.1. Sustainability Definition
All work reported in this article assumes that a sustainable farm is “one that is able to economically provide for the farmer while maintaining its ability to consistently produce and improve quality over time” [12]. This definition is founded on the conceptual framework developed assuming the triple bottom line approach as essential for agricultural sustainability, and is also the foundation for developing bottom-up indicators and indicator groupings from “real-farm” management experiences, as described in the body of this article.
2.2. Conceptual Framework: Triple Bottom Line
It also became clear during Stage I that sustainability indicators alone—even grouped within the constructs of the triple bottom line conceptual framework—were not necessarily inherently meaningful for decision-making [3]. In agriculture, the false dichotomy between value-based indicators (e.g., tonnes per hectare) and technical or science-based indicators (e.g., physical and chemical characteristics of soil) seems to contribute to the difficulty to define a minimum, but sufficient list of indicators to assess farm sustainability. Further work was required to make the indicators useful for farm management at the organisational level. The indicators needed to be weighted and ranked to make possible the creation of a short but essential list of indicators to be assessed.
Therefore, further development of the conceptual framework included an importance ranking of these proposed indicators so that indicators could be purposefully linked to every day decision-making processes for farm management. This link is constructed by addressing and ranking the contribution of each indicator in the sustainability assessment twice: first, weighted and ranked within each component (economic, environmental, or social), and then weighted and ranked across components.
3. Indicators
3.1. Indicators: Viewpoints and Approaches
Once there is a clear definition of sustainability, the choice of indicators then becomes the critical aspect for the development of quality assessments. Just as the project started with a plethora of sustainability definitions that had to be sieved and sorted, similarly, the project was faced with a plethora of possible indicators that needed to be reduced to a significant, appropriate, and representative short list of workable indicators. These could then be assessed for realistic evaluation of sustainability, contributing to farm management. Furthermore, as criteria for indicator choice vary from methodology to methodology, sustainability certification in agriculture can become quite challenging.
By weighting the indicators, through the novel methodology offered here, it is possible to select the most relevant indicators that are suitable for each organisation based on that organisation’s budget constraints, context, objectives, and risk perception.
The process of developing indicators with the empirical mixed methods research approach used in this article can contribute to the development of meaningful key performance indicators (KPIs) to assess sustainability for farm management. Performance measures should support decision-making processes by aligning daily activities with strategic objectives [14,15]. However, over-reliance on a single KPI can be counter-productive. For example, when assessing the sustainability status of a vineyard, using isolated indicators (e.g., “yield”) is unlikely to intelligently support decision-making. For instance, “yield” performance must be evaluated by taking into account, at a minimum, water availability, potential for productivity, grape quality, and, ultimately, wine quality [16].
The measurement task is difficult because the meaning of sustainability is complex and embedded in ideology [20], subjectivity, personal beliefs, cultural backgrounds, and political views [23]. Disagreements over a commonly understood and accepted definition for sustainability and its multidimensional characteristics [14] have led to many different proposals on how to assess it [24,25]. Indicators used to assess sustainability are often selected to validate the scope determined by the proponents of the assessment [10,23], and biased selection can compromise assessment validity and reduce comparability and challenge the notion of accountability. Consequently, because the scope of the sustainability concept defines sustainability assessments, assessment methods are often not directly comparable.
3.2. Drivers of Assessment and Indicator Choice: Past and Present
Indicators have been widely used by governments, sustainability programs, and individual organisations. Governments often use indicators to help design policies and guidelines for specific programs. Sustainability programs often use indicators to create benchmarks for their participants, to set certification rules [6], or to set regional sustainability targets [26] or benchmarks. Individual organisations use indicators to compare and improve their operations throughout their life span.
Due to this complexity and lack of consensus around the sustainability concept, very different approaches have been taken in sustainability assessments. For instance, many researchers in the past focused on adoption of conservation practices [27], and environmental sustainability became the most important component of many proposed assessments. Two representative examples of this are the popularity of low-input sustainable agriculture (LISA) in the early 1980s [27] and carbon footprint assessments related to climate change from the late 1980s onward [28,29]. The LISA approach focuses on reducing the use of off-farm inputs “by the inclusion of biologically-based practices that result in less reliance on purchased inputs” [27] (p. 334). Carbon footprint assessments are closely associated with the idea of reducing greenhouse emissions in a context of natural resource scarcity, economic instability, and climate change [27,30].
The environmental focus in sustainability assessments arose from the tension between development and limited natural resources [31]. However, assessments that only consider one or two of the categories of the triple bottom line are insufficient to fully evaluate sustainability, as sustainability is a systemic concept [32]. For instance, cost-benefit analysis, commonly used to evaluate initiatives in economic and social terms has, thus far, been insufficient to measure or promote sustainable development, as cost-benefit analysis has relied on the economic category of the sustainability concept, and economic models have generally measured growth and competition [33]. More recently, since the creation of the Stiglitz Commission by the French Government in 2008, there has been an increasing interest in developing assessment systems based on human well-being. However, well-being assessment alone also does not necessarily promote sustainable outcomes [23].
maximize the benefits of irrigation) as a new sustainable practice, how can that be measured beyond how much water overall has been used? The limitation of this single measurement is that it neglects, for example, improved fruit quality, which is likely a consequence of several innovations. This difficulty in measuring such intangible processes explains the low level of investment in research and development for disembodied innovations.
Governments also tend to prefer quantitative measures to qualitative ones to inform and communicate their efforts to improve their policy-making and decision-making processes [36,37] and, hence, their accountability and transparency. However, these choices are not automatically linked to improved sustainability outcomes at the level of individual organisations. Consequently, assessments that are too heavily weighted on an accounting perspective that relies mostly on past input usage, rather than outcomes of the assessed sustainability praxis, are limited, as a focus on the past does not ensure improvement of sustainability outcomes in the future [10,13,38].
The method proposed in this article demands a shift of paradigm that requires a move from reducing input usage to optimizing input usage to improve farm output. This requires that multiple contextual issues need to be accounted for in any relevant assessment. In the wine-growing context, these include aspects such as varying rainfall affecting water usage; soil type affecting soil quality inputs; farm management system choices such as organic or conventional affecting fuel and chemical usage; and crop quality objectives such as premium wine versus cask wine affecting cost of inputs and management.
3.3. Some Examples of Current Sustainability Approaches: Agroecology and Carbon Footprint
As discussed above in Section 3.2, systemic approaches seem to be the only reasonable way to fully assess sustainability [30,33,39]. Agroecology is an example of a systemic and interdisciplinary approach to agriculture assessment and development. This approach takes ecology as the basis for the development of any agricultural system, and uses indicators [40–42]. Agroecology has been promoted as a feasible way for poorly resourced farmers to make agricultural progress, as many new technologies are not appropriate for them and in many situations they simply have no access to credit and/or information. However, in spite of showing promise for assessing agricultural sustainability, along with its social and political orientation and emphasis on traditional knowledge, using alternative agriculture and local food system experiences as core components of agriculture systems [43] restricts the universal uptake and acceptance of agroecology worldwide. It therefore has limited application across the spectrum of agricultural enterprises.
associated with wine production [47]. For reasons such as this, employing single factor indicators such as carbon accounting are inadequate to assess sustainability of the agricultural phase of the wine production chain.
3.4. The Complexity of Selecting “Good Indicators”
A good indicator should reduce the complexity of the assessment of the studied system [48]. In agricultural assessments, for example, the uncertainty of weather and climatic conditions plays an essential role in business performance, adding extra complexity to sustainability assessments when compared with many other types of individual business organisations. For instance, in a specific year, does a poor yield due to lack of rain on an unirrigated farm determine the sustainability of this farm? A longer period of time needs to be considered to make such an evaluation.
To date, the biggest problem with assessments has been their inability to measure the totality of effects of practices undertaken toward sustainability. The triple bottom line has been used to address this issue, but environmental, economic, and social components are “inherently intertwined and subject to trade-offs. Accomplishing one objective frequently means backpedalling on another” [36]. As discussed by Santiago-Brown et al., [12], the triple bottom line requires balancing of trade-offs between the environmental, economic, and social components and the additional consideration of time frame and the viewpoint of the assessor.
What are reasonable trade-offs between the assessed indicators? This has predominantly been discussed in regional studies on agricultural trade-offs: Böhringer and Löschel [36] and Wei et al. [49] propose numerical models to assess the impact (therefore the accepted trade-offs) of (mainly) economic and environmental components; Bond et al. [50] and Gibson [39] emphasise the importance of having public trade-off rule criteria as an essential part of the accountability of assessment systems; and Darnhofer et al. [31] apply resilience theory to farming to propose pathways towards more sustainable, therefore resilient farms. All these approaches discuss the complexity of trade-offs, but do not offer a means to develop or choose the appropriate indicators. Also, indicators are not automatically linked to sustainability unless a clear reference level is attached to each of them [51]. In this article we present a method for developing a range of indicators that could improve trade-off decisions and rules.
4. Materials and Methods
This article reports the results of one specific stage in an extensive multi-year, multi-method, cross-national research project [12]. Here, we summarise the overarching method for the entire project, and detail only the methods pertaining to the stage of the research that determined the selection of and criteria for a viable set of representative indicators for assessment of sustainability in vineyards, which are the focus of this article.
4.1. Research Project: Sustainability Assessment in Wine-Grape Growing
grape-growing organisations (CEOs, chief winemakers, and chief viticulturists) from five countries: Australia, Chile, New Zealand, South Africa, and the United States. The aims are:
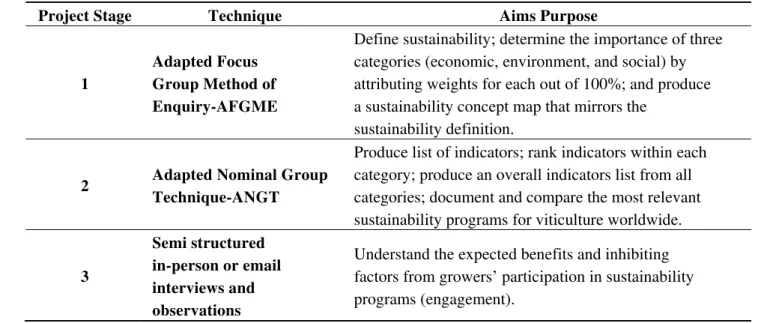
(1) Propose methods to define sustainability; construct indicators to assess sustainability; and understand the engagement of farmers in sustainability programs; (2) Define sustainability in agriculture in the context and viewpoint of individual wine grape–growing organisations; (3) Propose sets of indicators to assess sustainability of individual wine grape–growing organisations; (4) Document and compare the main sustainability programs in viticulture for individual organisations; (5) Develop and implement the McLaren Vale Sustainable Winegrowing Australia program. This article focuses on aim 3, and progress on aims 4 and 5 as has been described in Table 1 [13].
Table 1. Project stages during group interviewing: technique and aims.
Project Stage Technique Aims Purpose
1
Adapted Focus Group Method of Enquiry-AFGME
Define sustainability; determine the importance of three categories (economic, environment, and social) by attributing weights for each out of 100%; and produce a sustainability concept map that mirrors the
sustainability definition.
2 Adapted Nominal Group
Technique-ANGT
Produce list of indicators; rank indicators within each category; produce an overall indicators list from all categories; document and compare the most relevant sustainability programs for viticulture worldwide.
3
Semi structured in-person or email interviews and observations
Understand the expected benefits and inhibiting factors from growers’ participation in sustainability programs (engagement).
4.2. Purposive Sampling
Purposive selection was used to determine both the wine regions represented and the participants. The selection criterion for countries and regions was that they were a wine producer, and that they had a well-documented sustainability program for viticulture. As, to the best of our knowledge, there were no relevant sustainability programs to assess individual vineyards in ‘‘Old World’’ wine countries (Europe) at the time of this investigation, the countries represented in this investigation belong to a group known as “New World” wine producers.
4.3. The Hybrid Method
The objectives of the second stage of the project were to determine an overall ranked list of indicators for vineyard sustainability assessments, and a ranked list within each one of the three sustainability categories: economic, environmental, and social. A hybrid interview and discussion group method was created for this investigation, combining and modifying the focus group and nominal group techniques. There is vast literature comparing group interviewing techniques, including Nominal Group Technique (NGT), focus groups, and brainstorming that have been drawn upon in this investigation. Each of these interviewing techniques has advantages and disadvantages when compared to the others [54–56]. For the purpose of this investigation, the interviewing techniques were combined and adapted with the aim of obtaining representative results. The results of Stage 1 discussions (agreement to use the triple bottom line approach to sustainability) were assumed for Stage 2, in which we used an Adapted Nominal Group Technique (ANGT), which we designed as an adaptation of NGT.
Nominal Group Technique was originally developed in the early 1970s [57] as a group discussion technique oriented to solve and identify problems, and support decision-making processes [54,58,59]. The technique involves a structured process that aims to give participants an equal opportunity to share their thoughts. A typical NGT is organised into at least seven steps: (1) clear statement of the problem; (2) individual generation of ideas before the session or during the session on a blank page with the printed question on it; (3) the listing of individual ideas on a flip chart in a round-robin format (all participants contribute in a set sequence), where the list is built by collecting “one idea per person per turn” [55], in written or oral format; (4) limited discussion among participants, guided by the moderator, only to ensure clarification of items and merging of similar ideas; (5) individual rank of three to five best ideas; (6) voting, public or secret, through cards or stickers on the list; and (7) final rank from group voting and/or ranking, usually shared with participants at the end of the session [55–57,60,61].
A significant difference between our ANGT and the original NGT is related to participants’ preparation. For our group, no prior preparation was required from participants. They were only advised that they would be part of an investigation of sustainability in vineyards. The introduction to the topic happened during the first part of the meeting: participants were introduced to the sustainability concept and given a brief definition of the term indicator, in the context of the investigation, as “something you can use to measure sustainability.” Explanations of terms used by the moderators were kept to a minimum to decrease bias. The only stipulation was the use of the triple bottom line approach—that economic, environmental, and social categories should be taken into account in their proposed list of indicators.
There were two researcher roles in the conduct of the ANGT sessions: the lead researcher and the moderator of the discussions. The lead researcher designed all objectives and the method, and the moderator was an industry-based professional who managed the conduct of the ANGT sessions while the lead researcher assisted him. This two-person process was in compliance with advice that the lead researcher should avoid leading sessions to avoid researcher bias, and the lead researcher was not present at the final phase group discussions.
operators use to manage their business would contribute to build a useful and meaningful list of sustainability indicators.
The ANGT discussion was conducted in three phases and started with the distribution of a set of blank forms to participants on which they were asked to individually write down three to five sustainability indicators for the sustainability of their vineyards. Participants had no restrictions on the indicators that they could propose, and any qualitative or quantitative indicators would be accepted. All participants were encouraged to share their indicators with the group in any order. A list was drawn up on a flip chart with all suggested indicators.
A round-robin format (used in NGT) was not used as, in our pilot session, we found that many participants further developed their thoughts while presenting. Rather, random interactions among participants, when well-moderated, had a synergistic effect. In the majority of the groups, a participant would share all of his or her indicators followed and complemented by another participant, in spontaneous rather than prescribed order, until everyone in the group had contributed to the list. The list was kept available for all participants for the second phase of the ANGT.
The second phase of the ANGT was similar to the first, except that participants were required to list and sort the indicators into three discrete categories: economic, environmental, and social. Participants were advised that they could use the initial group list, available on the flip chart, to help them to build the three new lists, but were not restricted to that list—ideas for new indicators were encouraged. Any indicator could also be listed more than once, if it was relevant to different categories. The three lists from each participant were made available by posting them on the walls of the discussion room.
Scoring was conducted in the third phase of the ANGT. Participants were required to score each of the items from zero to four (or “non-applicable/no-opinion”), in a round-robin format. “Non-applicable/no-opinion” could be used in two distinct situations: (1) structurally non-applicable (NA) (for example, organisations with no employees did not score indicators related to employee welfare for their companies) or (2) the participant did not have an opinion (NO) regarding a particular indicator at the moment of the discussion. We did not want to force participants to provide a score if the proposed indicator was a new concept to them and they thought they needed more time to form an opinion. There were only a few NA/NO responses and they were excluded from the average calculations.
The round-robin format was important for this phase because it gave the proponent an opportunity to clarify the indicator, if necessary, as it was being scored. The scoring occurred immediately after the indicator was read out to the group (and elaborated and discussed, when necessary, for the purposes of clarification) so all participants had a similar understanding of the items they were scoring. If similar indicators were found, they were merged only after discussion and with group consensus.
4.4. Data Analysis
The sessions were audio and audio-video recorded and transcribed. The written forms of participants’ proposed indicators were collected at the end of each session. The flip chart sheets were also collected. This data set was used to create three Excel spreadsheets, one for each of the economic, environmental, and social categories, in which columns were indicators and rows were participants. Each column was numbered sequentially within each category, assigning a number to each indicator. Each set of indicators proposed by a specific ANGT group was colour-coded, so the colour and number code enabled the origin of each original indicator to be traced.
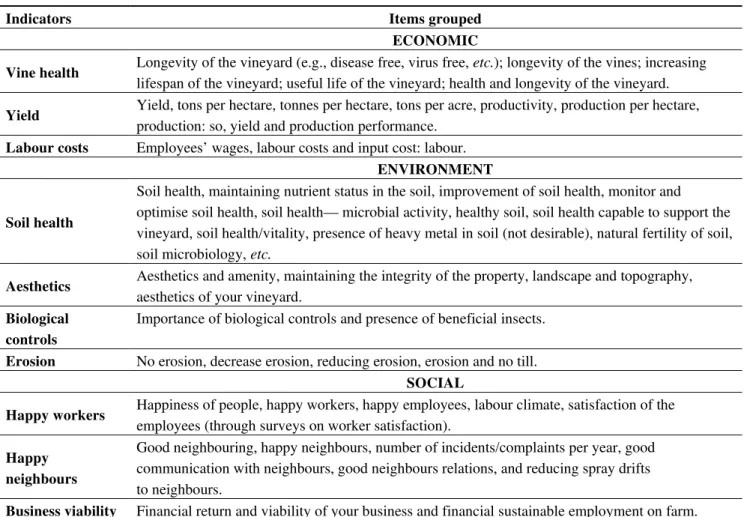
The phase of data reduction required the merging of multiple indicators into a set of merged-concept indicators. To accomplish this, the spreadsheet was printed on large format sheets, and all indicators were physically separated by cutting apart with scissors to create three big puzzles which could be displayed and sorted on a work surface. Examples of merged items to produce the indicator presented in this investigation are shown in Table 2. Again, as part of the data reduction process, when similar indicators within the same group were found, they were merged and their average score was assigned to the merged indicator. The majority of merges occurred during the sessions, although many similar or identical indicators were mentioned in different sessions and merged subsequently.
Table 2. Examples of how indicators were merged (as original lists from group discussion).
Indicators Items grouped
ECONOMIC
Vine health Longevity of the vineyard (e.g., disease free, virus free, etc.); longevity of the vines; increasing lifespan of the vineyard; useful life of the vineyard; health and longevity of the vineyard.
Yield Yield, tons per hectare, tonnes per hectare, tons per acre, productivity, production per hectare, production: so, yield and production performance.
Labour costs Employees’ wages, labour costs and input cost: labour.
ENVIRONMENT
Soil health
Soil health, maintaining nutrient status in the soil, improvement of soil health, monitor and optimise soil health, soil health— microbial activity, healthy soil, soil health capable to support the vineyard, soil health/vitality, presence of heavy metal in soil (not desirable), natural fertility of soil, soil microbiology, etc.
Aesthetics Aesthetics and amenity, maintaining the integrity of the property, landscape and topography, aesthetics of your vineyard.
Biological controls
Importance of biological controls and presence of beneficial insects.
Erosion No erosion, decrease erosion, reducing erosion, erosion and no till.
SOCIAL
Happy workers Happiness of people, happy workers, happy employees, labour climate, satisfaction of the employees (through surveys on worker satisfaction).
Happy neighbours
Good neighbouring, happy neighbours, number of incidents/complaints per year, good communication with neighbours, good neighbours relations, and reducing spray drifts to neighbours.
Business viability Financial return and viability of your business and financial sustainable employment on farm.
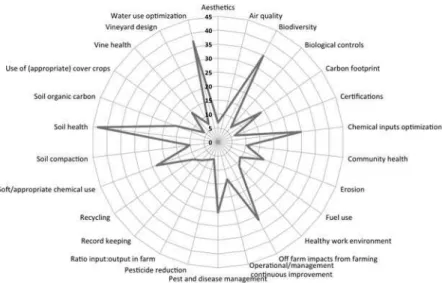
grouping; and (3) proposed wording and indicator groups were signed-off by the lead researcher. Merged indicators from the puzzle were transferred to a spreadsheet and quantified. For each merged indicator, the following were counted: the number of participants in the group that scored that indicator, and the number of ANGT sessions that mentioned the specific indicator. For each indicator, the average of the scores from the participants who gave a score to that indicator was calculated. A rank of importance was created by calculating what we call the Importance Index (II) by multiplying the number of groups that mentioned a specific indicator by the average score of that indicator. Thus, for example, biodiversity (within the environment category) was scored by 67 participants in 11 ANGT sessions. The average score given by the 67 participants is 3.16. The Importance Index is then 3.16 × 11, which equals 34.75. The maximum possible II is the product of the maximum score, 4.0, and total number of sessions, 14, which equals 56. In this way, each ANGT session would have the same weight in our II calculations, independent of the number of people in each group. From the results of these calculations a spider graph for each category was created with indicators listed alphabetically. In the spider graphs displayed (Figures 1–3), the more important indicators within each category are closer to the outer circle.
To make the indicators comparable between different categories, the II was adjusted. The Adjusted Importance Index (AII) was calculated by multiplying the II by the relative weight attributed to the three categories by the consensus formed at stage 1 of the research: economic 41%, environmental 35%, and social 24% [12]. The decision to discontinue interviewing was made by the lead researcher and group discussion moderator once saturation appeared to have been reached. Both agreed that additional groups would not add significant insights and results to the discussion as sustainability themes, concepts, and indicators were occurring repeatedly among groups. By the end of the fourteenth group session, theoretical saturation was achieved. There was a clear understanding that new and unique indicators could potentially be proposed by additional groups, but they are unlikely to affect the research results as they were not mentioned by the preceding groups [62–64].
5. Results and Discussion
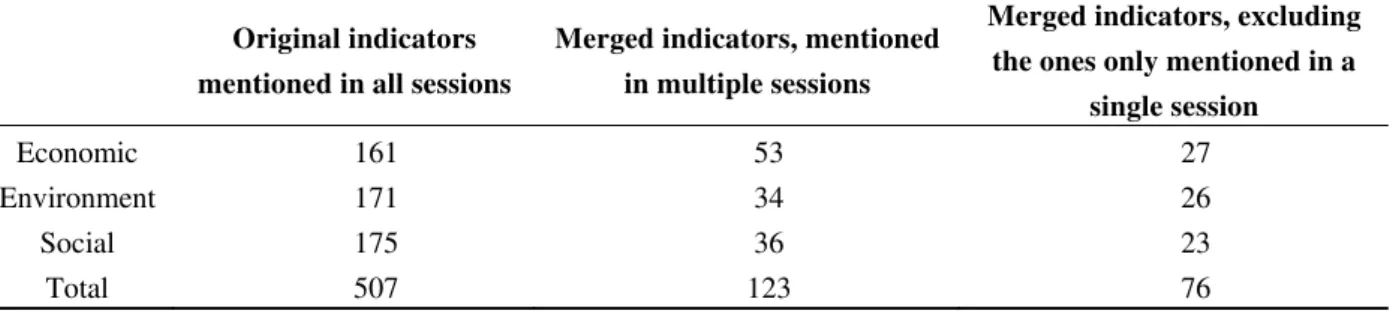
The ANGT sessions generated 507 indicators (Table 3). The participants proposed 161 economic, 171 environmental, and 175 social indicators to assess sustainability of individual organisations at the farm-gate. Table 3 also shows the number of indicators after a data reduction process in which similar indicators were merged, as well as after excluding the indicators only mentioned in a single session. The latter were excluded from the results as they were not considered sufficiently representative for this investigation, and their II is below 4.0. The merged list was about one quarter of the size of the original one: 53 economic indicators, 34 environmental, and 36 social, totalling 123 indicators. The final merged list encompasses 76 indicators (27 economic, 26 environmental, and 23 social).
Table 3. Original number of economic, environmental, and social indicators found in this project and subsequent numbers after merging and exclusion because of lack of representativeness.
Original indicators
mentioned in all sessions
Merged indicators, mentioned
in multiple sessions
Merged indicators, excluding
the ones only mentioned in a
single session
Economic 161 53 27
Environment 171 34 26
Social 175 36 23
Total 507 123 76
5.1. Intersected Indicators for a Better Assessment
The results contribute to the understanding that sustainability assessments through indicators must be systemic. To fully assess sustainability, all three categories and their interrelationships should be taken into account. The final list comprises indicators from all three categories. For instance, as important as they might be, indicators such as soil health (environment) or “grape fit for purpose” (economic), while first and second in the rank of importance (Table 4), in isolation only assess the sustainability status of a vineyard partially, and at a specific time. Soil health assessments are based on whatever type of soil tests (chemical and/or physical and/or biological) are taken during a specific year. Grape fit for purpose can only be assessed in the framework of the original production plan and/or sales contract for a specific vintage. Sustainability assessments through measurements, such as indicators, must be seen as a process capturing changes in a farm over time [16].
The results also show indicators appearing in more than one list, emphasizing the inadequacy of single sustainability viewpoint analysis. Conversely, many of these indicators are complexly entwined into all three sustainability components in spite of appearing in only one of the three specific lists. For instance, “use of appropriate cover crops” (environment) is related to soil issues, but it can also be directly related to water availability, crop, and yield (economic). Furthermore, the use of cover crops can have a direct impact on aesthetics, biodiversity, and erosion. Isolated indicators can tell only partial stories.
5.2. The Proposed Indicators
This investigation differs from the majority of sustainability studies because of the uniqueness of the participants’ characteristics in a participatory bottom-up approach. Only top-level executives in the wine industry took part in this investigation. Participants were not poor-resourced farmers in remote rural communities, which would have different agendas well described by agroecologists [40,41,43]. They were owners, or employed executives, whose goal is to run the vineyard as a sustainable business in a developed economy. The majority had higher education qualifications: 61% with a Bachelor’s degree, 20% with a Masters, and 5% with a Ph.D. [12]. The list of indicators proposed by them and presented in this article reflects the measurements they use in their own business to endure over time.
Indicators were ranked exclusively by the attributed importance from participants. Not surprisingly, the overall proposed rank seems to list (many) similar indicators proposed by other studies in sustainability gathered from different methodologies. Some examples include soil health/quality [16,24]; biodiversity [24,68]; chemical inputs [9]; water use optimisation; and off-farm impacts, including waterways [69], productivity [68], yield [30,70]; and aesthetics [71]. Nevertheless, this investigation is unique as it objectively proposes lists of indicators ranked by their importance. The indicators can be used to guide decision-making in systems consisting of farms and vineyards towards the goal of sustainability, and to monitor progress towards that goal. However, the collection of data for the calculation of indices has costs for the individual organisation, and for monitoring organisations at the regional or governmental level. Qualitative indicators should be chosen by considering their likely impact on the sustainability of the system against the costs of collecting the relevant data. The choices of indicators will be specific to the needs of each vineyard in a given region and typical details are outside the scope of this article.
5.3. Proposed Economic Indicators
Figure 1 displays a spider graph of the economic sustainability indicators ranked by the Importance Index. Grapes fit for purpose is the highest-rated economic indicator (Importance Index of 35.69) followed by economic yield (II = 30.76), management costs (II = 23.95), profitability (II = 21.88), yield (II = 21.68), operational efficiency (II = 20.27), grape demand (II = 19.24), vine health (15.74), and return of investment (II = 15.25), down to capital replacement costs (II = 5.25).
Grapes fit for purpose is a measurement of achieving the intended production quality. It is the most important economic indicator in the list. Fifty-one participants (out of 83 in total) mentioned it in 10 group sessions. The average score was 3.57 out of 4. Economic yield is the second-highest economic indicator. It represents the total economic return of a crop by area taking into account both production yield and quality fit for purpose [72].
Further comparisons between top indicators in each list are also described in this investigation with the objective of giving the reader an indication of importance between listed indicators. The percentage change between the highest, grapes fit for purpose, and the second ranked economic indicator, economic yield, is about 14%. The percentage change between the management costs (third most important indicator) and economic yield is 22%. The comparison between the grapes fit for purpose indicator with the indicator improving operations efficiency (10th place in the economic rank) shows a decrease in importance of 62%. The weight of each indicator from the list is useful to select the most relevant ones in accordance to individual budgets and strategic objectives. The Importance Index is proving itself to be a powerful reference based on 83 real-vineyard operations from five distinct countries.
5.4. Proposed Environmental Indicators
Van der Werf and Petit [10] reviewed 12 indicator-based assessment methods to evaluate environmental sustainability and concluded that: (1) methods should consider both local and global effects; (2) quantitative indicators, mainly effect-based ones, are necessary to identify if results were attained or not; (3) indicators should measure impacts both per unit surface and per unit product; (4) indicators measuring outputs are preferable on a physical scale to scores to be able to benchmark results with the real world; (5) indicator thresholds should be defined; (6) indicator methods should fit the purpose of the objectives of the assessment; and (7) trade-offs should be carefully evaluated to ensure correct evaluations. The indicators proposed by these methods are driven by their objectives: input-related, emission-related, and system state–related. Many of the main indicators used by the 12 methods, such assoil erosion and quality, land use, water use and quality, fertiliser use, pesticide use, greenhouse-gas emissions, and biodiversity, among others, are similar to the indicators proposed by this investigation.
Figure 2. Spider graph of the environmental sustainability indicators ranked by the Importance Index (II).
The environmental indicators are displayed as a spider graph (Figure 2) showing their importance index within this category. The most important environmental indicator, according to the group results is soil health. It has the Importance Index of 43.31, followed by water use optimisation (II = 37.06), biodiversity (II = 34.75), off farm impacts from farming (including waterways) (II = 31.32), chemical inputs optimisation (II = 29.85), pest and disease management (II = 25.14), soft/appropriate chemical use (II = 23.49), carbon footprint (II = 18.58), erosion (II = 17.39), down to use of appropriate cover crops (II = 6.0). The percentage change between the indicators of soil health and water use optimisation is approximately 14%. However, the same calculation between the second and the third environmental indicators, water use and biodiversity, respectively, is only 6%. The percentage changes in indicators’ importance (from the top 10 in this group) become significantly higher from pest and disease management (ranked 6th) onwards. When soil health is compared with pest and disease management, the percentage change is 44%; compared with erosion (ranked 9th), it is 60%.
5.5. Proposed Social Indicators
Indicators to assess social sustainability at farm-gate are not easily found in scientific literature. Figure 3 shows the social indicators proposed by this investigation, ranked by their Importance Index. Staff retention is the most important indicator within the social category with an Importance Index of 27. The second-highest ranked social indicator is training (II = 25.51), followed by healthy work environment (II = 23.81), workers’ engagement (II = 23.70), community benefits (II = 23.63), beyond legal standard for workers (II = 22.42), happy neighbours (II = 20.11), compliance with labour laws (II = 18.34), aesthetics (II = 18), happy workers (II = 17.97), down to tourism (II = 5.43).
Figure 3. Spider graph of the social sustainability indicators ranked by the Importance Index (II). Participants ranked the first six social sustainability indicators similarly. The decrease in the Importance Index between the six indicators is not high, varying from 27 to 22.42 (decrease of 17%). Among these, the community benefits indicator was cited by 9 groups. It was the highest recurrence among groups when listing social indicators. Community benefits also had the second-lowest participants’ average (2.63 out of 4), along with the indicator social events for workers. The high recurrence of community benefits in the ANGT session was fifth-ranked among the social indicators.
5.6. A Good Start for Systemic Assessment Using a Triple Bottom Line Approach
Table 4. Sustainability indicators.
Rank Sustainability Indicators Number of participants
ANGT sessions
Participants’ Average
Importance Index
Adjusted Importance Index
1 Soil health (ENVIRO) 64 12 3.61 43.31 15.16 2 Grapes fit for purpose (ECON) 51 10 3.57 35.69 14.63 3 Water use optimization (ENVIRO) 61 11 3.37 37.06 12.97 4 Economic yield (ECON) 51 9 3.42 30.76 12.61 5 Biodiversity (ENVIRO) 67 11 3.16 34.75 12.16
6
Off farm impacts from farming (including healthy waterways) (ENVIRO)
51 9 3.48 31.32 10.96
7 Chemical inputs optimization (ENVIRO)
49 9 3.32 29.85 10.45
8 Management costs (ECON) 38 7 3.42 23.95 9.82 9 Staff retention (SOCIAL) 44 8 3.38 27.00 9.45
10 Profitability (ECON) 34 6 3.65 21.88 8.97 11 Yield (ECON) 36 7 3.10 21.68 8.89
12 Pest and disease management (ENVIRO)
42 8 3.14 25.14 8.80
13 Operational efficiency (ECON) 37 6 3.38 20.27 8.31
14 Soft/Appropriate chemical use
(ENVIRO) 45 7 3.36 23.49 8.22 15 Grape demand (ECON) 23 5 3.85 19.24 7.89
16 Carbon footprint (ENVIRO) 26 6 3.10 18.58 6.50 17 Vine health (ECON) 27 5 3.15 15.74 6.45 18 Return of investment (ECON) 24 4 3.81 15.25 6.25 19 Training (SOCIAL) 37 8 3.19 25.51 6.12 20 Erosion (ENVIRO) 23 5 3.48 17.39 6.09 21 Healthy work environment (SOCIAL) 42 7 3.40 23.81 5.71 22 Workers’ engagement (SOCIAL) 44 7 3.39 23.70 5.69 23 Community benefits (SOCIAL) 44 9 2.63 23.63 5.67 24 Soil organic carbon (ENVIRO) 30 5 3.23 16.17 5.66
25 Improving operational efficiency
(ECON) 25 5 2.68 13.40 5.49
26 Beyond legal standards for workers
(SOCIAL) 42 7 3.20 22.42 5.38 27 End price of wine (ECON) 26 4 3.19 12.77 5.24
28 Brand value (ECON) 28 4 3.18 12.71 5.21 29 Vine health (ENVIRO) 15 4 3.49 13.96 4.88 30 Happy neighbours (SOCIAL) 35 6 3.35 20.11 4.83
31 Operational/management continuous
Table 4.Cont.
Rank Sustainability Indicators Number of participants
ANGT sessions
Participants’ Average
Importance Index
Adjusted Importance Index
34 Compliance with labour laws (SOCIAL)
32 6 3.06 18.34 4.40
35 Aesthetics (SOCIAL) 30 6 3.00 18.00 4.32 36 Happy workers (SOCIAL) 32 5 3.59 17.97 4.31 37 Labour costs (ECON) 16 3 3.44 10.31 4.23 38 Grape price (ECON) 16 3 3.31 9.94 4.07 39 Healthy work environment (ENVIRO) 18 4 2.86 11.44 4.01 40 Carbon footprint (ECON) 28 5 1.93 9.64 3.95 41 Inputs reduction (ECON) 23 4 2.39 9.57 3.92
42 Air quality (ENVIRO) 16 3 3.69 11.06 3.87 43 Recycling (ENVIRO) 22 4 2.73 10.91 3.82
44 Community health (ENVIRO) 13 3 3.46 10.38 3.63 45 Soil compaction (ENVIRO) 19 3 3.42 10.26 3.59 46 Land value (ECON) 27 3 2.89 8.67 3.55
47 Workers time off (injury/sick days) (SOCIAL)
23 4 3.67 14.67 3.52
48 Succession planning (ECON) 20 3 2.85 8.55 3.51 49 Wine (SOCIAL) 24 4 3.54 14.17 3.40 50 Fuel use (ENVIRO) 17 3 3.18 9.53 3.34 51 Workers' housing (SOCIAL) 24 4 3.46 13.83 3.32 52 Production consistency (ECON) 11 2 4.00 8.00 3.28 53 Education (SOCIAL) 28 4 3.39 13.57 3.26 54 Record-keeping (ENVIRO) 18 3 2.89 8.67 3.03 55 Community health (SOCIAL) 31 5 2.42 12.10 2.90 56 Protective equipment (SOCIAL) 11 3 4.00 12.00 2.88
57 Ability to benchmark performance
(ECON) 21 3 2.33 7.00 2.87
58 Labour productivity (ECON) 12 2 3.50 7.00 2.87 59 Contracts (ECON) 15 2 3.27 6.53 2.68
60 Management continuous assessment
(ECON) 9 2 3.22 6.44 2.64
61 Vineyard design (ENVIRO) 16 2 3.63 7.25 2.54
62 Ratio input:output in farm (as close as possible system) (ENVIRO)
16 3 2.38 7.13 2.49
63 Biological controls (ENVIRO) 12 2 3.50 7.00 2.45 64 Aesthetics (ENVIRO) 10 3 2.30 6.90 2.42 65 Certifications (SOCIAL) 18 3 3.19 9.58 2.30 66 Staff retention (ECON) 14 2 2.79 5.57 2.28 67 Certifications (ENVIRO) 13 2 3.21 6.41 2.24 68 Pesticide reduction (ENVIRO) 7 2 3.14 6.29 2.20 69 Capital replacement cost (ECON) 8 2 2.63 5.25 2.15
70 Use of (appropriate) cover crops
Table 4.Cont.
Rank Sustainability Indicators Number of participants
ANGT sessions
Participants’ Average
Importance Index
Adjusted Importance Index
71 Workers productivity (SOCIAL) 14 3 2.64 7.93 1.90 72 Social events for workers (SOCIAL) 16 3 2.63 7.88 1.89
73 Business viability (SOCIAL) 13 2 3.85 7.69 1.85 74 Workers' ownership (SOCIAL) 15 2 3.13 6.27 1.50
75 Labour costs (SOCIAL) 11 2 2.73 5.45 1.31 76 Tourism (SOCIAL) 14 2 2.71 5.43 1.30
Figure 4 is a Pareto chart of the top 30 indicators ranked by the Adjusted Importance Index. There is a particularly noticeable drop between grape demand (ranked 15th) and carbon footprint (environment, ranked 16th). Because of that, the top 30 indicators were grouped in two sets (15 indicators each) to produce two distinct logarithmic trend lines, identified as a and b. From the first to the 15th indicator (grape demand), the importance of the indicators steadily decreases. From the 16th onwards, the decrease in importance is more stable. Figure 4 shows that the first 15 indicators are well-fitted by an exponential function, which gives an importance of 14.43 for the first indicator, reducing by 0.954 in a geometric progression. The indicators from 16th onwards are well-fitted by a second exponential function, which give an importance of 6.48 for the 16th indicator, reducing by 0.979 in a geometric progression. The last indicator shown in this chart, happy neighbours (social), has an Adjusted Importance Index of 4.8 while the index soil health (environment) indicator is three times larger.
5.7. Recurrent Indicators
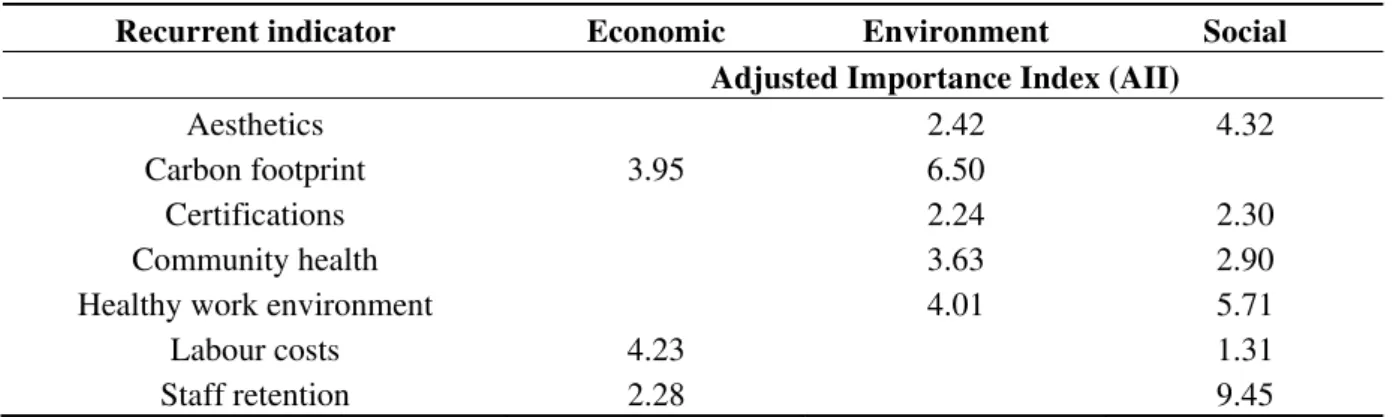
Recurrent indicators in different sustainability categories are shown in Table 5. Aesthetics, carbon footprint, certifications, community health, healthy work environment, labour costs,andstaff retention are recurrent in at least two sustainability categories (Table 5). Most recurrences are between the environmental and social lists. Aesthetics in the social category is 78% more important than in environment.Carbon footprint (economic) is 39% less important than in the environment group.
Table 5. Recurrent indicators within sustainability categories.
Recurrent indicator Economic Environment Social
Adjusted Importance Index (AII)
Aesthetics 2.42 4.32
Carbon footprint 3.95 6.50
Certifications 2.24 2.30
Community health 3.63 2.90 Healthy work environment 4.01 5.71 Labour costs 4.23 1.31 Staff retention 2.28 9.45
Certifications have about the same participants' average in both the environment and social categories. However, the Adjusted Importance Index shows that certifications are slightly more important to the social (AII = 2.30) than to the environment (AII = 2.24) list. Despite certifications emerging in two different categories, it has a relatively low importance in comparative ranking against the top indicators. This has implications for sustainability accounting and the auditing processes, since certification is the direct result of an independent external auditing process.
The community health indicator is 25% more important in the environmental than social category. Healthy work environment is 42% more important in the social category than in the environmental category. There are only two indicators that are recurrent in the social and economic lists: labour costs and staff retention. Labour costs are 223% more important in the economic than in the social category. On the other hand, staff retention is 315% more important in the social than in the economic category. Only one indicator is recurring in both economic and environmental categories: carbon footprint, which is 65% more important in the environmental category than in the economical.
6. Limitations
application to individual grape-growing regions, extended research is required to further develop the proposed indicators in this study for specific, different contexts.
Sustainability outcomes are not easily measurable because of the complex interrelationship among indicators and the lack of a consensual definition for sustainability. Indicator choices are subject to the viewpoint and needs of the assessor [74], and this viewpoint needs to be explicitly expressed to ensure accountability of sustainability assessments [34]. Additionally, indicator thresholds/reference levels are context-dependent [30,70]. Type of crop, socio-economic environment, climate, and soil are the minimum factors that need to be taken into account when establishing indicator thresholds or reference levels to assess sustainability in agricultural systems.
This study is limited to New World wine regions. For future research, the methodology used to build the indicators list could be used to investigate Old World wine regions, considering their context and particularities, such as European Union regulations regarding plantings. The methodology could also be extended beyond wine grapes to be applied to other crops.
7. Conclusions
Leaders of wine businesses in New World wine regions that have the most developed sustainability programs for viticulture provided the data for this study to assess sustainability of vineyards at the individual level. The participants were not only top-level managers and operators, but in many cases were also involved with the development of sustainability assessments for their wine regions and organisations. As a result, their knowledge and experience contributed directly to production of a meaningful and useful list of indicators to assess sustainability in vineyards based on everyday, real-life farm practices.
The ranked overall list of sustainability indicators was constructed to be representative of the views and practices of wine-grape growers in New World wine regions. This ranked list provides indicators for measurement of sustainability in a business context of limited resources for monitoring sustainability. There are many indicators that could be used to monitor the sustainability status of an organisation and we define a workable shortlist that enables indicative measurement based on a calculated Importance Index. This allows individual organizations to measure their sustainability using a minimum number of indicators that still give meaningful representation.
The list we present is consistent with various indicators proposed through different research methods and programs worldwide; however, it reflects the perceptions and operations of everyday real vineyard management, and the indicators have been ranked and assigned a measure of importance. This bottom-up approach produced a shorter, more meaningful list of representative indicators that can be used by managers to evaluate and improve their businesses. This empowers vineyard managers to work their way down the list only to the point required to adequately give indicative measurements within their context and resource limitations.
considering the triple bottom line approach are necessary to assess the development, wealth, and long-term welfare of any system. Economic and social factors are as essential as environmental components in sustainability assessments.
Acknowledgments
This research would not have been possible without the dedication and time of the lead moderator of the focus groups sessions, Dudley Brown. The authors would like to express their gratitude to all focus group participants of the sustainability project for their generous acceptance of our invitation and time to be part of our research. We would also like to thank the organisations where the sessions were held and people involved in the grape-growing industry that helped with introductions or interviews in Australia, Chile, New Zealand, South Africa, and the United States. We also gratefully acknowledge support and discussions with Gerardo Leal (main moderator in Chile) and Joanna Kenny (transcriptions), and funding from the University of Adelaide and the Australian Grape and Wine Authority (AGWA).
Author Contributions
Irina Santiago-Brown organized the focus groups, performed interviews, organised and interpreted data, and wrote the manuscript. Andrew Metcalfe, Cate Jerram, and Cassandra Collins supervised the development of work, helped in data interpretation, manuscript evaluation, and edits.
Conflicts of Interest
The author(s) declared no potential conflicts of interest with respect to the research, authorship, and/or publication with the following exception: Irina Santiago-Brown has participated in research collaborations with some of the informants in this study and also manages and has developed the Sustainable Australia Winegrowing (SAW) McLaren Vale (aka McLaren Vale Sustainable Winegrowing Australia).
References
1. Keeble, B.R. The brundtland commission: Environment and development to the year 2000.
Med. War 1987, 3, 207–210.
2. Milne, M.J.; Grubnic, S. Climate change accounting research: Keeping it interesting and different.
Account. Audit. Account. J. 2011, 24, 948–977.
3. Pannell, D.J.; Glenn, N.A. A framework for the economic evaluation and selection of sustainability indicators in agriculture. Ecol. Econ. 2000, 33, 135–149.
4. Bélanger, V.; Vanasse, A.; Parent, D.; Allard, G.; Pellerin, D. Development of agri-environmental indicators to assess dairy farm sustainability in Quebec, Eastern Canada. Ecol. Indicat. 2012, 23, 421–430.
6. Rigby, D.; Woodhouse, P.; Young, T.; Burton, M. Constructing a farm level indicator of sustainable agricultural practice. Ecol. Econ. 2001, 39, 463–478.
7. Binder, C.R.; Feola, G. Normative, systemic and procedural aspects: A review of indicator-based sustainability assessments in agriculture. In Methods and Procedures for Building Sustainable Farming Systems; Springer: New York, NY, USA, 2013; pp. 33–46.
8. Gray, R. Accounting and environmentalism: An exploration of the challenge of gently accounting for accountability, transparency and sustainability. Account. Org. Soc. 1992, 17, 399–425.
9. Bastianoni, S.; Marchettini, N.; Panzieri, M.; Tiezzi, E. Sustainability assessment of a farm in the chianti area (Italy). JCLP 2001, 9, 365–373.
10. Van der Werf, H.M.G.; Petit, J. Evaluation of the environmental impact of agriculture at the farm level: A comparison and analysis of 12 indicator-based methods. Agr. Ecosyst. Environ. 2002, 93, 131–145.
11. Gray, R. Is accounting for sustainability actually accounting for sustainability and how would we know? An exploration of narratives of organisations and the planet. Account. Org. Soc. 2010, 35, 47–62.
12. Santiago-Brown, I.; Jerram, C.; Metcalfe, A.; Collins, C. What does sustainability mean? Knowledge gleaned from applying mixed methods research to wine grape growing. J. Mixed Methods Res. 2014, doi:10.1177/1558689814534919.
13. Santiago-Brown, I.; Metcalfe, A.; Jerram, C.; Collins, C. Transnational comparison of sustainability assessment programs for viticulture and a case-study on programs’ engagement processes.
Sustainability 2014, 6, 2031–2066.
14. Burritt, R.L.; Schaltegger, S. Sustainability accounting and reporting: Fad or trend? Account. Audit.
Account. J. 2010, 23, 829–846.
15. Parmenter, D. Key Performance Indicators (KPI): Developing, Implementing, and Using Winning Kpis; John Wiley & Sons: Hoboken, NJ, USA, 2010.
16. Oliver, D.P.; Bramley, R.G.V.; Riches, D.; Porter, I.; Edwards, J. Review: Soil physical and chemical properties as indicators of soil quality in australian viticulture. Aust. J. Grape Wine R.
2013, 19, 129–139.
17. Binder, C.R.; Feola, G.; Steinberger, J.K. Considering the normative, systemic and procedural dimensions in indicator-based sustainability assessments in agriculture. Environ. Impact Assess.
Rev. 2010, 30, 71–81.
18. Gómez-Limón, J.A.; Sanchez-Fernandez, G. Empirical evaluation of agricultural sustainability using composite indicators. Ecol. Econ. 2010, 69, 1062–1075.
19. Yli-Viikari, A. Confusing messages of sustainability indicators. Local Environ. 2009, 14, 891–903. 20. Bebbington, J.; Brown, J.; Frame, B. Accounting technologies and sustainability assessment
models. Ecol. Econ. 2007, 61, 224–236.
21. Fraser, M. “Fleshing out” an engagement with a social accounting technology. Account. Audit.
Account. J. 2012, 25, 508–534.
22. Van Liempd, D.; Busch, J. Biodiversity reporting in denmark. Account. Audit. Account. J. 2013, doi:10.1108/AAAJ:02-2013-1232.
24. Abbona, E.A.; Sarandón, S.J.; Marasas, M.E.; Astier, M. Ecological sustainability evaluation of traditional management in different vineyard systems in berisso, argentina. Agri. Ecosyst. Environ.
2007, 119, 335–345.
25. Pacini, G.C.; Lazzerini, G.; Vazzana, C. Aesis:A support tool for the evaluation of sustainability of agroecosystems. Example of Applications to Organic and Integrated Farming Systems in Tuscany, Italy. Ital. J. Agron. 2011, doi:10.4081/ija.2011.e3.
26. Reed, M.S.; Fraser, E.D.G.; Dougill, A.J. An adaptive learning process for developing and applying sustainability indicators with local communities. Ecol. Econ. 2006, 59, 406–418.
27. Saltiel, J.; Bauder, J.W.; Palakovich, S. Adoption of sustainable agricultural practices: Diffusion, farm structure, and profitability. Rural Sociol. 1994, 59, 333–349.
28. Brouwer, F.; Crabtree, B. Environmental Indicators and Agricultural Policy; CABI: New York, NY, USA, 1999.
29. Commission for Sustainable Development. Indicators of Sustainable Development: Guidelines and Methodologies; United Nations Publication: New York, NY, USA, 1995.
30. Koohafkan, P.; Altieri, M.A.; Gimenez, E.H. Green agriculture: Foundations for biodiverse, resilient and productive agricultural systems. Int. J. Agr. Sustain. 2012, 10, 61–75.
31. Darnhofer, I.; Fairweather, J.; Moller, H. Assessing a farm's sustainability: Insights from resilience thinking. Int. J. Agr. Sustain. 2010, 8, 186–198.
32. Von Wirén-Lehr, S. Sustainability in agriculture—an evaluation of principal goal-oriented concepts to close the gap between theory and practice. Agr. Ecosyst. Environ. 2001, 84, 115–129.
33. Espinosa, A.; Harnden, R.; Walker, J. A complexity approach to sustainability-stafford beer revisited.
Eur. J. Oper. Res. 2008, 187, 636–651.
34. Rametsteiner, E.; Pülzl, H.; Alkan-Olsson, J.; Frederiksen, P. Sustainability indicator development—Science or political negotiation? Ecol. Indicat. 2011, 11, 61–70.
35. Sunding, D.; Zilberman, D. The agricultural innovation process: Research and technology adoption in a changing agricultural sector. Handbook Agr. Econ. 2001, 1, 207–261.
36. Böhringer, C.; Löschel, A. Computable general equilibrium models for sustainability impact assessment: Status quo and prospects. Ecol. Econ. 2006, 60, 49–64.
37. Santana-Medina, N.; Franco-Maass, S.; Sánchez-Vera, E.; Imbernon, J.; Nava-Bernal, G. Participatory generation of sustainability indicators in a natural protected area of mexico. Ecol. Indicat. 2013, 25, 1–9.
38. Halog, A.; Manik, Y. Advancing integrated systems modelling framework for life cycle sustainability assessment. Sustainability 2011, 3, 469–499.
39. Gibson, R.B. Sustainability assessment: Basic components of a practical approach. Impact Assess.
Proj. Apprais. 2006, 24, 170–182.
40. Altieri, M.A.; Nicholls, C.I. Agroecology and The Search for A Truly Sustainable Agriculture, 1st ed.; United Nations: Mexico City, Mexico, 2005; pp. 1–290.
41. Wojtkowski, P.A. Introduction to Agroecology: Principles and Practices. Food Products Press: New York, NY, USA, 2006.
43. Gliessman, S.R. Agroecology. Available online: http://www.agroecology.org (accessed on 25 May 2014),
44. Pretty, J.; Sutherland, W.J.; Ashby, J.; Auburn, J.; Baulcombe, D.; Bell, M.; Bentley, J.; Bickersteth, S.; Brown, K.; Burke, J.; et al. The top 100 questions of importance to the future of global agriculture.
Int. J. Agri. Sustain. 2010, 8, 219–236.
45. Lewis, K.A.; Green, A.; Warner, D.J.; Tzilivakis, J. Carbon accounting tools: Are they fit for purpose in the context of arable cropping? Int. J. Agri. Sustain. 2012, 11, 159–175.
46. Bosco, S.; Bene, C.; Galli, M.; Remorini, D.; Massai, R.; Bonari, E. Soil organic matter accounting in the carbon footprint analysis of the wine chain. Int. J. Life Cycle Assess. 2013, 18, 973–989.
47. Christ, K.L.; Burritt, R.L. Critical environmental concerns in wine production: An integrative review. JCLP 2013, 53, 232–242.
48. Doody, D.G.; Kearney, P.; Barry, J.; Moles, R.; O’Regan, B. Evaluation of the q-method as a method of public participation in the selection of sustainable development indicators. Ecol. Indicat.
2009, 9, 1129–1137.
49. Wei, Y.; Davidson, B.; Chen, D.; White, R. Balancing the economic, social and environmental dimensions of agro-ecosystems: An integrated modeling approach. Agr. Ecosyst. Environ. 2009,
131, 263–273.
50. Bond, A.; Morrison-Saunders, A.; Pope, J. Sustainability assessment: The state of the art. Impact Assess. Proj. Apprais. 2012, 30, 53–62.
51. Lancker, E.; Nijkamp, P. A policy scenario analysis of sustainable agricultural development options: A case study for nepal. Impact Assess. Proj. Apprais. 2000, 18, 111–124.
52. Hambrick, D.C.; Mason, P.A. Upper echelons: The organization as a reflection of its top managers.
Acad. Manag. Rev. 1984, 9, 193–206.
53. Teddlie, C.; Yu, F. Mixed methods sampling a typology with examples. J. mixed methods res. 2007,
1, 77–100.
54. De Ruyter, K. Focus versus nominal group interviews: A comparative analysis. Market Intell.
Plann. 1996, 14, 44–50.
55. Fox, W.M. The improved nominal group technique (INGT). J. Manag. Dev. 1989, 8, 20–27. 56. Dobbie, A.; Rhodes, M.; Tysinger, J.W.; Freeman, J. Using a modified nominal group technique as
a curriculum evaluation tool. Fam. Med. 2004, 36, 402–406.
57. Delbecq, A.L.; Van de Ven, A.H., A group process model for problem identification and program planning. J. Appl. Behav. Sci. 1971, 7, 466–492.
58. Gallagher, M.; Hares, T.; Spencer, J.; Bradshaw, C.; Webb, I. The nominal group technique: A research tool for general practice? Fam. Pract. 1993, 10, 76–81.
59. Pastrana, T.; Radbruch, L.; Nauck, F.; Höver, G.; Fegg, M.; Pestinger, M.; Roß, J.; Krumm, N.; Ostgathe, C. Outcome indicators in palliative care—How to assess quality and success. Focus group and nominal group technique in germany. Support. care canc. 2010, 18, 859–868.
60. Duggan, E.W.; Thachenkary, C.S. Integrating nominal group technique and joint application development for improved systems requirements determination. Inform. Manag. 2004, 41, 399–411. 61. Jones, S.C. Using the nominal group technique to select the most appropriate topics for postgraduate
62. Onwuegbuzie, A.J.; Dickinson, W.B.; Leech, N.L.; Zoran, A.G. Toward more rigor in focus group research: A new framework for collecting and analyzing focus group data. Int. J. Qual. Meth. 2009,
8, 1–21.
63. Westhues, A.; Ochocka, J.; Jacobson, N.; Simich, L.; Maiter, S.; Janzen, R.; Fleras, A. Developing theory from complexity: Reflections on a collaborative mixed method participatory action research study. Qual. Health Res. 2008, 18, 701–717.
64. Draucker, C.B.; Martsolf, D.S.; Ross, R.; Rusk, T.B. Theoretical sampling and category development in grounded theory. Qual. Health Res. 2007, 17, 1137–1148.
65. Noss, R.F. Assessing and monitoring forest biodiversity: A suggested framework and indicators.
Forest Ecol. Manag. 1999, 115, 135–146.
66. Bridgman, C. Biodiversity and the South African Wine Sector: A Successful Blend? Stellenbosch University: Stellenbosch, South Africa, 2009.
67. Flores, C.C.; Sarandón, S.J. Racionalidad economica versus sustentabilidad ecologica? El ejemplo del costo oculto de la perdida de fertilidad del suelo durante el proceso de agriculturizacion en la region pampeana Argentina. Revista de la Facultad de Agronomia 2002, 105, 52–67.
68. Altieri, M.A. Agroecological foundations of alternative agriculture in California. Agr. Ecosyst. Environ. 1992, 39, 23–53.
69. Benini, L.; Bandini, V.; Marazza, D.; Contin, A. Assessment of land use changes through an indicator-based approach: A case study from the lamone river basin in northern Italy. Ecol. Indicat.
2010, 10, 4–14.
70. Astier, M.; Speelman, E.N.; López-Ridaura, S.; Masera, O.R.; Gonzalez-Esquivel, C.E. Sustainability indicators, alternative strategies and trade-offs in peasant agroecosystems: Analysing 15 case studies from Latin America. Int. J. Agri. Sustain. 2011, 9, 409–422.
71. Paoletti, M.G. Using bioindicators based on biodiversity to assess landscape sustainability. Agr.
Ecosys. Environ. 1999, 74, 1–18.
72. Hoffman, G.J.; Howell, T.A.; Solomon, K.H. Management of Farm Irrigation; The American Society of Agricultural Engineers (ASAE): St. Joseph, MI, USA, 1990.
73. Friel, S.; Dangour, A.D.; Garnett, T.; Lock, K.; Chalabi, Z.; Roberts, I.; Butler, A.; Butler, C.D.; Waage, J.; McMichael, A.J.; et al. Public health benefits of strategies to reduce greenhouse-gas emissions: Food and agriculture. Lancet. 2009, 374, 2016–2025.
74. Cooper, S.; Pearce, G. Climate change performance measurement, control and accountability in English local authority areas. Account. Audit. Account. J. 2011, 24, 1097–1118.