NUREG/CR-6977
Redox and Sorption
Reactions of Iodine and
Cesium During Transport
Through Aquifer Sediments
AVAILABILITY OF REFERENCE MATERIALS IN NRC PUBLICATIONS
NRC Reference Material
As of November 1999, you may electronically access NUREG-series publications and other NRC records at NRC=s Public Electronic Reading Room at
http://www.nrc.gov/reading-rm.html. Publicly released records include, to name a few, NUREG-series publications; Federal Register notices; applicant, licensee, and vendor documents and correspondence; NRC correspondence and internal memoranda; bulletins and information notices; inspection and investigative reports; licensee event reports; and Commission papers and their attachments.
NRC publications in the NUREG series, NRC regulations, and Title 10, Energy, in the Code of Federal Regulations may also be purchased from one of these two sources.
1. The Superintendent of Documents U.S. Government Printing Office Mail Stop SSOP
Washington, DC 20402B0001 Internet: bookstore.gpo.gov Telephone: 202-512-1800 Fax: 202-512-2250
2. The National Technical Information Service Springfield, VA 22161B0002
www.ntis.gov
1B800B553B6847 or, locally, 703B605B6000
A single copy of each NRC draft report for comment is available free, to the extent of supply, upon written request as follows:
Address: Office of the Chief Information Officer, Reproduction and Distribution
Services Section
U.S. Nuclear Regulatory Commission Washington, DC 20555-0001 E-mail: [email protected] Facsimile: 301B415B2289
Some publications in the NUREG series that are posted at NRC=s Web site address
http://www.nrc.gov/reading-rm/doc-collections/nuregs are updated periodically and may differ from the last printed version. Although references to material found on a Web site bear the date the material was accessed, the material available on the date cited may
subsequently be removed from the site.
Non-NRC Reference Material
Documents available from public and special technical libraries include all open literature items, such as books, journal articles, and transactions, Federal Register notices, Federal and State legislation, and congressional reports. Such documents as theses, dissertations, foreign reports and translations, and non-NRC conference proceedings may be purchased from their sponsoring organization.
Copies of industry codes and standards used in a substantive manner in the NRC regulatory process are maintained atC
The NRC Technical Library Two White Flint North 11545 Rockville Pike Rockville, MD 20852B2738
These standards are available in the library for reference use by the public. Codes and standards are usually copyrighted and may be purchased from the originating organization or, if they are American National Standards, fromC
American National Standards Institute 11 West 42nd Street
New York, NY 10036B8002 212B642B4900
www.ansi.org
Legally binding regulatory requirements are stated only in laws; NRC regulations; licenses, including technical specifications; or orders, not in
NUREG-series publications. The views expressed in contractor-prepared publications in this series are not necessarily those of the NRC.
The NUREG series comprises (1) technical and administrative reports and books prepared by the staff (NUREGBXXXX) or agency contractors
(NUREG/CRBXXXX), (2) proceedings of conferences (NUREG/CPBXXXX), (3) reports resulting from international agreements (NUREG/IABXXXX), (4) brochures (NUREG/BRBXXXX), and (5) compilations of legal decisions and orders of the Commission and Atomic and Safety Licensing Boards and of Directors= decisions under Section 2.206 of NRC=s regulations (NUREGB0750).
DISCLAIMER: This report was prepared as an account of work sponsored by an agency of the U.S. Government. Neither the U.S. Government nor any agency thereof, nor any employee, makes any warranty, expressed or implied, or assumes any legal liability or responsibility for any third party=s use, or the results of such
NUREG/CR-6977
Redox and Sorption
Reactions of Iodine and
Cesium During Transport
hrough Aquifer Sediments
T
Manuscript Completed: May 2008
Date Published: March 2009
Prepared by
J.A. Davis and P.M. Fox
U.S. Geological Survey
Menlo Park, Ca 94025
M. Fuhrmann, NRC Project Manager
NRC Job Code Y6462
ABSTRACT
Radioactive isotopes of iodine (
131I and
129I) and cesium (
137Cs) are important
contaminants present in nuclear waste. These radioisotopes have been introduced into
the environment through nuclear weapons tests as well as nuclear accidents such as
Chernobyl. Although iodine is commonly found as iodide (I
-), which is generally
considered to behave conservatively, it has been proposed that iodide can be oxidized to
elemental iodine (I
2) or iodate (IO
3-) by manganese oxides or nitrate, which may behave
less conservatively in sediments due to uptake by organic matter or adsorption onto
mineral surfaces. Cesium is generally present as a cation (Cs
+) and can be strongly
adsorbed by sediments.
In order to further our understanding of the chemical behavior of I and Cs in groundwater
systems, a series of laboratory and field experiments were undertaken. The kinetics of I
-oxidation by the manganese oxide, birnessite, was investigated under a variety of
geochemical conditions. In order to determine Cs and I sorption and I oxidation, batch
experiments with aquifer sediments and with binary sediment-Mn oxide systems were
performed. Iodide transport was studied in a column filled with aquifer sediments. Three
field tracer test experiments were performed to elucidate the redox chemistry and
transport of I and Cs in an aquifer characterized by distinct geochemical zones: (1)
injection of CsI into a well oxygenated zone of the aquifer, (2) injection of CsIO
3into a
well oxygenated zone, and (3) injection of CsIO
3into a zone of the aquifer characterized
by active Fe(III) reduction (but not sulfate reduction).
In laboratory experiments, birnessite oxidized I
-to I
2and IO
3-in a two-step process. The
oxidation of I
-proceeded according to first order kinetics with respect to initial I
-concentration, pH, and birnessite concentration. I
2sorption to birnessite was high (up to
0.25 mmol/g), while IO
3-sorption to birnessite was an order of magnitude lower (up to
0.024 mmol/g). Uptake of I
-in batch experiments by sediments was fairly low at pH 4.8
or above, as was I
-retardation in column experiments at this pH. In column experiments
at pH 4.50, the results suggested some oxidation of I
-occurred due to a 7% loss of iodine
mass exiting the column, presumably due to volatilization of elemental I
2. IO
3-uptake in
batch experiments with sediments was higher than that of I
-, reaching up to 12%
adsorbed. Cs also adsorbed to aquifer sediments, with up to 22% removed from solution
after 24 hours.
Results from the field tracer tests show that I
-was oxidized to both I
2(up to 46%) and
IO
3-(up to 6%) in the oxic zone, with the extent of oxidation increasing with transport. A
pulse of dissolved Mn was liberated from the sediments, providing evidence that Mn
oxides were responsible for I
-oxidation. Iodate was retarded relative to a conservative
tracer (Br), arriving 5 days later at 3.9 m downgradient. In the Fe-reducing zone, IO
3-was quickly reduced to I
-without any observed production of I
2intermediate. About 60%
of the iodate was reduced to I
-in 1 m of transport, with complete reduction occurring
after 3 m of transport. Cesium transport was retarded relative to the conservative tracer
in all three tracer tests. In the oxic zone of the aquifer, the peak Cs concentration arrived
3.9 m downgradient after 35 days of transport, whereas the Br peak arrived at 8 days. Cs
was so attenuated during the first 3.9 m of transport that the maximum Cs concentration
reached was only 6% of the injected concentration.
While the Cs and I concentrations used in these experiments was much higher than would
be relevant for concentrations of radioactive isotopes of these elements, the studies are
relevant for revealing reaction mechanisms that affect the transport of these radionuclides
in the environment. The results of these experiments demonstrate that not only can redox
transformations of iodine easily occur in groundwater systems, but also that I
2, IO
3-, and
Cs behave non-conservatively by adsorbing to sediments and minerals. The results
indicate the importance of considering the complex redox and sorption chemistry of
iodine when predicting its transport in waste plumes.
Foreword
11
I
I IThe speciation and related behavior of iodine is controlled by its oxidation state, which can change according to different oxidation/reduction levels found in typical groundwater systems. This report, prepared by staff of the U.S. Geological Survey for the U.S. Nuclear Regulatory Commission, describes experiments examining transport and speciation changes of iodine in groundwater and the rates of speciation change under different levels of oxygen content. These changes substantially affect assumptions about transport of iodine in near surface groundwater and shoulq. be considered in
Perfonnance Assessment models of systems containing significant quantities of radionuclides of iodine, such as waste forms generated incidental to nuclear fuel reprocessing.
Radioactive isotopes of iodine and cesium are important contaminants with widely differing chemical properties. Cesium is monovalent and tends to strongly adsorb on many minerals. Iodine, in contrast, sorbs poorly and can undergo several oxidation-reduction reactions; the products of these reactions may have differing sorption properties. To further understand the chemical behavior of iodine in groundwater systems, a series oflaboratory and field experiments were undertaken. Small-scale batch cesium and iodine sorption experiments were conducted with aquifer sediments and binary sediment-manganese oxide systems. Iodide transport was studied in a column filled with aquifer sediments. Three field tracer experiments were performed to define the redox chemistry and transport of iodine and cesium:
.
injection of CsI into a well-oxygenated zone of the aquifer.
injection of CsI03 into a well-oxygenated zone of the aquifer.
injection of CsI03 into a zone of the aquifer characterized by active iron (ill) reduction (but not sulfate reduction).These experiments were conducted on a very well-characterized, heavily-instrumented site, allowing observation of the differential transport of cesium, iodine, and the conservative tracer bromine. Redox transformations of iodide easily occurred in oxygenated groundwater systems where it was oxidized to both iodine and iodate. As iodide was oxidized, manganese appeared in the groundwater, indicating that manganese oxides caused the iodine oxidation. In the reducing zone of the aquifer, iodate was reduced to iodide and was transported at the same rate as nonreactive bromine tracer.. However, the rate of iodate transport in oxic groundwater was retarded by a factor of about 1.4. In this report, small- scale experiments clarified processes controlling iodine speciation and identified analyses necessary to confimi those processes in the field experiments. The field experiments demonstrated that very small differences in location, associated with changed redox chemistry, can alter iodine speciation and transport and mwt be considered in conceptual models assessing perfo~e g,fiodine-bearing systems.
.stiadaLuf, Director Division of Risk Analysis
Office of Nuclear Regulatory Research U.S. Nuclear Regulatory Commission
l
v
CONTENTS
ABSTRACT ………..iii
FOREWORD………...v
FIGURES....………....ix
1 INTRODUCTION ………. 1
2 LABORATORY STUDIES OF CESIUM AND IODINE ADSORPTION AND
REDOX REACTIONS BY AQUIFER SEDIMENTS AND MINERALS ………….3
2.1 Materials and Methods ………3
2.1.1 Synthesis of Birnessite ………3
2.1.2 Aquifer Sediments ………..3
2.1.3 Iodine-Birnessite Batch Experiments ……….3
2.1.4 Cesium and Iodine Batch Experiments with Aquifer Sediments ………4
2.1.5 Column Experiment……….4
2.1.5.1 Column Packing ……….4
2.1.5.2 Transport Experiment Apparatus………4
2.1.5.3 Column Operation ………..5
2.1.6 Iodine and Tritium Analysis ………...5
2.2 Results and Discussion ………...6
2.2.1 Kinetics of Iodide Oxidation by Birnessite ………6
2.2.1.1 Effect of Ionic Strength ………..6
2.2.1.2 Effect of pH ………6
2.2.1.3 Effect of Birnessite Concentration ………..6
2.2.1.4 Elemental Iodine Oxidation by Birnessite ……….7
2.2.1.5 Elemental Iodine and Iodate Adsorption ………...8
2.3 Rate Laws and Modeling Predictions ………..8
2.4 Cesium and Iodine Reactions with Aquifer Sediments ……….11
2.4.1 Iodide Adsorption and Oxidation ………..11
2.4.2 Iodate Adsorption ………..12
2.4.3 Cesium Adsorption ………...13
2.4.4 Iodide Transport in Column Experiments with Aquifer Sediments ……….14
2.5 Summary of Laboratory Studies ………15
3 FIELD STUDIES OF CESIUM AND IODINE TRANSPORT UNDER VARIABLE
ENVIRONMENTAL CONDITIONS ………..19
3.1 Site Description ………19
3.2 Field Experiment Methodology ………..19
3.3 Results and Discussion ……….21
3.3.1 Iodine Oxidation in the Oxic Iodide Tracer Test ……….21
3.3.2 Iodate Adsorption in Oxic Iodate Tracer Test ……….21
3.3.3 Iodate Reduction in the Anoxic Iodate Tracer Test ……….22
3.3.4 Cesium Retardation and Attenuation ………23
3.4 Summary of Field Studies ………..24
4 SUMMARY ………..29
5 REFERENCES ………..31
FIGURES
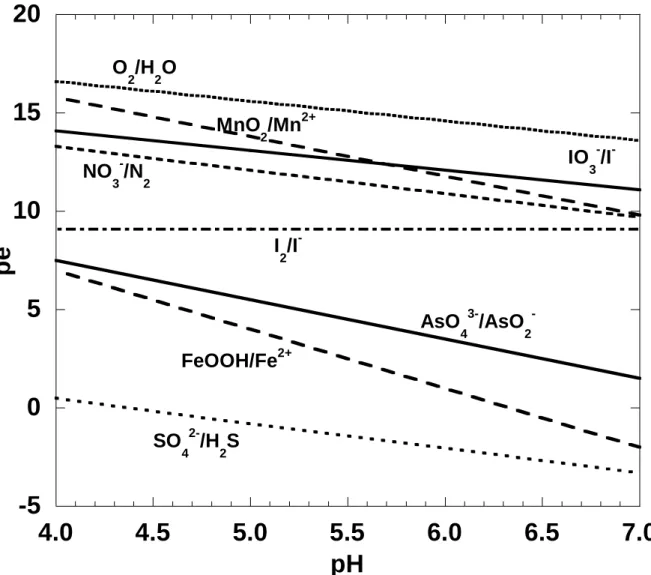
Figure 1.1 pe-pH diagram for various redox couples under conditions relevant to the
laboratory and field experiments described in this report………2
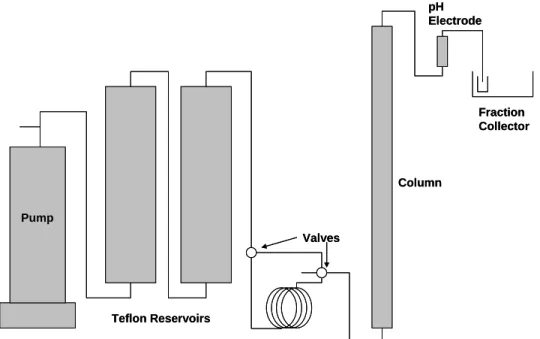
Figure 2.1. Experimental design for column experiment………5
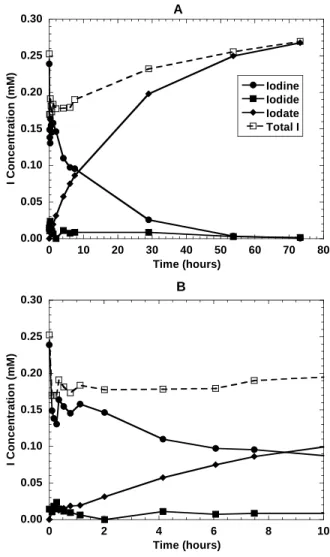
Figure 2.2. (A) Iodide oxidation by birnessite (1g/L) at pH 5.00 in 0.1M NaClO
4solution.
The initial I
-concentration was 1.00 mM. (B) Plot of the same data for the first 8 hours of
the experiment………..7
Figure 2.3 Plot of ln[I
-] versus time for 1 mM I
-oxidation by birnessite (1 g/L) at pH 5.00
in 0.1M NaClO
4solution……….7
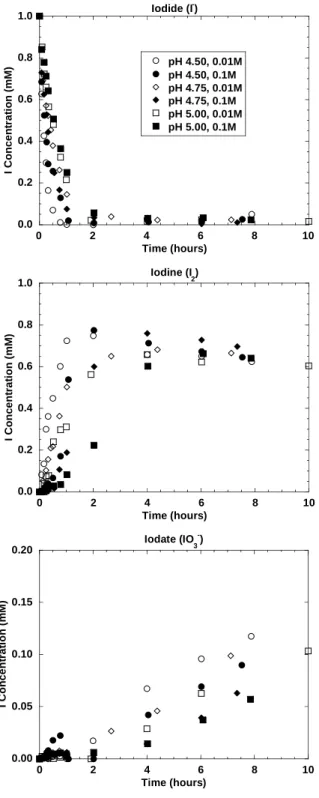
Figure 2.4. Effect of ionic strength on I
-oxidation by birnessite at pH 4.5-5.0, showing
the disappearance of I
-and the production of IO
3-and I
2………9
Figure 2.5. Effect of pH on iodide oxidation by birnessite in 0.1M NaClO
4solution,
showing the disappearance of I
-and production of IO
3-and I
2………9
Figure 2.6. pH dependence of the log of the first order rate constant, k', describing the
disappearance of iodide from solution, determined from reacting 1 mM I
-with 1 g/L
birnessite in 0.1M NaClO
4solution………...10
Figure 2.7. Oxidation of 0.1 mM I
-at pH 5.00 in 0.1M NaClO
4solution for various
concentrations of Birnessite, showing the disappearance of I
-and the production of I
2and
IO
3-versus time………..10
Figure 2.8. Log-log plot of the pseudo-first order rate constant for iodide disappearance
versus birnessite concentration for experiments performed with an initial I
-concentration
of 0.1 mM in 0.1M NaClO
4solution at pH 5.0……….11
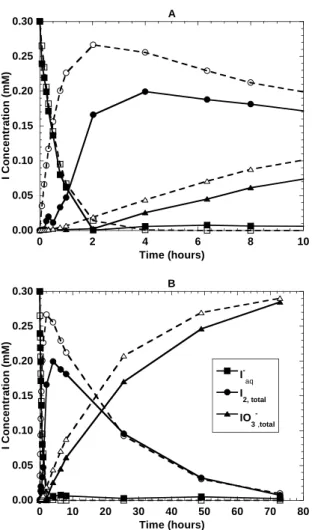
Figure 2.9. (A) I
2oxidation by birnessite (1 g/L) at pH 5.00 in 0.1M NaClO
4solution.
The initial iodine concentration was 0.24 mM (as I). (B) Plot of the same data for the
first 8 hours of the experiment………..11
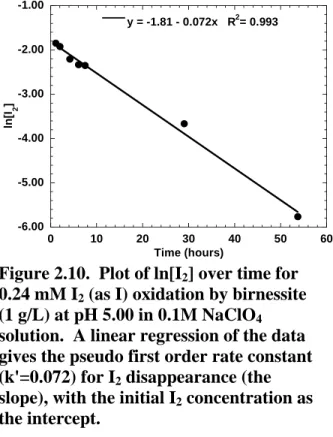
Figure 2.10. Plot of ln[I
2] over time for 0.24 mM I
2(as I) oxidation by birnessite (1 g/L)
at pH 5.00 in 0.1M NaClO
4solution………..12
Figure 2.11. Log of k' for the disappearance of I
2from solution determined at 1 g/L
birnessite in 0.1M NaClO
4solution at pH 5.0, plotted against the initial I
2concentration………..12
Figure 2.12. Iodine sorption by birnessite (1g/L) at pH 5.0 in 0.1M NaClO
4solution….12
Figure 2.13. Iodate sorption by birnessite (1 g/L) at pH 5.0 in 0.1M NaClO
4solution. (A)
Kinetics of IO
3-sorption for sample spiked with 0.50 mM IO
3-. (B) Sorption isotherm
showing adsorbed IO
3-versus IO
3-concentration in solution………13
Figure 2.14. Comparison of actual (solid lines) and predicted (dashed lines) iodide
oxidation by birnessite (1 g/L) using k
1=1.5 and k
2=0.0042 for (A) the first 10 hours, and
(B) 72 hours………...13
Figure 2.15. Comparison of actual (solid lines) and predicted (dashed lines) iodide
oxidation by birnessite (1 g/L) using k
1=1.5 and k
2=0.0473 for (A) the first 10 hours, and
(B) 72 hours………...14
Figure 2.16. Comparison of actual (solid lines) and predicted (dashed lines) iodide
oxidation by birnessite (1 g/L) using k
1=1.5 and k
2=0.1408……….14
Figure 2.17. Time dependence of iodide loss from solution via sorption or oxidation by
sediments (1000g/L)………..15
Figure 2.18. Time dependence of iodate adsorption onto sediments (400g/L)………….15
Figure 2.19. Iodate adsorption onto sediments (400 g/L) at different pH values after 1
week of reaction……….16
Figure 2.20. Time dependence of Cs adsorption onto aquifer sediments (400 g/L)……..16
Figure 2.21. Breakthrough curves for tritium (
3H) and iodide at pH 4.75 and 4.50……..16
Figure 3.1. Map of the Cape Cod field site showing the extent of the wastewater plume
and the locations of the two study areas (wells F625 and F168)……….. 20
Figure 3.2. Breakthrough curves showing Br
-, I
-, I
2, IO
3-, and Mn concentrations at
various distances downgradient of the injection well in the oxic I
-tracer test…………..22
Figure 3.3. Iodate and Br breakthrough curves at various distances downgradient from the
injection well in the oxic iodate tracer test………23
Figure 3.4. Br
-, IO
3-and I
-breakthrough curves at various distances downgradient from
the injection well for the anoxic iodate injection………..24
Figure 3.5. Cs, Br, and K breakthrough curves at various distances downgradient from
the injection well in the oxic iodide tracer test (well F168-M17-02)………25
Figure 3.6. Cs, Br, and K breakthrough curves at various distances downgradient from
the injection well in oxic iodate tracer test (well F168-M17-08)………..26
Figure 3.7. Cs, Br, and K during the anoxic iodate tracer test (well F625-M12-09)…….27
TABLES
Table 2.1. Basic Characteristics of Aquifer Sediment Composite Samples………4
Table 2.2. Summary of Pseudo First Order Rate Constants Determined from the
Disappearance of The Starting Compound (Iodide Or Iodine)………8
Table 2.3. Reaction Conditions and Speciation of Iodine after Reaction of Iodide with
Aquifer Sediments……….15
Table 3.1. Background Chemistry at Injection Wells Used In Field Experiments………20
Table 3.2. Tracer Test Characteristics and Injected Tracer Concentrations………..21
1 INTRODUCTION
Radioactive isotopes of I and Cs are important contaminants produced from nuclear fission. These radioisotopes are components of nuclear waste and have been introduced into the environment through fallout from nuclear weapons tests and nuclear accidents such as Chernobyl (Filipovic-Vincekovic et al., 1991; Blagoeva and Zikovsky, 1995). 131I has a very short half life (8 days) and high activity, whereas
129I has a long half life (1.57 x 10⁷ years). While
129I is a naturally occurring radioactive isotope of iodine, anthropogenic sources have greatly increased the pool of 129I in the environment (Rao and Fehn, 1999; Oktay et al., 2000; Reithmeier et al., 2006). 137Cs and 134Cs have half lives of 30.2 and 2 years, respectively. An understanding of the chemical behavior of iodine and cesium in natural systems is important for understanding the fate of their radioisotopes derived from nuclear wastes.
Iodine can exist in oxidation states ranging from -1 to +7, but in natural waters is most commonly present as iodide (I-), iodate (IO3
-), and organic I (Luther III et al., 1991; Oktay et al., 2001; Schwehr et al., 2005). A pe-pH diagram for various redox couples is shown in Figure 1.1, calculated for conditions relevant to experiments described in this report. While in theory O2 may oxidize I-, this reaction is very slow and thus the H2O/O2 redox couple is not shown in the diagram. Significant research into the redox behavior of iodine in seawater (e.g. Anschutz et al., 2000; Truesdale et al., 2001) has been performed. Anschutz et al. (2000) proposed manganese oxides (MnO2) and nitrate as possible electron acceptors in the oxidation of iodide to iodine and/or iodate (see Fig. 1.1):
½MnO2 + I- +2H+Æ ½Mn2+ + ½I2 + H2O (Eq. 1-1)
I- + 1/5NO3- + 6/5H+Æ 1/10N2 + ½I2 + 3/5H2O (Eq. 1-2)
There is evidence from research in seawater that iodine redox chemistry is linked to that of nitrogen and manganese oxides, however, these reactions have not been directly proven.
Both I- and IO3- are considered to be highly mobile and unreactive with sediments. Sorption of these species to many minerals and sediments is low (Fuhrmann et al., 1998; Kaplan et al., 2000). While most researchers have found that IO3- sorption to minerals and sediments is slightly higher than I- sorption (Couture and Seitz, 1983; Hu et al., 2005), the opposite may be true for certain minerals such as magnetite (Fuhrmann et al., 1998). Elemental iodine (I2) can also be taken up by organic matter, including humic substances (Sheppard et al., 1995; Warner et al., 2000; Schlegel et al., 2006), sorbed to mineral surfaces (Fuhrmann et al., 1998) and volatilized to the atmosphere, providing additional pathways for the non- conservative behavior of iodine.
Cesium is commonly found as the monovalent cation Cs+, and sorbs strongly to sediments via cation exchange (Zachara et al., 2002;
Ainsworth et al., 2005). Cs sorption can usually be described using a two site model including a strong site and a weak site corresponding to the frayed edge sites (FES) and planar sites of phyllosilicates, respectively (Poinssot et al., 1999; Zachara et al., 2002). Several researchers have noted that a fraction of the Cs is
irreversibly sorbed (Comans et al., 1991; Krumhansl et al., 2001; Zachara et al., 2002). In this study, a combination of field and laboratory experiments were conducted to further our understanding of Cs and I
interactions with aquifer sediments, specifically (1) iodide oxidation, (2) sorption of I species, and (3) sorption of Cs species. Through the use of laboratory experiments, the kinetics of iodide oxidation by the manganese oxide, birnessite, was studied under a variety of conditions, including variable pH, ionic strength, initial I concentration, and solid concentration. Cs and I batch experiments with aquifer sediments and with binary sediment-Mn oxide systems were performed to determine the extent of Cs and I sorption and I oxidation. Iodide transport was also studied in a column filled with natural aquifer sediments.
In addition to laboratory studies, the results of three field experiments are described in the report. Tracer tests were performed to elucidate the redox chemistry and transport of Cs and I in an aquifer characterized by distinct geochemical zones: (1) injection of CsI into a well
oxygenated zone of the aquifer, (2) injection of CsIO3 into a well oxygenated zone, and (3) injection of CsIO3 into a zone of the aquifer characterized by active Fe(III) reduction (but not sulfate reduction).
-5
0
5
10
15
20
4.0 4.5 5.0 5.5 6.0 6.5 7.0
pe
pH
FeOOH/Fe
2+SO
4 2-/H
2
S
AsO
43-
/AsO
2 -
I
2/I
-MnO
2/Mn
2+IO
3 -/I
-NO
3-
/N
2
O
2/H
2O
Figure 1.1 pe-pH diagram for various redox couples under conditions relevant to the
laboratory and field experiments described in this report. [SO
42-]=10
-4M; [N
2]=0.77atm;
[O
2]=0.21atm; [NO
3-], [Mn
2+], [IO
3-], [I
2], [Fe
2+], [H
2S]=10
-6M; and [I
-]=10
-3M. The
activities for all solid phases and water were taken as 1.0.
2 Laboratory Studies of Cesium and Iodine Adsorption and Redox Reactions
by Aquifer Sediments and Minerals
2.1 Materials and Methods
2.1.1 Synthesis of Birnessite
Birnessite (δ-MnO2) was synthesized by adding concentrated HCl to a boiling solution of 0.4M KMnO4 (McKenzie, 1971). The resulting precipitate was washed several times with deionized water and then placed in dialysis tubing in a tub of MilliQ-deionized water to further remove salts. The deionized water was changed daily until the conductivity of the rinse water was close to that of MilliQ-deionized water. The solid was confirmed to be birnessite by XRD, and the surface area was determined to be 41 m2/g by 5 point N2-BET. The average oxidation state of Mn in the solid was
determined to be 4.09 by oxalate titration (Hem et al., 1982). The resulting birnessite solid contained 52.4% (w/w) Mn and 9.2% (w/w) K.
2.1.2 Aquifer Sediments
Several sediment composites were used for the batch and column experiments. The composites were created from aquifer materials collected from the oxic zone of a water table in a sand and gravel aquifer located on Cape Cod,
Massachusetts. The site where the sediments were collected has been described in detail elsewhere (Davis et al., 2000). The shallow, unconfined aquifer consists of permeable, stratified glacial sand and gravel deposits, with mineralogy dominated by quartz with minor accessory minerals. Surfaces of sediment grains are heavily coated with hydroxypolymer and clay coatings containing Fe, Al and Mn (Coston et al., 1995; Fuller et al., 1996). A description of the collection and characteristics of these
sediments is given in Amirbahman et al. (2006) and references therein. One composite sediment sample was collected at the location R23AW, while two other samples were collected near well F168 (F168-15; F168 2005). The sample, F168 2005, was a new composite created to replace the exhausted F168-15 composite.
To prepare composite sample F168 2005, four cores were collected near well F168 and the sediments located 15-20 ft (below ground surface) were air-dried. The sediments were then sieved to remove materials greater than 2mm, and the <2mm fractions from each of the cores were combined to create the composite sample. An aliquot of the new composite was extracted with 0.25M hydroxylamine hydrochloride at 50˚C for 96 hours in order to determine the reductively extractable Mn content. Surface area was measured using 5-point N2 BET analysis. The results are compared with the other composites used in this study in Table 2.1. Typical values of extractable Fe(III) can be found in Coston et al. (1995) and Fuller et al. (1996).
2.1.3 Iodine-Birnessite Batch
Experiments
Batch kinetic experiments were performed in order to investigate the effect of numerous variables on iodide oxidation by birnessite. Experiments were performed in a gas tight, 4- port 250-mL glass reaction vessel in the dark. Iodide oxidation by birnessite was determined over a range of conditions, including ionic strength (0.01-0.1 M), pH (4.50-6.25), solid- liquid ratio (0.1-1.0 g/L), and initial iodide concentration (0.1-1.0 mM). The kinetics of I2
oxidation to IO3
-, and IO3
- adsorption by birnessite were also measured.
The birnessite was suspended in a background electrolyte solution of 0.01 or 0.10 M NaClO4
and the pH was adjusted to the desired value with 0.2N HCl or NaOH. The suspension was stirred on a stir plate overnight in order to
equilibrate the birnessite prior to iodine addition. The suspension was then spiked with 0.1 M sodium iodide solution, 0.1 M sodium iodate solution, or ~2 mM I2 (as I) stock solution to achieve the desired concentration of I. The I2
stock solution was created by shaking several grams of doubly sublimed solid I2 in 0.1M NaClO4 in the dark for several hours to create a
Table 2.1. Basic Characteristics of Aquifer Sediment Composite Samples
Composite Specific Surface Area Reductively Extracted Mnm
2/g μmol/m
2R23AW
†0.531 ± 0.115 0.59 ± 0.03
F168-15
†0.608 ± 0.074 3.36 ± 0.20
F168 2005 0.764 ± 0.023 1.29 ± 0.05
†
Data from Amirbahman et al. (2006).
saturated solution, which was filtered andanalyzed for I2 concentration prior to use. The pH of the birnessite suspension was maintained at the target value using a pH stat containing 0.2N HCl throughout the experiment. Samples were periodically withdrawn using a syringe and filtered through a 0.2 μm nylon filter. The first 5 mL of filtered sample were discarded, retaining the next 5-10 mL for analysis. The samples were immediately analyzed for the three iodine species, iodide (I-), iodine (I2) and iodate (IO3-) by spectrophotometer.
In order to investigate iodate sorption by birnessite, a series of samples were prepared at pH 5.0 in 0.1M NaClO4 solution with 1 g/L birnessite, and iodate concentrations ranging from 0.005 to 0.500 mM. The batch
experiments were performed in duplicate in 35mL polycarbonate centrifuge tubes. The birnessite suspensions were adjusted to pH 5.00 and equilibrated overnight prior to spiking with sodium iodate. Samples were reacted for 22 hours before filtering and analyzing in the same manner as in the kinetic experiments.
2.1.4 Cesium and Iodine Batch
Experiments with Aquifer Sediments
Batch experiments were performed in order to investigate the uptake of IO3-, Cs+, and I- onto the natural sediments from the Cape Cod sand and gravel aquifer. An artificial groundwater (AGW) with a composition designed to match that of the oxic zone of the aquifer was created, containing 0.025 mM CaSO4, 0.045 mM MgSO4, and 0.25 mM NaCl. In addition, 5 mM MES buffer or 5 mM acetate/acetic acid was added as a pH buffer for experiments performed at pH 5.6 and 4.5-5.2, respectively.
Uptake experiments were performed in polycarbonate centrifuge tubes at a sediment concentration of 400 or 1000 g/L. Sediment samples were mixed with AGW and the pH was adjusted to the target value. Sediments were equilibrated for 24 hours prior to spiking with I-, IO3
-, or Cs+ to achieve a final concentration of 1.0 mM (I) or 0.5 mM (Cs). Samples were allowed to react for 2 to 168 hours, then
centrifuged and filtered through a 0.45 μm nylon filter and analyzed for iodine species as
described below, or Cs by ICP-MS.
Experiments involving sediment amended with synthetic birnessite at rates of 1.0 and 2.7 mg birnessite per g sediment were also conducted as described above.
2.1.5 Column Experiment
2.1.5.1 Column Packing
A glass adjustable length column from Millipore (2.2 cm inner diameter, 1 m length) was packed with the F168 2005 composite sediment. The column was packed by suspending the sediment in AGW and pouring the slurry into the column. The excess water was displaced by tightening the adjustable length column plungers. The final packed column length was 98.74 cm at a
suspension density of 3849 g/L.
2.1.5.2 Transport Experiment Apparatus
A schematic of the column and pump system is shown in Figure 2.1. It consisted of a stainless steel piston pump (ISCO, 500 mL capacity), two Teflon reservoirs (650 mL), a Teflon tubing (3/16 inch inner diameter) loop, the packed column, an in-line vertical flow pH electrode, and a fraction collector. In order to avoid any contact between the feed solution and theFraction Collector
Column pH Electrode
Pump
Teflon Reservoirs
Valves
Fraction Collector
Column pH Electrode
Pump
Teflon Reservoirs
Valves
Figure 2.1. Experimental design for column experiment (not to scale).
stainless steel pump, the feed solutions werecontained in the Teflon reservoirs (AGW with or without iodide) or the Teflon tubing loop (AGW with tritium), and the pump was filled with a sucrose solution with a density of 1.2 g/mL. The sucrose solution displaced the AGW in the first Teflon reservoir, but was never allowed to reach the second reservoir. All tubing and fittings in the system were Teflon and the valves were 4- way Hamilton valves.
2.1.5.3 Column Operation
The flow rate for the duration of the column experiment was 3.17 mL/hr. The column was first preconditioned with AGW at pH 4.75 until the pH of the effluent water stabilized at pH 4.75
± 0.1 (19 days). Three separate pulses of AGW were pumped through the column: (1) AGW +
3HHO at pH 4.75, (2) AGW + NaI at pH 4.75, and (3) AGW + NaI at pH 4.50. In between each pulse, AGW was pumped through the column until all traces of the previous pulse were gone from the effluent water. A 5 mM acetate buffer was added to the pH 4.5 AGW in order to help buffer the system at this lower pH. Approximately 2 pore volumes (302.8 mL) of AGW spiked with 10 nCi/mL tritiated water (3HHO) was added to the column via the tubing loop. The I- pulses (about 3.7 pore volumes
each) were pumped through the column from the Teflon reservoirs. During breakthrough, effluent samples were collected every 0.5 or 1.0 hour. After reaching a plateau, samples were collected every 2 or 3 hours. The tritium pulse was fitted using CXTFIT in order to determine average linear velocity and pore volume of the packed column.
2.1.6 Iodine and Tritium Analysis
Iodine species were measured using a UV-Vis spectrophotometer on 3 separate samples: (1) active iodine, (2) active iodine + iodide, and (3) iodate. Active iodine includes elemental I2 and its hydrolysis products HOI, OI-, and in the presence of excess iodide, I3-. For the sake of simplicity, active iodine will be referred to as
‘iodine’ or ‘I2’ hereafter. Active iodine and iodide (I-) were measured using the leuco-crystal violet method (APHA, 1992). Briefly, active iodine (1) is determined by adding a citric acid buffer solution (pH 3.8) to each sample or standard, followed by the addition of the leuco crystal violet indicator solution and measuring absorbance at 592 nm. Active iodine + iodide (2) is determined by the same method with the addition of oxone (KHSO5) to oxidize the iodide to iodine. Iodide is then determined by
subtraction of (1) from (2). Iodate was
measured by adding an excess of iodide and sulfamic acid and measuring absorbance at 351 nm (Truesdale, 1978). The iodate concentrations were corrected for the presence of I3
-. Tritium (3H) was measured by liquid scintillation counting on a Beckman LS 6000 counter.
2.2 Results and Discussion
2.2.1 Kinetics of Iodide Oxidation by
Birnessite
Iodide is oxidized by birnessite to both elemental iodine (I2) and iodate (IO3-). Figure 2.2 shows speciation data over time for a typical experiment. All of the experiments showed this same general trend, with iodide disappearing fairly quickly followed by a sharp increase in I2
and a slower production of iodate. It is clear from Figure 2.2 that a significant portion of the iodine is associated with the mineral phase for at least a short period of time. The rates at which these reactions occur vary significantly with factors such as pH and ionic strength. Each of these factors will be discussed further below. The disappearance of iodide over time follows a pseudo first order rate law, and the slope of the plot ln[I-] versus time gives the pseudo first order rate constant (k'). An example of this is shown in Figure 2.3, where only the iodide data above the detection limits (the first 2 hours in this case) was used to determine k'. The pseudo first order rate constants for all experiments are summarized in Table 2.2.
The initial I- concentration was varied from 0.1 to 1.0 mM at pH 5.00. The reaction rate did not vary significantly with initial I- concentration. For example, with initial I- concentrations of 0.1 and 1.0 mM, k' was determined to be 1.53±0.17 and 1.39±0.03, respectively. Because the disappearance of I- appears to be first order, it is expected that varying the initial I- concentration will have no effect on the rate constant.
2.2.1.1 Effect of Ionic Strength
Iodide oxidation by birnessite was investigated in 0.01 and 0.10 M NaClO4 over the pH range 4.50 to 5.00. Increasing the ionic strength slowed down the oxidation reaction (Figure 2.4).
Both the disappearance of I- and the production of I2 and IO3- are slower at higher ionic strength, particularly in the first 2 hours, presumably due to the lower I- activity in solution. However, after 8 hours the effect of ionic strength is only apparent in the production of IO3
-.
2.2.1.2 Effect of pH
Iodide oxidation by birnessite was investigated for the pH range of 4.50 – 6.50. The loss of I- and production of I2 and IO3- occurs more quickly at lower pH as shown in Figure 2.5. If the log of k' for each experiment is plotted against pH (Figure 2.6), the slope of the line represents the reaction order with respect to H+ activity (1.02±0.04). There are two possible explanations for this effect. One involves the pH dependence of iodide oxidation. As seen in equation 2-1, iodide oxidation by birnessite consumes protons, thus it would not be surprising for the rate of oxidation to depend upon the pH.
½MnO2 + I- +2H+Æ ½Mn2+ + ½I2 + H2O (Eq. 2-1)
Acid must be added throughout the experiment in order to maintain a constant pH. However, this trend may also be a reflection of pH
dependent adsorption of iodide onto the mineral surface. As the pH drops, the surface charge of the mineral becomes less negative, and the electrostatic repulsion that opposes the specific adsorption of anions decreases. The point of zero charge (pzc) of synthetic birnessite is low (typically around 1.5) and thus the mineral is negatively charged throughout the entire pH range studied (McKenzie, 1981). Several other researchers have demonstrated that I- may sorb to sediments and minerals such as illite, ferrihydrite, hematite, and imogolite, and the sorption is often inversely dependent on pH (Couture and Seitz, 1983; Yu et al., 1996; Kaplan et al., 2000).
2.2.1.3 Effect of Birnessite Concentration
The concentration of birnessite was varied from 0.2 to 1.0 g/L in experiments containing 0.1 mM0.00 0.20 0.40 0.60 0.80 1.00
0 10 20 30 40 50 60 70 80
I Concentration (mM)
Time (hours)
0.00 0.20 0.40 0.60 0.80 1.00
0 2 4 6 8 10
Iodine Iodide Iodate Total I
I Concentration (mM)
Time (hours) A
B
Figure 2.2. (A) Iodide oxidation by
birnessite (1g/L) at pH 5.00 in 0.1M
NaClO
4solution. The initial I
-concentration was 1.00 mM. (B) Plot of
the same data for the first 8 hours of the
experiment.
I- (Figure 2.7). In all three cases the available exchange sites on birnessite were in excess of the I- concentration. The surface exchange capacity of birnessite (synthesized by the same method used in this study) is reported in the literature to be 25-33 μmol/m2 (McKenzie, 1981; Scott and Morgan, 1995), corresponding to 1.0-1.4 mmol/g for the birnessite used in this study. The rate of I- oxidation was slower at lower birnessite concentrations, for example after 8 hours, 0.010, 0.020, and 0.044 mM of the I- had been oxidized to IO3
- at 0.2, 0.5 and 1.0 g/L birnessite concentrations, respectively. The log of k' is plotted against the log of birnessite
-3.00 -2.50 -2.00 -1.50 -1.00 -0.50 0.00 0.50
0 0.5 1 1.5 2 2.5
y = 0.008 - 1.39x R2= 0.998
ln[I-]
Time (hours)
Figure 2.3 Plot of ln[I
-] versus time for 1
mM I
-oxidation by birnessite (1 g/L) at
pH 5.00 in 0.1M NaClO
4solution. A
linear regression of the data gives a
pseudo first order rate constant (k'=1.39)
for I
-disappearance (the slope), with the
initial I
-concentration as the intercept.
concentration in Figure 2.8, with the slope of the line representing the reaction order with respect to birnessite concentration (0.98 ± 0.23). It appears that the reaction is first order with respect to birnessite concentration, however there is a large error associated with this determination because only three data points were used.2.2.1.4 Elemental Iodine Oxidation by
Birnessite
The oxidation of I2 by birnessite was
investigated in order to separate out the two-step oxidation of I- to I2 and I2 to IO3
-. An example is shown in Figure 2.9. There appears to be an initial drop in I2 concentration which occurs in the first few minutes, which is probably due to adsorption. This is followed by a slower decrease in I2 concentration and corresponding increase in IO3-. The data from the latter reaction period was used to determine the pseudo first order rate constant (k') for I2
disappearance (Figure 2.10). Although a plot of ln[I2] versus time is linear, k' varied with initial concentration (Table 2.2 and Figure 2.11), indicating that the reaction may not, in fact, follow first order kinetics. The reaction order
Table 2.2. Summary of Pseudo First Order Rate Constants Determined from the
Disappearance of The Starting Compound (Iodide Or Iodine)
pH NaClO4
Concentration
Initial I Species
Initial I Concentration
Birnessite Concentration
k' †
M mM g/L hr
-14.50 0.01 I
-1.0 1.0
4.75 0.01 I
-1.0 1.0
5.00 0.01 I
-1.0 1.0
4.50 0.10 I
-1.0 1.0
4.75 0.10 I
-1.0 1.0
5.00 0.10 I
-1.0 1.0
5.25 0.10 I
-1.0 1.0
5.50 0.10 I
-1.0 1.0
5.75 0.10 I
-1.0 1.0
6.00 0.10 I
-1.0 1.0
6.25 0.10 I
-1.0 1.0
5.00 0.10 I
-0.1 1.0
5.00 0.10 I
-0.3 1.0
5.00 0.10 I
20.31 1.0
5.00 0.10 I
20.24 1.0
5.00 0.10 I
20.17 1.0
5.00 0.10 I
20.05 1.0
5.00 0.10 I
-0.1 0.2
5.00 0.10 I
-0.1 0.5
5.30 ± 0.17
1.79 ± 0.06
1.47 ± 0.04
3.25 ± 0.30
2.45 ± 0.06
1.39 ± 0.03
0.627 ± 0.010
0.298 ± 0.013
0.184 ± 0.004
0.118 ± 0.004
0.064 ± 0.003
1.53 ± 0.17
1.57 ± 0.05
0.052 ± 0.002
0.072 ± 0.003
0.089 ± 0.005
0.172 ± 0.009
0.305 ± 0.035
0.552 ± 0.050
† k' was determined using least squared regression analysis and is expressed along with the standard error.
with respect to initial I2 concentration was determined to be 0.79±0.07. This indicates that the oxidation of I2 to IO3
- may be more complex than that of I- to I2; perhaps it is a multistep reaction or is limited by the number of available surface sites on birnessite.
2.2.1.5 Elemental Iodine and Iodate
Sorption
From Figure 2.9 we can see that when I2 is added to a suspension of birnessite, there is an initial drop in aqueous I2 concentration in the first few minutes, followed by a slower decrease that occurs after about 1 hour. We hypothesize here that these two regions represent fast adsorption followed by slower oxidation. The adsorption of I2 to birnessite was determined by averaging the data points in the ‘adsorption’ kinetic region. Adsorbed versus aqueous I2 is plotted in Figure 2.12 below. Although there is
a fair amount of scatter in the data, there is a clear trend especially at lower I2 concentrations. Iodate sorption onto birnessite was investigated and found to be rapid, reaching equilibrium within 30 minutes, and fairly low, reaching a maximum of 0.024 mmol/g as shown in Figure 2.13. It is possible that all of the I species adsorb to birnessite, however, other researchers have found IO3- sorption to be greater than I- sorption on several minerals and sediments (Couture and Seitz, 1983; Hu et al., 2005). An estimate of the total (sorbed + dissolved) IO3-
and I2 can be calculated from Figures 2.12 and 2.13.
2.3 Rate Laws and Modeling
Predictions
If we consider the simple case in which
oxidation proceeds as a two step reaction from I-
0.0 0.2 0.4 0.6 0.8 1.0
0 2 4 6 8 10
Iodide (I-)
pH 4.50, 0.01M pH 4.50, 0.1M pH 4.75, 0.01M pH 4.75, 0.1M pH 5.00, 0.01M pH 5.00, 0.1M
I Concentration (mM)
Time (hours)
0.0 0.2 0.4 0.6 0.8 1.0
0 2 4 6 8 10
Iodine (I
2)
I Concentration (mM)
Time (hours)
0.00 0.05 0.10 0.15 0.20
0 2 4 6 8 10
Iodate (IO
3 -)
I Concentration (mM)
Time (hours)
Figure 2.4. Effect of ionic strength on I
-oxidation by birnessite at pH 4.5-5.0,
showing the disappearance of I
-and the
production of IO
3-and I
2. Suspensions of
1 g/L birnessite were spiked with 1.0 mM
NaI solution.
0.0 0.2 0.4 0.6 0.8 1.0
0 5 10 15 20 25 30
Iodide
pH 4.50 pH 5.00 pH 5.75 pH 6.25
I Concentration (mM)
Time (hours)
0.0 0.2 0.4 0.6 0.8 1.0
0 10 20 30 40 50 60 70 80
Iodine
I Concentration (mM)
Time (hours)
0.0 0.1 0.2 0.3 0.4 0.5
0 10 20 30 40 50 60 70 80
Iodate
I Concentration (mM)
Time (hours)
Figure 2.5. Effect of pH on iodide
oxidation by birnessite in 0.1M NaClO
4solution, showing the disappearance of I
-and production of IO
3-and I
2.
Suspensions of 1 g/L birnessite were
spiked with 1.0 mM NaI solution.
-1.50 -1.00 -0.50 0.00 0.50 1.00
4.0 4.5 5.0 5.5 6.0 6.5
y = 5.18 - 1.02x R2= 0.991
log[k']
pH
Figure 2.6. pH dependence of the log of
the first order rate constant, k',
describing the disappearance of iodide
from solution, determined from reacting 1
mM I
-with 1 g/L birnessite in 0.1M
NaClO
4solution. The slope of the line
represents the reaction order with respect
to hydrogen ion activity.
to I2 and then I2 to IO3
- (and both reactions are first order with respect to I), then the rate laws can be written as follows:
d[I-]/dt = -k1[I-] (Eq. 2-2) d[I2]/dt = k1[I-] – k2[I2] (Eq. 2-3) d[IO3
-]/dt = k2[I2], (Eq. 2-4) where k1 and k2 are the pseudo-first order rate constants for the oxidation of I- to I2 and I2 to IO3
- by birnessite, respectively. These equations can be solved for each I species:
[I-] = [I-]0e-k1t (Eq. 2-5) [I2] = [I-]0(k1/(k2-k1))( e-k1t - e-k2t) (Eq. 2-6) [IO3-] = [I-]0(1+((k1e-k2t – k2e-k1t)/(k2 – k1))),
(Eq. 2-7) where [I-]0 is the initial iodide concentration. Under a given set of conditions, e.g. pH 5.00, 1 g/L birnessite in 0.1M NaClO4 solution, we can determine k1 from the disappearance of iodide to be 1.5 (average of 3 values). As discussed above, in a given experiment the disappearance of I2 appears to follow first order kinetics
0.00 0.02 0.04 0.06 0.08 0.10
0 2 4 6 8 10
Iodide
0.2g/L 0.5g/L 1.0g/L
I Concentration (mM)
Time (hours)
0.00 0.02 0.04 0.06 0.08 0.10
0 2 4 6 8 10
Iodine
I Concentration (mM)
Time (hours)
0.00 0.02 0.04 0.06 0.08 0.10
0 2 4 6 8 10
Iodate
I Concentration (mM)
Time (hours)