A Systematic Study of Local Active Galactic Nuclei
with Infrared and Hard X-ray All-Sky Surveys
Keiko Matsuta
Department of Space and Astronomical Science, Graduate School of Physical Science, The Graduate University for Advanced Studies
2013
Abstract
Some galaxies contain compact nuclei, which emit vast amounts of energy over the entire electromagnetic spectrum from radio through gamma-rays, thus called active galactic nuclei (AGN). The powerful activity originates from the release of gravitational energy through accre- tion of material on to a supermassive black hole with a typical mass in the range of 106−9M⊙. Some of the gravitational energy is thermalized in the accretion disk to radiate ultraviolet and soft X-ray emission. Some is channeled into the generation of energetic particles (or jets) and produces X-ray through gamma-ray emission via inverse Compton scattering and radio through X-rays via synchrotron emission. This radiation from the vicinity of the black hole may heat circumnuclear dust in the obscuring torus of clouds, which is believed to exist on parsec scales outside the accretion disk. The warm torus can then be a source of a strong infrared emission. AGN tend to show large variety in their observational properties, such as luminosities, optical line properties, radio brightness, variability, and so on. In spite of such apparent diversity, it is widely believed that the various AGN are intrinsically the same. Just a few parameters - inclination, accretion rate, and presence/absence of jets - may be responsible for the apparent differences. However, details of the geometry of the nuclei, especially of the torus, are poorly known because their angular scales are very small and difficult to resolve spatially.
The main goal of this thesis is to study the geometry of the nuclear emission region based upon unbiased survey data gathered from multiple wavebands. For this purpose, I take two approaches; one is to explore the correlation between hard X-ray and infrared luminosities using unbiased samples systematically for each AGN type. The other is to analyze variability of mid- infrared emission for individual sources and for each AGN type statistically using two all-sky survey catalogs. This is the first large-scale systematic study of mid-infrared variability in AGN, probing timescales of several years separately for different types of AGN.
For the first approach, I used all-sky surveys conducted by Swift in the hard X-ray (> 10 keV) band and by AKARI in the infrared band. The Swift/Burst Alert Telescope all-sky survey provides an unbiased, flux-limited selection of hard X-ray detected AGN. The hard X-ray band is rather insensitive to the photo-electric absorption due to the intervening clouds up to mildly Compton-thick (NH∼1024cm−2) column densities. In other words, the hard X-ray flux obtained by the survey reflects the intrinsic luminosity for all Compton-thin AGN and also for mildly Compton-thick ones, thus providing samples largely unbiased by obscuration. In the case of infrared observations, high angular resolution is crucial in order to properly separate AGN from stellar emission in the host galaxy. However, this was not possible until the advent of recent telescopes. The AKARI satellite completed an all-sky survey whose catalog was released just before the beginning of this research. This survey is several times more sensitive than previous ones, and was carried out at a much higher angular resolution of the order of arcseconds. Cross- correlating the 22-month hard X-ray survey with the AKARI all-sky survey, I studied 158 AGN
(9, 18, and 90 µm) and hard X-ray (14–195 keV) luminosities, and quantified the correlation for various complete subsamples of AGN. Partial correlation analysis confirms that the correlation is intrinsic; that is, the correlation between the luminosities remains significant after removing the contribution of redshift. Under the unification scheme of AGN, this result may be viewed as supporting clumpy torus models. The good one-to-one correlation between mid-infrared bolometric luminosities and hard X-ray ones for over four orders of magnitude indicates that the covering factor of torus will decrease with the increase of the intrinsic luminosity. The correlation for radio galaxies has a slope and normalization identical to that for Seyfert 1s, where we have a direct view of the nuclear regions in both hard X-rays and infrared, implying similar hard X-ray/infrared emission processes in both. In contrast, sources with large Compton- thick column densities show a large deficit in the hard X-ray band, because high gas column densities in the torus diminish their apparent luminosities even in the hard X-ray band.
On the other hand, a few radio-loud sources (radio galaxies and blazars) show systematic de- viations toward higher X-ray luminosities in the correlations as compared to radio-quiet sources. Origin of the broadband emission of radio galaxies is a matter of considerable debate. One pos- sible explanation of this deviation (i.e., excess X-rays) is the contribution of jets to the hard X-ray emission. Observations of flux variability can be useful for isolating the jet contribution, because strong and rapid fluctuations are characteristic of beamed jet emission. Useful hard X-ray variability data are not yet available, but such data have recently become available in the mid-infrared band. Furthermore, mid-infrared variations can also potentially constrain the geometry of the dusty torus by measuring the response of the torus to changes of the nucleus emission. This leads to the second topic of my thesis to study mid-infrared variability of AGN systematically. I combine two mid-infrared all-sky surveys, i.e., the data released by AKARI and Wide-field Infrared Survey Explorer (WISE). WISE was launched about four years after AKARI and accomplished all-sky surveys with high sensitivity in several mid-infrared bands (particularly relevant for my work are the 12 and 22 µm bands). Because the bands observed by the two telescopes are slightly different, I calculated the flux ratio of WISE and AKARI after subtracting the contribution of band differences, for which the spectral slope calculated for each source was used. In addition, cross-calibration errors of the two telescopes are carefully examined. I find significant mid-infrared variations in 3 sources, 2 blazars and 1 radio galaxy, in either or both of the 9 and 18 µm bands. Although no significant variations are detected from the rest of the sources, low level variations may be hidden in statistical errors. Therefore, I tried to constrain the average sample variability for different AGN types, which was actually detected from Seyfert 1 in the 9 µm band. This is the first detection of variability from Seyfert 1 by using two mid-infrared all-sky surveys. I quantified the amplitudes of sample variability and found that the amplitude reaches∼10% in 4 years for Seyfert 1 in the 9 µm band. If this variability is explained by the torus emission only, dust distribution in the torus should be compact, although other possibilities, such as jet contribution, cannot be excluded. Combining the results of the hard X-ray vs. mid-infrared correlations and mid-infrared variability, geometry and structure of the obscuring torus are discussed.
Contents
1 Introduction 1
1.1 Active Galactic Nuclei . . . 1
1.2 Classification of AGN . . . 1
1.2.1 Seyfert galaxy . . . 2
1.2.2 Quasar . . . 2
1.2.3 Low-ionization nuclear emission line region . . . 2
1.2.4 Radio galaxy . . . 3
1.2.5 Blazar . . . 3
1.2.6 Compton-thick AGN . . . 3
1.3 The unified model of AGN . . . 4
1.4 Emission from AGN . . . 6
1.4.1 Optical and UV emission . . . 6
1.4.2 X-ray emission . . . 6
1.4.3 Infrared emission . . . 7
1.4.4 Emission from jet . . . 7
1.5 Correlations of the infrared and X-ray emission from AGN . . . 8
1.6 Variability of emission from AGN . . . 9
1.7 Aims of the PhD Thesis . . . 11
2 Infrared and hard X-ray correlations of AGN from Swift/BAT and AKARI all-sky survey 13 2.1 Introduction . . . 13
2.2 Observation and Data Selection . . . 14
2.2.1 The Swift/BAT 22-month Source Catalog . . . 14
2.2.2 The AKARI Point Source Catalogue . . . 14
2.2.3 Source identification . . . 15
2.3 Analysis and Results . . . 17
2.3.1 Redshift, Flux distribution and Completeness . . . 17
2.3.2 Hard X-ray to IR luminosity correlation . . . 17
3 Infrared variability of AGN 27 3.1 Introduction . . . 27
i
3.2 WISE All-Sky Source Catalog . . . 28
3.2.1 The Wide-field Infrared Survey Explorer . . . 28
3.2.2 The WISE All-Sky Source Catalog . . . 29
3.3 Cross-identification of sources . . . 30
3.4 Analysis and Results . . . 32
3.4.1 Sample properties . . . 32
3.4.2 Relative flux variations . . . 33
3.4.3 Correction of the wave band differences . . . 34
3.4.4 Variability criteria . . . 38
3.4.5 Fractional of variability in mid-IR band . . . 43
4 Discussion 47 4.1 Correlation for each type of AGN . . . 47
4.1.1 Correlation for Seyfert AGN . . . 47
4.1.2 Correlation for Compton-thick AGN . . . 48
4.1.3 Correlation for radio-loud AGN . . . 50
4.1.4 Constraints on the torus geometry . . . 52
4.1.5 Summary of the correlation for each type of AGN . . . 53
4.2 Variability of mid-infrared emission from AGN . . . 54
4.2.1 Variable sources in mid-IR band . . . 54
4.2.2 Fractional of variability for each type of AGN . . . 55
4.2.3 Correlation between variability and torus radius . . . 55
4.2.4 Other origins of variability . . . 56
4.3 Correlation between variability and luminosity . . . 56
5 Conclusion 59 A Photometric diagnostics for source classification 61 A.1 Radio-loud AGN . . . 61
A.2 Compton-thick AGN . . . 63
A.3 Distinction between Compton-thick AGN and Starburst galaxies . . . 63
A.3.1 starburst–AGN connection . . . 63
A.3.2 color–color diagnostic . . . 64
A.3.3 K-corrections in the color–color plane . . . 66
B SEDs with AKARI and WISE 69
C Relative calibration error between AKARI and WISE 79
Bibliography 81
Acknowledgment 89
List of Figures
1.1 Schematic picture indicating the unified model of AGN . . . 5
1.2 Schematic representation of broadband continuum spectral energy distribution seen in the different types of AGN . . . 8
1.3 Mid-infrared and X-ray luminosity correlation for the sample of 42 VISIR detec- tions and one additional object . . . 10
2.1 Diagram showing the AKARI flight system . . . 15
2.2 Redshift distribution of all AGN detected in the Swift/BAT . . . 18
2.3 Hard X-ray flux distribution for the Swift/BAT sources . . . 19
2.4 Logarithmic luminosity correlations between the AKARI and Swift/BAT . . . 24
2.4 Continued. (b) 18 µm. . . 25
2.4 Continued. (c) 90 µm. . . 25
3.1 The WISE flight system in survey configuration with cover off . . . 28
3.2 Distribution of the angular separation in right ascension and declination between the source positions of the cross-identified sources in WISE and AKARI catalog . 33 3.3 Distribution of the relative flux ratio between AKARI and WISE . . . 34
3.4 Distribution of the power-law slopes and their errors of SED with AKARI and WISEbands . . . 35
3.5 Distribution of relative flux ratio between AKARI and WISE due to the difference of the observation bands . . . 37
3.6 Distribution of ∆F − ∆F0 between AKARI and WISE . . . 38
3.7 Distribution of the variability criteria defined in Equation 3.9 . . . 40
3.8 Same as Figure 3.7, but the center part of the histograms is magnified . . . 40
3.9 Distribution of relative variability of intensity for the total sample of AGN . . . . 44
3.10 Distribution of relative variability of intensity for Seyfert 1, Seyfert 2 and type 1 RL AGN . . . 45
4.1 Logarithmic luminosity correlations between the AKARI and Swift/BAT, when hard X-ray luminosities of Compton-thick AGN in the sample are corrected for obscuration using the columns listed in Table 4.1. . . 50
iii
A.1 Absolute magnitude vs. Color diagram for 89 Swift/BAT and AKARI detected
sources . . . 62
A.2 Color-color plot of log LX/λL9µm vs. log λL9µm/λL90µm for 89 AGN including 9 Compton-thick sources and 7 starburst galaxies detected by AKARI . . . 66
B.1 SEDs of Seyfert 1 with AKARI and WISE . . . 69
B.1 Continued. . . 70
B.1 Continued. . . 71
B.1 Continued. . . 72
B.2 SEDs of Seyfert 2 with AKARI and WISE . . . 73
B.2 Continued. . . 74
B.3 SEDs of type 1 radio-loud AGN with AKARI and WISE . . . 75
B.4 SEDs of type 2 radio-loud AGN with AKARI and WISE . . . 76
B.5 SEDs of Compton-thick AGN with AKARI and WISE . . . 76
B.6 SEDs of Blazar with AKARI and WISE . . . 77
B.7 SEDs of LINER with AKARI and WISE . . . 77
C.1 Signal-to-Noise ratio of A- and F-type stars detected by AKARI and WISE bands 79 C.2 Distribution of ∆F for A- and F-type stars between AKARI and WISE bands . . 80
List of Tables
1.1 Taxonomy of AGN unifications . . . 5
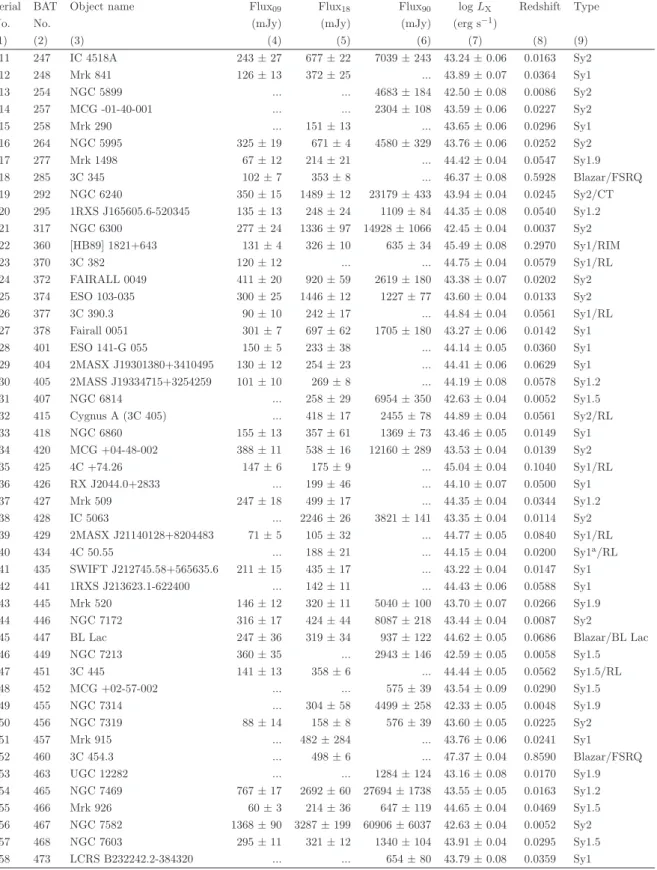
2.1 AKARI infrared propaties of the AGN in the 22-month Swift/BAT catalog . . . 20
2.1 Continued.. . . 21
2.1 Continued.. . . 22
2.2 Summary of cross-identifications . . . 23
2.3 Summary of the fitting results . . . 26
3.1 Summary of the cross-identification . . . 32
3.2 Statistics of ∆F . . . 35
3.3 Statistics of slopes of infrared SEDs . . . 36
3.4 Statistics of ∆F0 . . . 38
3.5 Statistics of ∆F − ∆F0 . . . 39
3.6 Sources variable at >5 sigma significance level . . . 41
3.7 Statistics of variability criteria R . . . 42
3.8 Statistics of variability fraction . . . 44
4.1 Properties of Compton-thick AGN . . . 49
A.1 The sample of starburst galaxies . . . 65
C.1 Statistics of ∆F of stars . . . 80
v
Chapter 1
Introduction
In this chapter, I am going to review the active galactic nuclei (AGN) making stress on the unified model from both observational and theoretical sides. In addition to the review, I will summarize recent studies on correlations of infrared-to-X-ray emission and variability of infrared emission from AGN, which are main topics of the present thesis.
1.1 Active Galactic Nuclei
Some galaxies contain compact nuclei, which are active, emitting vast amounts of energy over the entire electromagnetic spectrum from radio through gamma rays, thus called active galactic nuclei (AGN). The origin of this powerful activity is the release of gravitational energy through accretion of material on to a supermassive black hole (SMBH) with a typical mass in the range of 106−9M⊙. Some of the gravitational energy is thermalized in the accretion disk to radiate ultraviolet (UV) and soft X-ray emission. Some is channeled into the generation of energetic particles (or jets) and produces X-ray through gamma-ray emission via inverse Compton scat- tering and radio through X-rays via synchrotron emission. This radiation from the vicinity of the black hole may heat circumnuclear dust in an obscuring torus of clouds, which is believed to exist on parsec scales outside the accretion disk. The warm torus can then be a source of a strong infrared (IR) emission.
1.2 Classification of AGN
AGN tend to show large variety in their observational properties, such as luminosities, optical line properties, radio brightness, variability, and so on. In spite of these apparent differences, it is widely believed that the various AGN are intrinsically the same. Just a few parameters – inclination, accretion rate, and presence/absence of jets – are responsible for the apparent differences. In the following subsections, I review various AGN types based on their observational properties.
1
1.2.1 Seyfert galaxy
There are two largest subclasses of AGN, Seyfert galaxies and quasars. They are distinguished by their luminosities. In the case of a typical Seyfert galaxy, the total energy emitted by the nucleus at visible wavelengths is comparable to the energy emitted by all of stars in the galaxy (i.e.,∼1011L⊙). On the other hand, in the case of a typical quasar, the nucleus is brighter than that of a Seyfert by a factor of 100 or more. The criteria of Seyferts with B-band magnitude MB >−23 is generally accepted (Schmidt & Green, 1983). Host galaxies of Seyferts are in most cases late type galaxies.
Seyfert galaxies are classified by their spectral properties as Seyfert (Sy) 1 and 2 (Antonucci, 1993). The latter show permitted and forbidden lines from a narrow line region (NLR) in their spectra. Typically, the full width at half maximum (FWHM) of the lines is ∼200-900 km s−1 and the ratio of line intensity F([OIII]λ5007)/F(Hβ)∼10. Sy 1s have the same characteristics, but in addition, exhibit permitted lines (FWHM ∼103− 104 km s−1) from a broad line region (BLR). They also show strong variable featureless continua whose strength is in proportion to their broad line emission.
As the strength of the narrow components increase relative to the broad components, AGN are sometime assigned to type 1.5, 1.8, and 1.9 (Osterbrock, 1989). In Sy 1.5, the strengths of the broad and narrow line components in Hβ are comparable. Those with strong narrow components, and very weak but still visible broad components of Hα and Hβ, are often called Sy 1.8. Those in which a weak broad component may be seen at Hα, but none at Hβ, are called Sy 1.9.
1.2.2 Quasar
Quasars compose the most luminous subclass of AGN, with B-band magnitudes MB < −23. Their spectra are remarkably similar to those of Seyferts, except that stellar absorption features are very weak, if detectable at all, and the narrow lines are generally weaker relative to the broad lines compared to the case in Seyferts. In this sense, quasars may be regarded as the brighter end of Seyferts. However, few quasars to show type 2 characteristics are known. About 5–10% of quasars are strong radio sources.
1.2.3 Low-ionization nuclear emission line region
Low-ionization nuclear emission line region (LINER) constitutes the low luminosity end of AGN, which has an optical spectrum dominated by emission-lines from low ionization states (Heckman, 1980). Any broad lines and featureless continua are swamped by starlight and are generally not detected. Spectroscopically, they resemble Sy 2, except that the low-ionization lines (e.g., [OI]λ6300, [NII]λλ6548, 6583) are relatively strong.
1.2. CLASSIFICATION OF AGN 3 1.2.4 Radio galaxy
AGN may be divided by their activity and/or luminosity in the radio band. Approximately 10% of AGN are classified as radio-loud AGN, which show prominent radio jet and/or lobe emission. Radio galaxies are characterize by their radio-luminous density at 5 GHz to be larger 1032 erg s−1 Hz−1 and by the radio to optical B-band flux density ratio (RB) to satisfy log RB ≥ 1 (Kellermann et al., 1989; Xu et al., 1999; Molina et al., 2008). Strong radio-sources are typically found as giant elliptical galaxies. Two types of radio galaxies are identified with their optical spectra as broad-line radio galaxies (BLRGs, type 1 radio-loud AGN) and narrow-line radio galaxies (NLRGs, type 2 radio-loud AGN), which are counterparts of Sy 1 and Sy 2 in radio-quiet AGN.
The extended radio structures are further divided into two luminosity classes (Fanaroff & Riley, 1974). FR I sources are relatively weak radio sources, which are brightest in the center, with decreasing surface brightness towards the edges. In contrast, the more luminous FR II sources are limb-brightened, and often show regions of enhanced emission (i.e., lobe). The dividing luminosity between the two classes is given by Lν (1.4 GHz) = 1032 erg s−1 Hz−1 (Bridle & Perley, 1984).
1.2.5 Blazar
A small subset of AGN shows short time-scale (as short as a day) variations with large amplitude (∆m≥ 0.1 mag) than other AGN in visible wavelengths. In addition to their large variations in flux, they also tend to have high polarization up to a few percent (as opposed to less than∼1% for most AGN). These AGN are known as “optically violent variables (OVVs)”. Some of the properties of OVVs are shared by “BL Lac objects”, which were originally identified as highly variable stars. BL Lac objects are distinguished from OVVs by the absence of strong emission or absorption lines in their spectra. It is thought that both OVVs and BL Lacs are similar AGN, which have strong relativistically beamed jets close to the line of sight. Collectively, OVVs and BL Lacs are referred to as “blazars”. They are also radio-loud sources.
Flat-spectrum radio-loud quasars (FSRQs, Angel & Stockman, 1980) share basically all of the properties of BL Lac objects such as the presence of a strong non-thermal broadband continuum, except for the absence of broad emission lines. Blazars are divided into weak-lined sources (like BL Lac) and strong-lined sources (like FSRQ), both containing essentially similar relativistic jets. BL Lac and FSRQ correspond to FR I (i.e., low luminosity radio galaxy) and FR II (i.e., high luminosity radio galaxy), respectively (Padovani, 1992).
1.2.6 Compton-thick AGN
Some AGN in the local universe are obscured in the X-ray band by large amounts of gas and dust, which prevent observations of their nuclear emission up to energies that depend on the amount of intrinsic absorption. If the X-ray obscuring matter has a column density, which is equal to or larger than the inverse of the Thomson cross-section (NH ≥ σT−1 ≅1.5×1024 cm−2), then the source is called Compton-thick AGN. The cross-sections for Compton scattering and
photoelectric absorption (for mater of cosmic abundance) have approximately the same value for energies around 10 keV, which can be considered as the low energy threshold for probing the Compton-thick absorption regime. Indeed, if the column density does not exceed a value of order 1025 cm−2, then the nuclear radiation is visible above 10 keV, and the source is called mildly Compton-thick AGN. For higher column densities (heavily Compton-thick AGN), the entire high-energy spectrum is down scattered by Compton recoil and hence depressed over the entire X-ray energy range. The presence of Compton-thick matter may be inferred through indirect arguments, such as the presence of a strong Fe Kα line complex at 6.4–7 keV and the characteristic reflection spectrum.
Compton-thick AGN are important for several reasons. One reason is that a large fraction of AGN (at least a half of Sy 2) in the local universe may be obscured by Compton-thick gas (Maiolino et al., 1998; Risaliti et al., 1999; Matt, 2000). However, Compton-thick AGN with already measured column density occupies only a small fraction of AGN. Thus, more extensive search is required. Another reason is that a sizable population of mildly Compton-thick AGN is postulated in all the AGN synthesis models for the X-ray background (XRB) in order to match the intensity peak of the XRB spectrum at about 30 keV (Ueda et al., 2003). Also, accretion in the Compton-thick AGN may contribute to the local black hole mass density. Unfortunately, the most efficient energy range to search for mildly Compton-thick AGN, i.e., >10 keV is just above the accessible range to the past and most of the present satellites with imaging capabilities. In this sense, recently launched NuSTAR1, which carries X-ray focusing optics above 10 keV for the first time in space, is highly expected.
1.3 The unified model of AGN
AGN are classified into various types by their observed features (in Section 1.2). In spite of the large variety, AGN may be intrinsically a single phenomenon explained by a few numbers of physical parameters together with the observer-dependent parameters. This lead to the idea of the unified model. The basic scheme of the unified model consists of an accreting SMBH surrounded by an obscuring torus (Figure 1.1, Urry & Padovani, 1995). Matter accreting on to the center black hole form a luminous accretion disk. In optical band, broad-line emission is produced in clouds (i.e., BLR) orbiting around the disk. Some continuum and broad-line can be scattered into the line of sight by hot electrons in BLR. Also, narrow-line emission is produced in clouds (i.e., NLR) much farther from the central source. Some AGN emit bipolar jets from the region near the black hole at relativistic speed.
In the unified model, the key elements are luminosities, viewing angle to torus (inclination), and presence of jets. I summarize the basic idea of the unified model of AGN in Table 1.1. Firstly, AGN are divided by their radio loudness, which originate from prominent radio jet and/or lobe emission. Secondly, viewing angle to obscuring torus separates AGN. If the torus is seen face-on (such sources are classified as “type 1”, which include Sy 1, Quasar, and BLRG), we can see the central region directly. If our viewing angle is close to edge-on (such sources are
1http://www.nustar.caltech.edu/
1.3. THE UNIFIED MODEL OF AGN 5
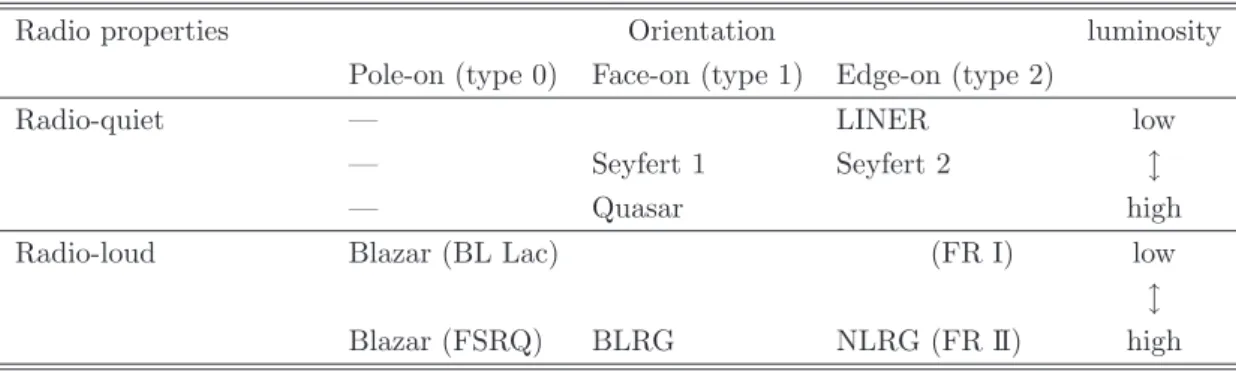
Table 1.1: Taxonomy of AGN unifications
Radio properties Orientation luminosity
Pole-on (type 0) Face-on (type 1) Edge-on (type 2)
Radio-quiet — LINER low
— Seyfert 1 Seyfert 2 ↕
— Quasar high
Radio-loud Blazar (BL Lac) (FR I) low
↕
Blazar (FSRQ) BLRG NLRG (FR II) high
classified as “type 2”, which include Sy 2, LINER, and NLRG), we cannot see the central region directly. Typically, the former spectra has both narrow and broad emission lines, and the latter has only narrow lines in their emission because the torus prevent us from observing emission from central broad line region. Blazars (including BL Las and FSRQ) are classified as “type 0” because their axes of jets stay parallel to the line of sight (i.e., “pole-on”).
Typical sizes of these emission and obscuration regions are as follows. If we take a central black hole of a mass of 108M⊙, as an example, it has a typical size of the radius∼1013cm; the accretion disk emits mostly from ∼1015 cm; the broad line region are located within∼1016 cm of the black hole; and the inner radius of the dusty torus is≥1017 cm. The narrow-line region extends≥1018 cm; and radio jets are detected on scales ranging 1017−24 cm.
Figure 1.1: Schematic picture indicating the unified model of AGN (Urry & Padovani, 1995).
Jaffe et al. (2004) revealed that the warm (320 K) dust in 2.1×3.4 parsec surround a smaller hot (800 K) region in the galaxy NGC 1068 by using interferometric observations with the Very Large Telescope Interferometer (VLTI). However, it is generally difficult to resolve dust distribution because the central region is too small to resolve. Pier & Krolik (1992, 1993) suggested a torus with cylindrical geometry and homogeneous smooth dust distribution by
using two-dimensional radiative transfer algorithm. On the other hand, Krolik & Begelman (1988) discussed that smooth dust distribution probably cannot survive in the vicinity of an AGN and the dust is arranged in clouds. Nenkova et al. (2002) and Dullemond & van Bemmel (2005) showed results of radiative transfer calculations of such a clumpy medium and suggested that a torus consisting of clouds is capable of suppressing the silicate emission and absorption. Structure and geometry of the dust torus are still not clear and are matters of intense studies.
In addition, it is not clear whether the torus of the Compton-thick AGN conform that of the unified model. Some people conjecture that partially or heavily obscured AGN need not be edge on, since obscuring material only needs to block the observer’s sightline (e.g., Elvis, 2000; Risaliti et al., 2002; Miller et al., 2008). They suggested the partial covering is caused by a clumpy gas wind from the accretion disk.
1.4 Emission from AGN
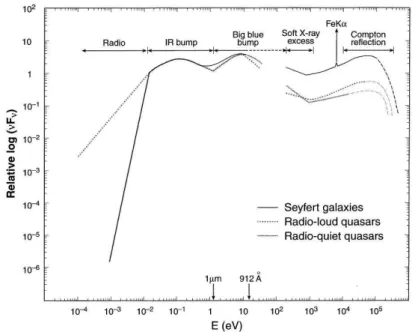
AGN emit broadband radiation over the entire electromagnetic spectrum. Figure 1.2 shows the mean spectral energy distribution (SED) of different types of AGN. In this section, I will give a brief description on the characteristics and origin of the emission in each wave band.
1.4.1 Optical and UV emission
Between the optical and UV bands (0.1–1 µm), there is a dominant and strong broad feature, called “big blue bump”, which emit a copious amount of energy. The big blue bump is usually attributed to thermal emission in the range of 105±1 K. If the emission is optically thick, it is usually considered to be originated from the accretion disk. If so, relativistic effects should produce significant polarization in the accretion-disk continuum, and a Lyman edge (at 912˚A), in either emission or absorption, is expected because the opacity changes dramatically at Lyman edge. However, they are not well established observationally. Various reasons are considered for the absence of the edge structure under the assumption of the accretion disk origin of the bump. But, no consensus is reached yet.
1.4.2 X-ray emission
The X-ray emission accounts for typically ∼10% of bolometric luminosity of AGN and is pro- duced at the innermost region. The X-ray emission of Seyfert galaxies consists of several compo- nents, including a power law continuum in the 1–10 keV range (α≅0.9, where Fν ∝ ν−α), soft excess usually below 1 keV, and a reflection hump in the 10–30 keV range. The nuclear X-ray emission (> 0.1 keV) from AGN is produced by Comptonization of the UV/optical photons from the accretion disk in a hot corona surrounding the disk (Sunyaev & Titarchuk, 1980; Haardt & Maraschi, 1993), with a possible exception of jet-dominated sources. The soft excess is generally considered as the hard tail of blackbody radiation (i.e., big blue bump) from accretion disk. In the spectra of Seyfert galaxies, Fe 6.4 keV line emission is often detected which is attributed to fluorescence of cold material (Mushotzky et al., 1993). The Fe K line and reflection hump in
1.4. EMISSION FROM AGN 7 hard X-ray band are consistent with the idea that the primary X-rays are reflected in optically thick material.
1.4.3 Infrared emission
The average SED also displays a strong IR bump around 1–100 µm, where a significant portion of their power emerges (e.g., Antonucci, 1993; Elitzur, 2008). Its source is considered to be a pc-scale torus of dust and gas clouds. The high-energy disk and corona emission heat the dusty tori located far from the center, where the nuclear UV-to-X-ray continuum is re-processed into thermal IR photons, which are not dominated by beamed emission from relativistic jets (e.g., Elitzur, 2008). There are some strong evidences that the IR continuum in non-blazar AGN is thermal in origin. One is the 1 µm minimum in the spectra (Sanders et al., 1989), which corresponds to the gap between the big blue bump and the thermal emission from dust at a temperature of∼2000 K corresponding to sublimation temperature of dust grains. Second is the delay of near-IR continuum emission to UV/optical continuum emission, which is interpreted as the light travel time because the IR emission region (i.e., torus) is separated from the UV/optical emission region (i.e., accretion disk). Third is the submillimeter break, i.e., the decrease in submillimeter SEDs. At these long wavelengths, a thermal spectrum can produce a sharp cut- off because the emission efficiency of small grains drop off as Fν ∝ ν2+γ, where γ represents the frequency dependence of emissivity .
1.4.4 Emission from jet
In the case of the emission from jet-dominant AGN (e.g., blazars), the broadband spectra are thought to be dominated by non-thermal emission from their relativistic jets (Bregman, 1990; Fossati et al., 1998; Donato et al., 2001). The IR regime is explained mainly by synchrotron radiation. In the case of FSRQs, the X-ray component is produced by the inverse-Compton scattering of seed photons within the jet (synchrotron self-Compton process, SSC) or external to the jet (e.g., within the BLR or dusty tori). In the case of low-power BL Lacs, the high-energy tail of the synchrotron continuum typically produces the X-ray component. In principle it is possible to produce the high-energy emission via the SSC process. The SSC process becomes important when the synchrotron radiation density becomes sufficiently high that the emitted photons are inverse-Compton scattered off electrons, which are responsible for the synchrotron radiation. The SSC model predicts polarization of a few percent, which are observed in continuum only from blazars. Various observations support a picture that much of the radio through optical emission originates in an inhomogeneous plasma jet through which shocks propagate (Bregman, 1990). A shock wave passing through an adiabatic, conical, relativistic jet not only reproduces this broadband variability, but also naturally leads to relatively flat radio spectra.
Figure 1.2: Schematic representation of broadband continuum spectral energy distribution (SED) seen in the different types of AGN (Koratkar & Blaes, 1999). The spectra of AGN can be divided into three major components; the big blue bump, the infrared bump, and the emission of X-ray region. The ordinate is normalized logarithmic intensity as νFν. The abscissa is log energy in units of eV. Bold-solid line shows the SED of Seyfert galaxies. Dashed and thin-solid lines show SEDs of radio-loud and radio-quiet quasars, respectively.
1.5 Correlations of the infrared and X-ray emission from AGN
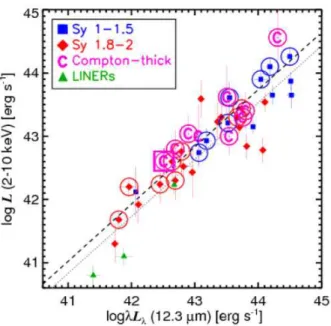
Correlations of emission from different wavebands are a potentially powerful tool for investigat- ing the geometry of nuclear region and emission mechanisms. Especially, correlations between IR and X-ray bands have been investigated well in order to obtain information from the inner- most region of AGN. Since the 1980s, space-based telescopes have provided a wealth of new information in the previously unexplored IR and X-ray wavelengths. For the samples measured in X-rays (2–10 keV), mostly Sy 1s, Carleton et al. (1987) found that the 3–10 µm luminosities are tightly correlated with the X-ray luminosities, while the UV and far-IR luminosities are not. Mulchaey et al. (1994) found that distribution of the flux ratio of IR (sum of 25 and 60 µm) -to-X-rays (2–10 keV, corrected for observed absorption) emitted from AGN are similar between Sy 1s and Sy 2s. Using larger samples, Lutz et al. (2004) found that there is no significant difference between Sy 1s and Sy 2s in the average ratio of mid-IR-to-absorption-corrected X-ray emission. With the high angular resolution in the mid-IR imaging by VLT/VISIR, Horst et al. (2006, 2008) could exclude any significant non-torus contribution to the mid-IR continuum, and they found similarity in the mid-IR-to-X-ray (12.3 µm-to-2-10 keV) luminosity ratio between Sy 1s and Sy 2s, which is intrinsic to AGN. Augmenting samples with their previous observations and with published intrinsic X-ray fluxes, Gandhi et al. (2009) found strong mid-IR vs. X-ray luminosity correlation for AGNs and that unobscured, obscured, and Compton-thick sources
1.6. VARIABILITY OF EMISSION FROM AGN 9 follow the similar luminosity correlation (Figure 1.3). The fact that unobscured, obscured, and Compton-thick sources all closely follow the same luminosity correlation has important implica- tions for the structures of Seyfert cores.
However, because samples observed in soft X-ray (< 10 keV) band are strongly biased to small line-of-sight column densities, we need to correct absorption effect in fluxes. The X-ray fluxes of Compton-thick AGN, especially, are completely absorbed in soft X-ray band. On the other hand, hard X-ray luminosities (> 10 keV) and IR luminosities are relatively insensitive to obscuration than the soft X-rays. Using Swift/Burst Alert Telescope (BAT, 14–195 keV) Survey 9-month AGN Catalog (Tueller et al., 2008), Mushotzky et al. (2008) found that the near-IR nuclear J- (1.21 µm) and K-band (2.18 µm) luminosity is correlated with the BAT luminosity over a factor of 103 in luminosity (LIR ≈ L1.25BAT). Also, it is found that the [OIV] 25.89 µm emission-line luminosity is an accurate indicator of the intrinsic power of the AGN based on the good correlation between [OIV] and BAT luminosities of X-ray selected nearby Seyferts (Mel´endez et al., 2008; Rigby et al., 2009).
X-ray emission from AGN is generally attributed to the nuclear engine itself and heats the circumnuclear dust, which in turn becomes the source of the nuclear mid-IR emission. As noted before, there is a good linear correlation between the logarithms of the observed continuum emission in the mid-IR and the intrinsic soft X-ray (< 10 keV) band luminosities of local AGN, which appears to be largely independent of the amount of dust reddening (e.g., Krabbe et al., 2001; Lutz et al., 2004; Horst et al., 2006, 2008; Gandhi et al., 2009; Levenson et al., 2009; Asmus et al., 2011). This is not expected according to the pioneering AGN dust torus model (Pier & Krolik, 1993), which assumed homogeneous and smooth dust distribution, because IR emission from the warm-inner clouds is expected to be dramatically scattered and reduced when viewed from an edge-on orientation. On the contrary, observations show tight correlations with little scatter and no IR depletion, largely independent of orientation (which ought to be correlated approximately with dust reddening) at all AGN luminosities. Under the torus paradigm, correlations may be consistent with models having a clumpy obscuring geometry (e.g., Krolik & Begelman, 1988; Dullemond & van Bemmel, 2005; H¨onig et al., 2006; Nenkova et al., 2008; Schartmann et al., 2008; H¨onig et al., 2010; H¨onig & Kishimoto, 2010), in which the inner torus regions can be visible even at edge-on orientations.
1.6 Variability of emission from AGN
Variability of emission from AGN is precious information to probe the nuclear regions because it is difficult to resolve them on parsec scale (i.e., torus and/or interior region) directly by the present resolution power of a single telescope.
Strong UV and X-ray variability is common to AGN on a wide range of timescales with the most rapid variations seen in X-rays (e.g., McHardy, 1988; Grandi et al., 1992; Mushotzky et al., 1993). By studying light curves and spectra, long-term (from days to months) and short- term (from hours to days) variability are observed from most of AGN with amplitude up to a factor of 50 or so (Ulrich et al., 1997). Both the soft excess below 1 keV and the X-ray
Figure 1.3: Mid-infrared and X-ray luminosity correlation for the sample of 42 VISIR detections and one additional object (ESO 428-G014, “C” with both a box and a circle around it, Gandhi et al., 2009). The sources classified as being “well-resolved” are circled, and the diagonal dashed line is the fitted correlation. The dotted grey line is the correlation fit to all 42 sources.
power-law component (1–10 keV) are variable. In radio-quiet AGN, the X-ray variability results from the emission from the innermost region of accretion disk. In the innermost region, hot optically thin plasma surrounding and/or mixed with the optically thick plasma gives rise to the X-ray emission. However, the origin of the soft X-ray emission in the reprocessing model is not established. An attractive possibility is that the soft excess is due to reprocessing of the Comptonized emission into thermal radiation. This clearly has strong implications on the expected correlation of variability in different bands.
The UV/optical continuum variability seems to be correlated with the X-ray variability with little time delay. This means that the UV/optical emission may be due to the reprocessing of the X-ray emission from the central source. Some models explain that the UV/optical flux is emitted by an optically thick medium (i.e., accretion disk) irradiated by the variable central X-ray source (Haardt & Maraschi, 1993).
On the other hand, IR variations have smaller amplitude and longer time scale than that in UV/optical bands (Neugebauer et al., 1989; Hunt et al., 1994). In near-IR band, variations with time scales on the order of years are seen in the radio-loud quasars, whose amplitude is less than 1 mag. Variations of Seyfert 1s and quasars of 226 samples were studied in near-IR for a time scale of a few years (Enya et al., 2002a,b,c). About a half of the sources showed significant variations. They argued that near-IR variability of the radio-quiet AGN is consistent with a simple dust reverberation, but that of radio-loud AGN may require a non-thermal variable component. Unfortunately, in the mid-IR band, there is no strong and rapid variation than X-ray and UV/optical emissions. A few sources show variability on timescale of a year, whose
1.7. AIMS OF THE PHD THESIS 11 average variation reaches ∼10% at 10 µm (Gorjian et al., 2004). Long-term monitoring of 25 quasars for several decades at near- and mid-IR showed that several radio-loud sources displayed significant variability at 10 µm band suggestive of non-thermal origin (Neugebauer & Matthews, 1999). The IR continuum shows a significant time delay compared to variations of UV/optical continuum. The delay is explained by thermal radiation from dust lying at ∼1 light-year from UV/optical energetic source (Clavel et al., 1989). Launch of several IR satellites in 2000s enable us to make statistical analysis of variability for large samples of data. KozÃlowski et al. (2010) carried out first systematic mid-IR variability analysis using Spitzer deep-wide field survey of the Bo¨otes field in the NOAO Deep Wide Field Survey. Out of 474,179 sources, which include both galactic and extra-galactic sources, 1.1% of the sources are found to be variable. They estimated about 76% of the sources are AGN. The mid-IR AGN variability was found to be well described by a single power-law structure function. The mean amplitude of variation was
∼0.1 mag at both 3.6 and 4.5 µm on time scale of 2 years.
Radio-loud AGN (i.e., Blazars) exhibit the most rapid and the largest amplitude variations among all the AGN and the variations affect the whole electromagnetic range from the radio to the gamma-ray band (Stein et al., 1976; Angel & Stockman, 1980). The combination of extreme variability and relatively weak spectral features suggests that the continuum is emitted by a relativistic jet close to the line of sight and hence that the observed radiation is strongly amplified by relativistic beaming (Blandford & Ostriker, 1978). Mechanisms for variability involve essentially two possibilities, shock waves moving along the jet and rotation of the beaming cone across the line of sight; both could be relevant at different times or in different objects.
Optical monitoring of AGN has been done for many samples and general properties of vari- ability are studied statistically. However, IR variability data of AGN obtained so far are far less than that of optical.
1.7 Aims of the PhD Thesis
Main goal of this thesis is to study the nature and geometry of the nuclear emission region based upon unbiased survey data gathered from multiple wavebands. For this purpose, I take two approaches; one is to explore the correlation between the hard X-ray and IR luminosities using unbiased samples systematically for each AGN type. The other is to analyze variability of mid-IR emission both for individual sources and for each type of AGN statistically using two all-sky survey catalogs. This is the first large-scale systematic studies of AGN variability in mid-IR in time scales of several years. Because of the large sample, it becomes possible to study variability separately for each type of AGN.
Previous works are based on small and incomplete samples, with selection criteria biased toward bright sources visible in the mid-IR from the ground or sources in which the intrinsic soft X-ray power could be determined. Furthermore, it is difficult to determine unabsorbed fluxes from the data only below 10 keV, and to separate various emission components through detailed modeling of the spectrum (e.g., power law, obscuration, scattering, non-thermal emission of relativistic jets in case of the radio-loud sources, and thermal emission of hot gaseous interstellar
medium). Recently, new information becomes available in the hard X-ray band above 10 keV, which reflect intrinsic luminosity of the source.
In the IR band, high angular resolution is believed to be crucial in order to properly separate AGN from stellar emission of the host galaxy (e.g., Gandhi et al., 2009; Horst et al., 2009; Vasudevan et al., 2010; Mullaney et al., 2011). Recent all-sky surveys in IR band have reached sensitivity several times higher than the previous survey.
This paper is organized as follows. In section 2, I describe details of the sample selection and catalog cross matching with Swift/BAT and AKARI all-sky surveys. I show the main results obtained from the hard X-ray and IR luminosity correlation. In section 3, I explain details of analyses of variability in the mid-IR band with AKARI and WISE all-sky surveys. I try to treat both the statistical and systematic errors accurately to evaluate variability of sample AGN. In section 4, I discuss the nature and geometry of AGN inferred from the correlation and variability studies. Section 5 describes the main conclusions.
Chapter 2
Infrared and hard X-ray correlations
of AGN from Swift/BAT and AKARI
all-sky survey
2.1 Introduction
I use the Swift/Burst Alert Telescope (BAT) hard X-ray (> 10 keV) survey as the base AGN selection catalog. The hard X-ray energy band is rather insensitive to the intervening column density up to mildly CT columns. The survey reflects the intrinsic luminosity of the source and provides samples largely unbiased by obscuration. I use the Swift/BAT 22-month Source Catalog herein (Tueller et al., 2010). The AKARI survey thus provides the best IR sample for cross-correlation with Swift AGN. High angular resolution is crucial in order to properly separate AGN from stellar emission in the IR band (e.g., Gandhi et al., 2009; Horst et al., 2009; Vasudevan et al., 2010; Mullaney et al., 2011). For many years, IRAS provided the most complete all-sky survey (Joint Iras Science, 1994), but with an angular resolution only of order arcmins. The AKARI satellite (Murakami et al., 2007) has now completed its all-sky survey which is several times more sensitive than IRAS, and at a much higher angular resolution of order arcsecs, (7′′ and 48′′ for the mid- and far-IR instruments, respectively).
This work is closely related to that of Ichikawa et al. (2012), in which the relation between the IR/X-ray spectra of Seyferts and new type AGN are studied by using the Swift/BAT 9- month AGN Catalog (Tueller et al., 2008) and the AKARI/PSC complemented by those with IRASand WISE to ensure high completeness of cross identification. The larger 22-month BAT sample used as the starting catalog for the present work includes several heavily CT AGN and radio-loud (RL) sources, and I can compare the regions occupied by these various AGN classes in the luminosity correlation plane. I also provide detailed statistical tests and correlation fits, and construct AGN photometric classification plots.
13
2.2 Observation and Data Selection
I used the following two all-sky survey catalogs to study the correlation in a complete, flux- limited sample and examine the luminosity correlation between the observed IR and hard X-ray bands of local AGN (z < 0.1); the Swift/BAT 22-month Source Catalog and the AKARI/PSC.
2.2.1 The Swift/BAT 22-month Source Catalog
The prime objective of the Swift/BAT is the study of gamma-ray bursts, covering the hard X-ray band of 14–195 keV. In the 22-month BAT catalog, the total source count is 461 (above a significance of 4.8σ), of which 268 (58%) are AGN. The catalog includes source information of optical counterpart position, X-ray flux, flux error, luminosity, redshift, and AGN type. I adopted the position of the optical counterpart as the source position. The counterpart position error is usually less than 4′′. The detection limit of the catalog is 2.3× 10⁻¹¹ erg cm−2s−1 (for 50% sky coverage). The faintest source included in the catalog has F14−195 keV= 0.28×10⁻¹¹erg cm−2s−1. Although progressively-deeper BAT catalogs are becoming available (e.g., Cusumano et al., 2010), the flux limit of the AKARI all sky survey is well-matched for detection of a large fraction of the 22-month X-ray catalog in the infrared, as I show below. Thus, I have restricted ourselves to the 22-month sample for AGN analysis in the present work.
The Swift/BAT survey produces a long-term average flux, so variability is expected to be partially smoothed over, as compared to large stochastic fluctuations on weekly or monthly timescales. I defined a minimum flux error of 10%, in order to account for low-order long term variations.
I adopted the spectroscopic AGN types from the BAT catalog for most sources, but for some AGN I checked other works because these source classifications are ambiguous [NGC 235A, NGC 612, ESO 549-G049, NGC 3998, WKK 1263, 4C 50.55, and 3C 445, V´eron-Cetty & V´eron (2010); NGC 4945, Moorwood et al. (1996); NGC 4992, Bodaghee et al. (2007); Circinus Galaxy, Matt et al. (2000); 3C 345, Unwin et al. (1997)]. I excluded AGN defined as ‘confused and confusing with nearby sources’ in the BAT catalog. Finally, I identified all radio-loud AGN in the combined sample, including type 1 objects such as broad-line radio galaxies and blazars correctly recognized in the BAT classification, and also type 2 sources including narrow-line radio galaxies and low-power FR I radio galaxies which in the BAT catalog are classified simply as Seyfert galaxies (or LINERs) based solely on the characteristics of their optical spectra and regardless of their radio properties.
2.2.2 The AKARI Point Source Catalogue
I use data available in the AKARI Point Source Catalogs (AKARI/PSC; Ishihara et al., 2010; Yamamura et al., 2010) over a range of wavelengths from 9–160 µm. AKARI has two instru- ments; the Infrared Camera (IRC) and the Far-infrared Surveyor (FIS). The IRC band centers are 9 and 18 µm, and the FIS band centers are 65, 90, 140, and 160 µm. The AKARI/PSC con- tains the positions and fluxes of 870,973 (IRC) and 427,071 (FIS) sources. In the AKARI/PSC,
2.2. OBSERVATION AND DATA SELECTION 15 the IRC 80% flux completeness limits are 0.12 and 0.22 Jy, respectively. Also, the FIS 80% completeness corresponds to 3.3, 0.43, 3.6, and 8.2 Jy, respectively. The FIS may be incomplete or show a larger flux error due to detector saturation for sources brighter than∼100 Jy. The an- gular resolution is 7′′(IRC) and 48′′(FIS), respectively. Although AKARI’s angular resolution is lower than large ground telescopes (e.g., the diffraction limit of the Very Large Telescope/VISIR
∼0.3′′ in the N-band), our study has the capability of probing predominantly nuclear emission in the mid-IR (in addition to hard X-rays). This is because torus emission typically dominates over nuclear stellar emission in AGN host galaxies in the wavelength regime of 10–20 µm (e.g., Mor et al., 2009).
In the AKARI/PSC, there is a quality flag, FQUAL, par band. This flag is a four-level (3-0) flux quality indicator, and the AKARI team recommends using only sources with FQUAL = 3 for secure scientific analysis. Although sources with FQUAL = 2 or 1 may have flux values reported (Yamamura et al., 2010), I used only sources that are confirmed and described by the quality flag FQUAL= 3, indicating high reliability of detection and flux accuracy.
Figure 2.1: Diagram showing the AKARI flight system.
2.2.3 Source identification
I searched for IR counterparts within a 10′′ radius for the IRC, and 20′′ radius for the FIS around the position of every optical counterpart listed in the BAT catalog using the AKARI Catalog Archive Server (CAS; Yamauchi et al., 2011), which provides user interfaces to search and obtain AKARI/PSC information. I adopted these search radii based upon the∼3σ position uncertainties for each of the AKARI/PSC.
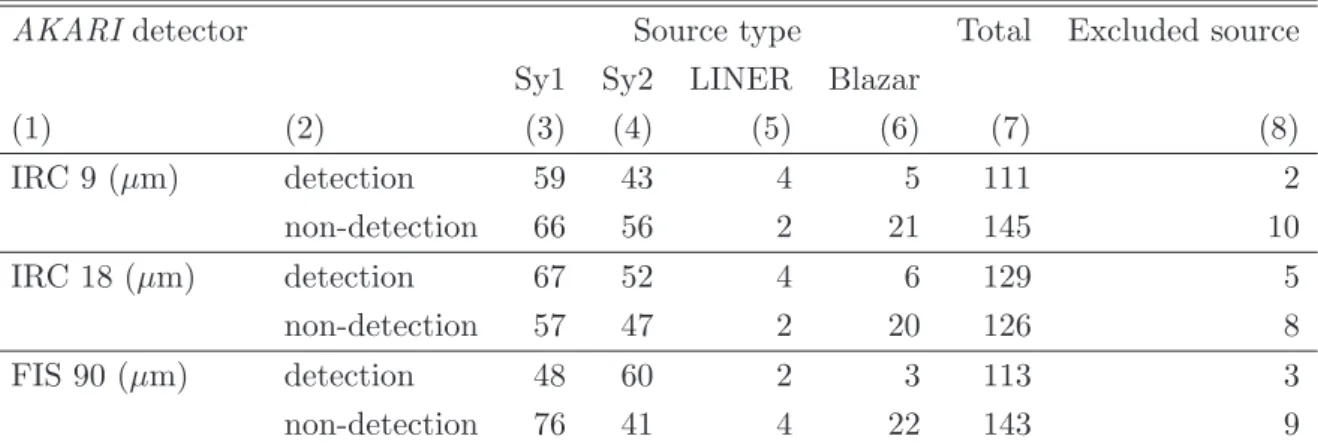
I concentrated on three AKARI IR bands (9, 18, and 90 µm) throughout this paper because other FIS bands have poorer sensitivities. I summarized the selected source parameters (name, IR fluxes, X-ray luminosity, redshift, AGN type) in Table 2.1. Additionally, I summarized the total sample statistics for the three AKARI bands in Table 2.2. For the 268 AGN included in
the BAT catalog, 158 AGN (∼59%) are detected in at least one of the IRC and FIS bands (111 in 9 µm; 129 in 18 µm; 113 in 90 µm). These 158 AGN are classified into 81 Seyfert 1 (Sy 1) type AGN (∼51%, including Seyfert 1, 1.2, and 1.5), 67 Seyfert 2 (Sy 2) type AGN (∼42%, including Seyfert 1.8, 1.9, and 2), 4 Low-ionization nuclear emission-line regions (LINERs; ∼3%), and 6 blazars (∼4%). Four blazars are flat-spectrum radio quasars (FSRQs), and two are BL Lac objects.
For the purpose of investigating the IR vs. hard X-ray luminosity correlation for various classes of objects, I divide our sample into the following ten categories:
1. “All”
2. “All, ex CT” 3. “Sy 1”
4. “Sy 1, ex RL” 5. “Sy 2”
6. “Sy 2, ex CT” 7. “CT”
8. “RL” 9. “Blazar”
10. “RL + Blazar”.
“All” contains all sources detected by the AKARI and Swift/BAT. “All, ex CT” excludes CT AGN from “All”. “CT” is defined as sources obscured by a gas column density NH ≥ 1.5× 1024cm−2 as measured from X-ray spectroscopy. “Sy 1” combines type 1 AGN including radio-quiet objects (Seyferts) and radio-loud sources such as broad-line radio galaxies (BLRGs) and quasars. “Sy 1, ex RL” excludes RL AGN from “Sy 1”. “Sy 2” combines type 2 AGN including CT objects, radio quiet Seyferts, and radio-loud sources such as narrow-line radio galaxies and low-power FR I radio galaxies. “Sy 2, ex CT” excludes CT AGN from “Sy 2”.
“RL” combines all radio-loud AGN in the sample except of blazars, i.e., all radio galaxies of different morphological and spectral types. “Blazar” combines FSRQs and BL Lacs. Finally,
“RL + Blazar” merges the two radio loud subsamples.
The criterion of classification as a RL (non-blazar) AGN is that the radio luminosity density at 5 GHz is at least 1032 erg s−1 Hz−1 and the radio to optical B-band flux density ratio (RB) satisfies log RB≥ 1 (Kellermann et al., 1989; Xu et al., 1999; Molina et al., 2008). RL objects are identified in the final column of Table 2.1. This list includes 3C and 4C sources from the Cambridge catalogs of radio galaxies, as well as other famous RL sources such as Cen A.
A few additional objects were also identified as RL based on a detailed inspection of the available data and literature. NGC 1052 is a Gigahertz-peaked spectrum (GPS) source, with a spectral peak at 10 GHz (Vermeulen et al., 2003). Although the 5 GHz power is lower than the RL classification threshold, this source displays strong parsec-scale radio emission probably related to newly born jets, and is classified as RL. [HB89]1821+643 is a peculiar radio source, lying at the boundary of the radio-quiet/radio-loud divide (Blundell & Rawlings, 2001). The source is a highly luminous quasar in X-rays (LX > 1× 1047 erg s−1; Russell et al., 2010) and lies at the center of a massive galaxy cluster. It shows an FR I like radio morphology
2.3. ANALYSIS AND RESULTS 17 (Blundell & Rawlings, 2001). As I discuss below, the AKARI observations now show that the IR properties of [HB89]1821+643 are consistent with other RL sources, so I include it within the RL classification herein, as a radio-intermediate (RIM) object. Similarly, two other RIM sources are [HB89]0241+622 (Molina et al., 2008) and Mrk 1501 (Barvainis et al., 2005).
There are several narrow-line Seyfert 1s (NLS1s) in the sample, but these are not distin- guishable from the other Seyferts so I do not treat them separately.
2.3 Analysis and Results
2.3.1 Redshift, Flux distribution and Completeness
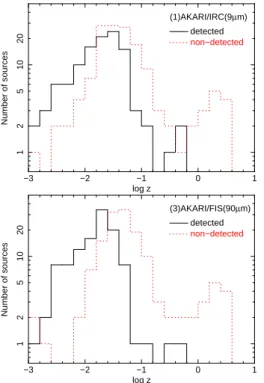
Figure 2.2 shows redshift distribution of the Swift/BAT AGN, split into the classes of AKARI- detected or non-detected objects. The median redshift of the detected sources (zmed) is≈ 0.0222, so most are local AGN. There are only 8/158 sources (5%) with z > 0.1. The detected source with the maximum redshift is 3C 454.3 (zmax ≈ 0.8590). The low-z population is dominated by “regular” (radio-quiet) Seyferts, while the high-z population is made mostly from radio- loud AGN (blazars, luminous radio galaxies). The zmed for those not detected in any band is zmed ≈ 0.0517.
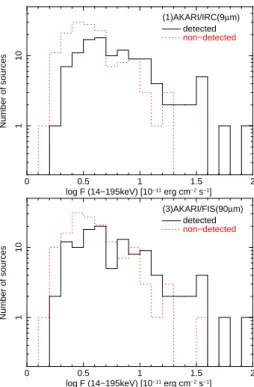
Figure 2.3 shows hard X-ray flux distribution of the Swift/BAT AGN. The X-ray fluxes of the AKARI detected sources are higher than the non-detected sources on average. The median X-ray fluxes of the AKARI detected/non-detected sources are 5.07/3.38, 4.70/3.36, and 4.70/3.45 × 10−11 erg cm−2 s−1 in 9, 18, and 90 µm, respectively.
Our cross-correlation between the all-sky X-ray and IR samples is about 60% complete, with the X-ray sources non-detected in the IR being fainter than the detected ones, on average. It has been shown by Ichikawa et al. (2012) that supplementing the AKARI data with the deeper WISE samples maintains the luminosity correlation. Overall, none of the statistical inferences presented in the sections below should be affected by incompleteness of the cross-matching.
2.3.2 Hard X-ray to IR luminosity correlation
Figure 2.4 shows the luminosity correlation for the detected sources between hard X-ray (14– 195 keV) and IR (9, 18, and 90 µm) bands. I find that there is a strong linear correlation for most AGN between the logarithms of the observed IR and hard X-ray luminosities over four orders of magnitude. Here, I calculated the absolute luminosities by using the redshift listed in the BAT catalog (Tueller et al., 2010). In principle, K-correction may become important for high-z objects, e.g., blazars. Our samples are mainly local AGN, but blazars (z = 0.0533–0.8590) are also included. If I apply K-correction to AGN at z∼0.9, the maximum effect for LXis∼10% assuming a power law spectrum with a photon index of Γ∼1.9, which is a typical value for the majority of AGN in our sample. This is a small effect especially when comparing logarithmic luminosities, so I did not apply any K-corrections.
I tested the luminosity correlation by using the algorithm of Isobe et al. (1990), which is used when the nature of the scatter of points in a correlation is ill understood. I computed the linear
−3 −2 −1 0 1
1102520
Number of sources
log z
(1)AKARI/IRC(9µm) detected non−detected
−3 −2 −1 0 1
1102520
Number of sources
log z
(2)AKARI/IRC(18µm) detected non−detected
−3 −2 −1 0 1
1102520
Number of sources
log z
(3)AKARI/FIS(90µm) detected non−detected
Figure 2.2: Redshift distribution of all AGN detected in the Swift/BAT. The values of redshift were taken from those listed in the 22-month Swift/BAT hard X-ray survey catalogue (Tueller et al., 2010). The abscissas are logarithmic redshift. The ordinates are total number of sources. Black solid lines show the AKARI detected sources (AKARI/PSC; FQUAL = 3 only), while red dotted lines show the sources not listed in the AKARI/PSC.
regression coefficients by one of the methods of the algorithm, “OLS bisector”, recommended if the goal is to determine the functional relation between the two axes. The formula is given by
log LIR= a + b log LX, (2.1)
where LIR and LX are observed luminosities in IR (9, 18, and 90 µm) and hard X-ray (14– 195 keV). The variables a and b are the intercept and slope of the fitting result, respectively. At 9 µm, the luminosity correlation of the subsample “Sy 1” is described as
log( λL9µm 1043 erg s−1
) = (0.15± 0.05)
+(0.94± 0.06) log( LX 1043 erg s−1
)
. (2.2)
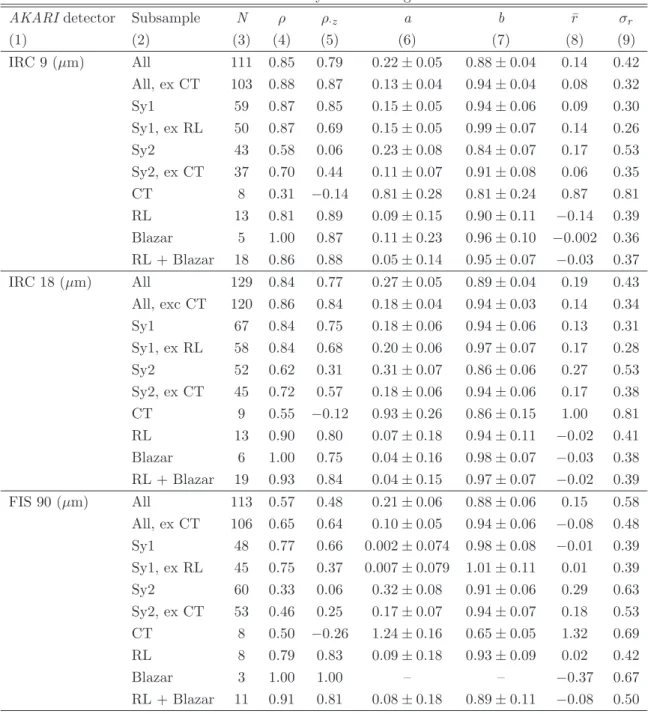
The fit parameters for other bands are listed in Table 2.3, and are plotted in Figure 2.4 along with the 1σ and 2σ uncertainties on the correlation normalization. Also, I summarize the fitting results with respect to various subsamples in Table 2.3.
I checked two correlation coefficients for every subsample, the Spearman’s Rank correlation coefficient (ρ) and the partial correlation coefficient (ρ·z). The ρ and ρ·z correlation tests return values in the interval [-1.0, 1.0]. The ρ·z statistic is especially important because artificial correlations between luminosities may be induced in a flux limited-sample even in the absence of any intrinsic correlation, but the partial correlation coefficient can account for this by excluding
2.3. ANALYSIS AND RESULTS 19
0 0.5 1 1.5 2
110
Number of sources
log F (14−195keV) [10−11 erg cm−2 s−1] (1)AKARI/IRC(9µm)
detected non−detected
0 0.5 1 1.5 2
110
Number of sources
log F (14−195keV) [10−11 erg cm−2 s−1] (2)AKARI/IRC(18µm)
detected non−detected
0 0.5 1 1.5 2
110
Number of sources
log F (14−195keV) [10−11 erg cm−2 s−1] (3)AKARI/FIS(90µm)
detected non−detected
Figure 2.3: Hard X-ray flux distribution for the Swift/BAT sources. The abscissa is logarithmic hard X-ray flux. The ordinate is the number of sources. Black solid lines show the AKARI detected sources, while red dotted lines show those are not detected by AKARI in 3σ.
the effect of redshift. A large value implies a significant positive, linear correlation. These test coefficients values are also listed in Table 2.3.
“Blazar” and “RL + Blazar” typically show very high values of ρ and ρ·z in all three AKARI bands. But only a handful of objects included in both subsamples are among the most luminous and distant sources in the entire sample considered, so the correlation results for these may be biased by small number statistics and flux limits. The ρ and ρ·z = 1 values in these cases must be treated with caution. The other subsamples with the highest values of ρ and ρ·z are the
“Sy 1” and “All, ex CT” subsamples. “Sy 2” also show a correlation, if CT sources are excluded, though somewhat weaker than “Sy 1”. CT sources will be discussed separately in section 4.1.2. The correlation coefficients generally decrease towards longer IR wavelengths.