Core-Based Testing of Multiprocessor System-on-Chips Utilizing Hierarchical
Functional Buses
Fawnizu Azmadi Hussin1, Tomokazu Yoneda1, Alex Orailoglu2, and Hideo Fujiwara1
1Graduate School of Information Science Nara Institute of Science and Technology Kansai Science City, 630-0192, Japan {fawniz-h, yoneda, fujiwara}@is.naist.jp
2Computer Science and Engineering Department University of California, San Diego
La Jolla, CA 92093 [email protected]
Abstract—An integrated test scheduling methodology for mul- tiprocessor System-on-Chips (SOC) utilizing the functional buses for test data delivery is described. The proposed methodology handles both flat bus single processor SOC and hierarchical bus multiprocessor SOC. It is based on a resource graph manipulation and a packet-based packet set scheduling methodology. The re- source graph is decomposed into a set of test configuration graphs, which are then used to determine the optimum test configurations and test delivery schedule under a given power constraint. In or- der to validate the effectiveness of the proposed methodology, a number of experiments are run on several modified benchmark circuits. The results clearly underscore the advantages of the pro- posed methodology.
I. INTRODUCTION
SOC design with multiple embedded processors is getting momentum due to the increasingly high demand on processing power. Due to the high bandwidth communication between the multiple embedded processors and the SOC cores, the use of a flat bus is no longer adequate. These recent advancements present new problems as well as opportunities to the test engi- neers in the form of multiple embedded processors and a com- plex network of communication channels between the SOC cores. The abundant resources of a communication network dramatically diminish the benefits of introducing extraneous Test Access Mechanism (TAM) for test purposes. Hence the use of functional on-chip resources for test purposes is more practical and more economical.
Amongst the earliest literature on the utilization of the func- tional interconnects for core-based testing of SOCs stands out the paper by Papachristou et al. in 1999 [1], in which, an embedded microprocessor is used as the test controller. The test data from an external tester are loaded into the embedded memories through a direct memory access controller (DMA) and delivered to the core under test by the embedded proces- sor through the functional interconnect. The test responses are evaluated by embedded signature analyzers.
A more comprehensive methodology on the functional bus based SOC testing was discussed by Harrod [2]. The paper presented a test application strategy for various types of test requirements for the embedded Intellectual Property (IP) cores. Test access to the Core-Under-Test (CUT) is provided by the Test Interface Controller (TIC), which is part of the AMBA [3] specifications. An external ATE is used to deliver the test vectors through the TIC interface. At each core, a test wrapper
is required to isolate the core from the surrounding logic. Krstic et al. [4] presented a similar test methodology, where the embedded processor first tests itself by executing a set of instructions using a software-based self test (SBST) method- ology [5, 6]. Subsequently, the processor tests the bus and the other IP cores. Huang et al. [7] presented a similar core- based test approach for PCI bus based SOCs. The test applica- tion is performed by the test support architecture at every core. The test patterns for each core under test are generated using software-based weighted random patterns [8]. Nahvi et al. [9] proposed a TAM architecture based on a packet switching com- munication network, called NIMA. NIMA provides access to the cores for test data delivery by means of multi-level routers and communication channels similar to the bus-based TAMs.
Larsson et al. [10] proposed a buffer-based test support architecture to enable parallel testing of core-based SOCs. As opposed to the embedded processor-based approach by [1, 4, 7], the test control is performed by an embedded finite state machine based controller which requires additional hard- ware overhead, proportional to the volume of the test data.
Our group recently [11] proposed a buffer-based test archi- tecture similar to [10] for core-based test application utilizing the embedded processor and the functional bus. The test ap- plication time is minimized by optimizing the bus sharing be- tween multiple CUTs using a novel scheduling methodology called PAcket Set Scheduling (PASS). The applicability of the proposed methodology is, however, limited to flat bus and sin- gle processor SOC architectures.
In this paper, our Integrated PAcket Set Scheduling (IPASS) methodology targeting the hierarchical bus based multiproces- sor SOCs is described. Scheduling core tests for a hierarchical bus and multiprocessor SOC involves the tasks of distributing the core tests to multiple processors, and allocating the time slots on the shared functional buses for the delivery of the test data to each CUT. The proposed power-constrained and Mul- tiProcessor PAcket Set Scheduling (MPPASS)methodologies address the above issues in order to produce an efficient test data delivery schedule.
II. SCOPE ANDPROBLEMFORMULATION
The design of a multiprocessor SOC (MPSOC) can be im- plemented using a wide range of architectures [12, 13, 14], de- pending on the exact design specifications. In addition, various test strategies can be adopted for each embedded IP core. In or- der to develop an effective SOC test scheduling methodology,
a constricted scope of SOC architecture and test requirements are considered in this paper.
The proposed test methodology is applicable to the multi- processor SOCs with hierarchical bus architecture like AMBA [3], CoreConnect, and some specialized MPSOC buses [12]. Given (i) a bus-based MPSOC with NP embedded processors, NBbridged buses, and NM IP cores with the corresponding test power information, and (ii) the test requirements for all of the IP cores, find, for each processor, the optimum test delivery schedule (under the constraints of maximum power dissipation, Pmax, and total buffer sizes,Bmax) which utilizes the hierar- chical functional buses under the assumptions that:
• Processors are not the target of testing; all the embedded processors are assumed tested by the SBST methodology [5] prior to the start of core testing.
• Each processor has a fault-free local memory, tested dur- ing the processor testing stage [15].
• The core scan frequency can be less than the maximum scan frequency,fmax.
• Deterministic full-scan tests are used for all CUTs.
• Test data are:
– loaded into the corresponding memory location be- fore core-testing begins, or
– loaded as they are needed during the test application through DMA [1], or
– generated by the embedded processors using the de- terministic SBST [6].
III. BUFFER-BASEDTESTARCHITECTURE
In [10], the differences between three types of test access ar- chitecture are explained—dedicated TAM, functional bus, and functional bus with buffers similar to Fig. 1, for ann-bit bus and a CUT with m scan chains. The bit-width conversion is achieved by parallel-serial shifting within the buffer, controlled by the test controller [11]. The firstn bits of the core’s pri- mary inputs (PIs) and primary outputs (POs) are connected to the data bus. The remainingu PIs and v POs are connected to other parts of the SOC.
To isolate the cores during testing, each PI/PO is connected to the bus through a boundary cell, similar to IEEE 1500’s [16], which selects either the scan input (dotted line) or the functional input (solid line). The same control signal (T/N) is used for the boundary cells, the buffers, and the multiplexer to switch between test mode and normal mode. Wrapper scan
Core (CUT)
PI0 PI1 PIn-1 n
PO0PO1 POn-1
POnPOn+1
PIn+1 PIn+u-1
n m
BUS PROTOCOL INTERFACE
OUTPUT BUFFER m
T/N BUFFER CONTROLLER From other cores / PIs
To other cores / POs
n
n
n n INPUT BUFFER
SC1
SC0 SCm-1 FUNCTIONAL BUS
Boundary cell
n PIn n
POn+v-1
Fig. 1.Core test architecture
Buffer A
Functional Bus
Stage 1
Stage 2 Stage 1 Stage 2
Buffer B
BusInterface Bus Interface
Core A
Boundary scan cells
Core B
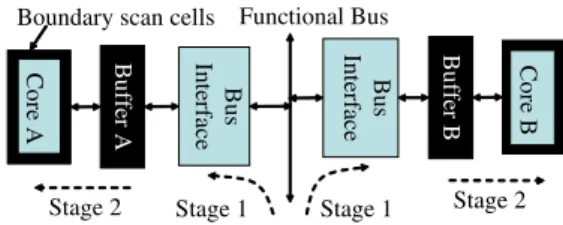
Fig. 2.Buffer-based test architecture
chains with equal scan-in/scan-out depths are formed by cas- cading PIs and POs to the internal scan chains (Fig. 1). Com- pared to a TAM-based architecture which utilizes the IEEE 1500 wrapper, the proposed buffer architecture incurs a single additional multiplexer delay overhead on the functional output path.
During the test application, the test data are delivered through the functional bus to the input buffer. Regardless of the data format on the bus, after passing through the functional bus protocol interface, decoded bit-level data is transferred to the input buffer. Test data decoding is handled by the existing functional interface. The dotted line shows the path taken by the test data from the input buffer into the scan chains. At the same time, the test responses are scanned out of the scan chains into the output buffer. The test responses are then read by the processor for analysis.
The introduction of buffers enables the test application to be scheduled concurrently [10, 11]. Figure 2 shows the simplified representation of the buffer architecture for two CUTs. The test data are delivered by an embedded processor to buffersA andB alternately in stage 1 (data delivery stage). In stage 2, the test data in the respective buffers are loaded into the scan chains (test application stage) of cores A and B simultane- ously. Figure 3 shows the timing diagram of the data delivery on the functional bus (labeled Bus) and the test application at each core (labeled Core A and Core B).
IV. TESTSCHEDULINGMETHODOLOGY
In this section, the scheduling methodology which con- sists of the resource graph manipulation, the power-constrained scheduling, and the multiprocessor packet set scheduling is ex- plained. The packet set scheduling methodology [11], which is targeted for flat bus and single processor architectures, is also described in order to complete the flow of the algorithm de- scription.
A. Test Configuration Graph (TCG)
Figure 4 shows a resource graph [17] for the MPSOC in Fig. 5 consisting of two processorsP0and P1, two busesb0
andb1(interfaced by a bridgeB), and (j + k) cores. Access to the buses is regulated by the arbitersAi. The resource graph
Bus Core A Core B
Stage 1 Stage 2 Time
Fig. 3.Concurrent test application
P0
C1 C2 b0
b1∧ b0
Cj
P1
Cj+1 Cj+2 Cj+k b1 b0∧ b1
Fig. 4.MPSOC resource graph P0 C1 C2
b0
Cj P1
b1
Cj+1 Cj+2 Cj+k
A0 B A1
Fig. 5.Hierarchical bus based MPSOC
provides information about processor-core connectivity. For example, coresC1toCj are connected to busb0and can be reached byP0 directly. The cores can also be reached byP1
through a bus hierarchyb1∧b0. The AND operator (∧) indi- cates that data delivery passes through a bridge.
Definition: A test configuration graph (TCG) is a processor [test source] - core [test sink] pair that specifies the delivery path on the functional bus(es) for test data delivery.
Figure 6 shows five types of basic TCGs (top half) and their corresponding bus architecture (bottom half). For each TCG, Pq is the test source, andCiandCjare the CUTs. Other sec- ondary TCGs can be formed by expanding and merging the primary TCGs. Type IV and Type V are broadcast TCGs when CiandCjare identical cores with identical test requirements. For example, the resource graph in Fig. 4 can be decomposed into2 × (j + k) TCGs of Type I and Type II.
B. Power-Constrained Scheduling
Power constrained scheduling for core tests are performed using various methods, which include preemptive [17], 2D [18], and 3D bin packing [19] algorithms. The resulting test schedule is typically similar to Fig. 7(a). When we consider packet-based test delivery utilizing the functional bus (similar to Fig. 3), five distinct delivery patterns are required for every combination of cores tested concurrently for the schedule in Fig. 7(a). This is because at timet0,C1andC2are scheduled. Att1, the test application ofC2is completed andC3is started. The schedule change also takes place att2andt3. The more frequent the schedule changes, the higher the complexity of the test program. To avoid the additional complexity, the cores are
bu
bu Pq
Ci
bu∧ bv bu∨ bv
Pq bv bu
B
Ci Ci
Pq Pq
Pq
Ci
bu Pq
Ci bv
Ci
(II) (III)
Ci Pq bu bu
Cj
bu Pq
Ci Cj
(IV) Ci
Pq bu bv
Cj
bu Pq
Ci
Cj (V)
bv
(I)
Fig. 6.Types of test resource graphs (TCG)
C1 C2
C4 C3 C5
C1
C2 C4 C3 C5
t0 t1 t2t3 t0 t1
Power
Time Pmax
(a) Time (b)
Power
Fig. 7.Power-constrained test group assignment of CUTs
grouped into non-overlapping test groups as in Fig. 7(b). The scan frequencies forC3andC5are halved, in order to match the test application time (TAT) of coreC1[11].
Figure 8 shows the power constrained scheduling, in which the test groups are formed. In step (1) of FormTestGroups, re- dundant TCGs are eliminated. A TCG of coreCiis said to be redundantif the set of buses in the TCG is a complete superset of another TCG ofCi. For example, in Fig. 6, the Type II TCG is a redundant TCG (relative to Type I) forCibecause the set {bu,bv} is a complete superset of {bu}. The redundant TCGs are eliminated from the list of candidate TCGs ofCibecause their delivery costs are always greater and unnecessary.
When forming the test groups, the core with the largest TAT amongst the remaining unscheduled cores is first scheduled to the group and assigned the maximum scan frequency, fmax. The TAT (atfmax) of the remaining unscheduled cores is less than the TAT of the first core in the test group. When schedul- ing the subsequent cores, the core scan frequencies are reas- signed (step 4c) to the highest frequency less thanfmaxsuch that the TAT of the new group member is less than or equal to the TAT of the first member of the group. The choices of fre- quency values are constrained by the maximum scan frequency, fmax, and the resolution of the frequency divider [11].
In step 4a of FormTestGroups, for each TCG ofCi, the max- imum resulting bus utilization of all buses in the TCG is deter- mined. The TCG which results in the minimum of the max- imum total bus utilization is chosen. Step 4 seeks to evenly distribute the bus utilization. This is achieved by dynamically selecting the best TCG for each core during scheduling based on the current bus utilization by other cores.
Function: FormTestGroups
1. For each Ci, eliminate all redundant TCGs 2. Set the total power, Ptotal= 0 for current group
3. Amongst unscheduled cores, select a core with maximum TAT and not yet attempted for scheduling in current group 4. For the currently selected Ci
(a) If Cihas multiple TCGs, select the TCG which results in min{max{bus utilization of all buses in TCG}} (b) If Cihas unique TCG, schedule Ciin current group if
• at least one of the buses in TCG has minimum uti- lization, and
• Ptotal≤ Pmaxafter scheduling Ci
(c) If Ciis scheduled,
• reassign the scan frequency for Ci
• update Ptotaland bus utilization of current group (d) If Cicannot be scheduled,
• if all cores are attempted in the current group, cre- ate a new group and go to step (2)
• else, go to step (3)
Note: Ci≡ Ciand all broadcast pairs (if any) sharing a TCG
Fig. 8.Assigning cores to test groups
Core A Core B
Stage 1
Stage 2 Time
Core C Bus
Fig. 9.Variable packet sizes
C. Packet Set Scheduling (PASS) [11]
The main objective of PASS methodology [11] is to find, for a processor, a repetitive delivery sequence and the correspond- ing packet sizes for each core (for a given maximum total buffer size) that minimize the test application time. The limitation of such a cyclic delivery sequence is that the job of all members in the repetitive group must be completed before the next (identi- cal) job can be started. In other words, if there is one member of the group who is late in completing the current job, all other members stall while waiting for the slowest member to com- plete, prior to initiating a new group delivery sequence.
In the scan-based testing perspective, the cores with the smaller number of scan chains (Ns) or those tested at lower scan frequency (fs) take longer time to complete, for the same amount of test data. Therefore, cores with largerNs×fs re- quire a larger test packet (therefore, larger buffer) in order for the test application of each packet of each core to have equal scan time (Stage 2) as shown in Fig. 9. Equal scan time is nec- essary to avoid stalling.
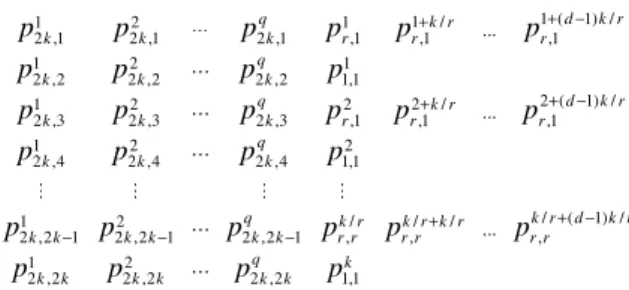
To reduce the total buffer size required, the packet size for core B can be halved and the delivery sequence changed from A-B-C (Fig. 9) to B-A-B-C (Fig. 10). Both figures show three repetitions of the smallest subset of delivery sequence, called packet set. In Fig. 10, cores A and C are said to belong to the split-1group because only one packet is delivered in the packet set. Similarly, core B is said to belong to the split-2 group [11]. If three different split groups are used, the delivery sequence (or packet set schedule, PASS) can be specified as in Fig. 11, for k, d × k/r, and q cores assigned to split-1, split-r, and split-2k respectively. Each entry represents a time slot on the bus allocated for the delivery of packetpgi,j, where
g = module number (1 to n) from split-i group i = split group to which module g belongs
j = packet sequence number for module g, and j ≤ i D. Optimizing PASS for Hierarchical Bus MPSOC (MPPASS)
The delivery sequence specified by Fig. 11 is optimized for a flat-bus architecture. For a hierarchical bus, the delivery time of some packets may be longer than others. Strictly follow- ing the delivery sequence in Fig. 11 may result in stalling the delivery of some packets, as shown in [11]. Due to the bus con- tention and the store-and-forward operation by the bridges, the completion time of a packet delivery cannot be independently
Core B Core A
Stage 1
Time Core C
Bus
Stage 2
Fig. 10.Improved delivery sequence for packet size minimization
1 ( 1) / 1 /
1 2 1
2 ,1 2 ,1 2 ,1 ,1 ,1 ,1
1 2 1
2 ,2 2 ,2 2 ,2 1,1
2 ( 1) / 2 /
1 2 2
2 ,3 2 ,3 2 ,3 ,1 ,1 ,1
1 2 2
2 ,4 2 ,4 2 ,4 1,1
/ / /
1 2
2 ,2 1 2 ,2 1 2 ,2 1 , ,
...
...
..
q k r d k r
k k k r r r
q
k k k
q k r d k r
k k k r r r
q
k k k
q k r k r k r
k k k k k k r r r r
p p p p p p
p p p p
p p p p p p
p p p p
p p p p p
+ − +
+ − +
+
− − −
/ ( 1) / ,
1 2
2 ,2 2 ,2 2 ,2 1,1
. r rk r d k r
q k
k k k k k k
p
p p p p
+ −
Fig. 11.Packet delivery sequence for three split groups [11]
calculated without considering the events on other processors and bridges. Fig. 12 shows the possible contention scenario on busb1between data packets originating from processors on busesb0andb2.
The delivery sequence of Fig. 11 only requires that, for each time slot, the packet belong to a specific split group, not a spe- cific module. For example, the delivery sequence of B-A-B-C (Fig. 10) can as well be changed to B-C-B-A without affecting the scan in operation at each core.
The flowchart in Fig. 13 shows the process of determining the best PASS (i.e. B-A-B-C or B-C-B-A) for a hierarchical MPSOC by simulating all delivery sequences that do not vio- late the group delivery sequence in Fig. 11 as specified by the index i in each pgi,j. The PASS can be formed by randomly permuting the delivery ordering within each split group. For every permutation of PASS, the test application is simulated (explained in Sect. V). If the new PASS returns a smaller TAT, it is recorded as the current best PASS.
In order to minimize the simulation time, each PASS is sim- ulated only forw packet sets (i.e. w repetitions of B-A-B-C). Furthermore, ifNP ASS,maxconsecutive PASS is tried without any improvement, the simulation is stopped, and the current best PASS is returned. The value ofw is chosen under the as- sumption that the interaction between the data packets is cyclic after several repetitions of packet set delivery. The values for w and NP ASS,maxof 5 and 10, respectively, were used for the results presented in Sect. VI.
V. SIMULATING THETESTAPPLICATION
In order to determine the test application time for each PASS, an event-driven MPSOC simulation environment (Fig. 14) was implemented in C++ under the following constraints:
• The delivery sequence by each processor follows the PASS repeatedly. A new test packet for coreCiis deliv- ered by the processor only when the test response of the previous packet ofCiis received.
• Bus arbitration follows the functional arbitration scheme.
• Every event requires a separate bus arbitration.
In Fig. 14, the middle (shaded) blocks are the main simula- tion engine, which keeps track of the simulation time and pro-
b0 b1 b2
Time Arbitration delay
Fig. 12.Bus contention in an MPSOC
START
If(newTATPS< bestTATPS) , bestTATPS= newTATPS bestPASS = newPASS Else
NPASS++
Return best PASS FINISH
Y N
NPASS= 0 bestTATPS=∞
More PASS? or
•Generate a new PASS not yet simulated
•Simulate for new PASS. newTATPS= total TAT for w
consecutive packet sets NPASS< NPASS,max
Fig. 13.Optimizing the packet delivery sequence (MPPASS)
cesses the events based on their time stamp. The left and right sections show the steps for handling the processor-initiated events and bridge-initiated events respectively. For both types of events, the packets are forwarded to either the next bridge (vector or response packets), directly to the core (vector pack- ets), or back to the processor (response packet). The next desti- nation of each packet is determined by the TCG chosen for the packet owner (the core/CUT).
VI. EXPERIMENTALRESULTS
In order to evaluate the effectiveness of the proposed methodology, we have conducted experiments on several mod- ified ITC’02 benchmark circuits [20]. The power dissipation information for the selected circuit is obtained from [18, 19]1. We have additionally added the functional bus information to the selected circuits as follows:
• A bus b0is added to connect all the cores. A processor core is assumed attached tob0. This modified circuit is named NXh1, where NX is the original circuit name.
• For circuits which have level-2 hierarchy, a single shared busb0is added to connect all the level-1 cores. The def- inition for level is defined in the benchmark suite [20]. Additionally, a local busbiis added within each hierar- chical level-1 core. Busbiis interfaced to busb0through a bridge. This modified circuit is named NXh2.
When comparing the test application time with a TAM-based approach, the processor cores are assumed to be tested using software-based self-test prior to the test application of other
1The unit for maximum power, Pmax, is based on an estimate given by [18]. We utilized the same power values in order to offer a comparison with TAM-based scheduling approaches.
START Init. Processor & Bridge States
GetNextEvent (Next earliest event)
Bridge/Processor Event? Deliver to core and
retrieve response
Core on local bus? Forward to next bridge
Y
N
Schedule next processor event
Processor
Dest. on local bus? Deliver to destination
(retrieve response) Forward to next bridge
Y Schedule next
bridge event
Bridge More events?
Y N END
N
Processor Events Main Simulation Engine Bridge Events Fig. 14.MPSOC event-driven simulation flowchart
TABLE I FLAT BUSSOC (P93791H1)
fb=2*fs fb=2*fs
Pmax Pouget IPASS IPASS Pouget IPASS IPASS 10,000
18.28 18.44 9.04 11.17 8.94 5.34 15,000
18.28 17.34 8.85 10.15 8.85 4.70 20,000
18.28 17.35 8.89 9.58 8.93 4.59 25,000
18.28 17.63 9.07 9.65 9.05 4.75 30,000
18.28 17.78 9.08 9.45 9.07 4.67 BW = 64 fb = fs p93791h1
flat-bus
BW = 32 fb = fs
TABLE II
HIERARCHICAL BUSMPSOC (P93791H2)
Pmax P@b0 P@All P@b0 P@All P@b0 P@All P@b0 P@All
10,000
18.28 26.97 15.51 13.47 7.83 11.17 13.47 7.83 7.13 5.69 15,000
18.28 20.15 9.51 10.07 4.83 10.15 10.07 4.83 5.05 3.79 20,000
18.28 20.39 7.37 10.20 4.27 9.58 10.21 4.23 5.11 3.51 25,000
18.28 18.95 5.31 9.47 3.24 9.65 9.50 3.20 4.72 2.82 30,000
18.28 18.89 5.31 9.44 3.24 9.45 9.44 3.20 4.78 2.82 fb = 2*fs BW = 64
IPASS IPASS IPASS IPASS
Pouget
fb = fs Pouget BW = 32
fb = 2*fs p93791h2
hierarchy fb = fs
non-processor cores. Therefore, the TATs for the processor cores are assumed to be equal for both TAM-based and our IPASS approach. The TAT for the processors is therefore not included in the results presented in this section. IPASS dynam- ically chooses the PASS algorithm [11] for scheduling, when the target system is a single processor SOC with a flat bus ar- chitecture. Alternatively, it will use MPPASS algorithm for multiprocessor SOCs with hierarchical buses.
The following tables show the TATs (in millisecond) when the maximum scan frequency is set tofmax= 100 MHz. TAM- based approaches make use of thefmaxfor all cores. They also disregard the functional buses; their TATs are the same for an SOC with either a flat bus or a hierarchical bus implementation. Table I shows the TAT for a single processor SOC with a flat functional bus and bus widths (BW) of 32 and 64 bits. The test applications are simulated for several values ofPmax. In the table, fb=fs represents the circuit configurations when the maximum scan frequency (fs) and the bus frequency (fb) are set to 100 MHz. The second and fifth columns show the TATs for a TAM-based approach [18]. The third and sixth columns show the results of our IPASS approach. The TATs of our ap- proach and of the TAM-based approach are comparable when the bus frequency is the same as the scan frequency (i.e. same as TAM approach). However, much shorter TATs are achieved when we allow the bus frequency to be higher than the scan frequency, which is not possible for the TAM-based approach, without adding similar buffers, in addition to the TAMs. The fourth and seventh columns (fb=2*fs) illustrate this advantage. In Table II, P@b0 represents a hierarchical bus SOC with one processor. The elevated TATs are due to the hierarchy overhead in the delivery time of each test packet. The effect of hierarchical buses is evident when comparing p93791h1 and p93791h2 since in both cases, there is one test processor on the level-0 bus (b0). In order to show the benefit of using multi- ple processors, we analyzed the best case scenario, where there is a processor in every isolated bus region (P@All). The bus hierarchy allows simultaneous delivery of the test data and re- duces contention on the bus access. For typical MPSOC con- figurations, the TAT is expected to be between the best case (P@All) and the worst case (P@b0). Simulation results for
TABLE III FLAT BUSSOC (P22810H1)
fb=2*fs fb=2*fs
Pmax Pouget IPASS IPASS Pouget IPASS IPASS 3,000
4.83 4.34 3.06 3.09 3.06 2.93 4,000
4.80 4.34 2.93 3.24 2.94 2.65 5,000
4.72 4.53 2.74 3.22 2.74 2.33 6,000
4.76 4.67 2.46 2.50 2.49 1.88 10,000
4.73 4.32 2.21 2.36 2.20 1.36
BW = 64 fs = fb p22810h1
flat-bus
BW = 32 fs = fb
TABLE IV
HIERARCHICAL BUSMPSOC (P22810H2)
Pmax P@b0 P@All P@b0 P@All P@b0 P@All P@b0 P@All
3,000
4.83 4.89 4.23 3.79 3.66 3.09 3.59 3.72 3.54 3.72 4,000
4.80 4.61 3.06 2.65 2.67 3.24 3.16 2.67 3.05 2.67 5,000
4.72 4.81 2.88 2.47 1.87 3.22 2.48 1.87 1.93 1.87 6,000
4.76 4.65 2.96 2.35 1.87 2.50 2.35 1.87 1.68 1.82 10,000
4.73 4.69 2.70 2.30 1.37 2.36 2.37 1.37 1.30 1.33 fb = 2*fs
IPASS BW = 64 IPASS
Pouget
fs = fb Pouget IPASS fb = 2*fs
IPASS p22810h2
hierarchy fs = fb BW = 32
some randomly assigned number and locations of processors demonstrate this expected trend.
Table III and Table IV show the TATs for flat-bus p22810h1 and hierarchical bus p22810h2 SOC, respectively. Similar trends are observed for this circuit. However, smaller variations are observed between P@b0 and P@All because p22810h2 has only three bus regions, as compared to eight bus regions for p93791h2. Correspondingly small variations are also observed between the flat and hierarchical bus SOCs for the same reason. The area overhead of the proposed buffer-based test archi- tecture is estimated in terms of the number of flip-flops for the buffers. The overhead on the controller and the boundary scan cells are comparable to the IEEE 1500 wrapper architecture [11]; therefore, it is not included. For all the circuits in Table I to Table IV, the buffer sizes per core (for BW=32), averaged over allPmax, are shown in Table V.
VII. CONCLUSION
We have proposed a test scheduling methodology for core- based testing of SOCs based on the utilization of the functional buses. The proposed method can handle both flat bus single processor architectures and hierarchical bus multiprocessor ar- chitectures. The bus hierarchy information is efficiently in- corporated into the methodology by representing the resource graph with the test configuration graphs—a concept introduced in this paper.
It was shown that the hierarchical bus architecture introduces a delay overhead in the delivery of a test packet, which pro- longs the overall test application time. Subsequently, the use of multiple processors embedded within the bus hierarchy annuls the negative effects of the hierarchical bus architecture on the overall test application time. Incorporating the bus hierarchy in the test scheduling algorithm is an important step in promoting the use of the functional bus based test methodology.
ACKNOWLEDGEMENTS
This work was supported in part by 21st Century COE Pro- gram (Ubiquitous Networked Media Computing) and in part by Japan Society for the Promotion of Science (JSPS) under
TABLE V
AVERAGE BUFFER SIZES PER CORE
Circuit p93791h1 p93791h2 p22810h1 p22810h2
Min 99.20 89.79 106.06 107.65
Max 99.39 98.00 112.00 113.15
Grants-in-Aid for Scientific Research B (No.15300018) and for Young Scientists B (No.18700046).
REFERENCES
[1] C. A. Papachristou, F. Martin, and M. Nourani, “Microprocessor based testing for core-based system on chip”, In Proc. IEEE Design Automation Conference, 1999, pp. 586-591.
[2] P. Harrod, “Testing reusable IP - A case study”, In Proc. International Test Conference, 1999, pp. 493-498.
[3] D. Flynn, “AMBA: Enabling reusable on-chip designs”, IEEE Micro, Vol. 17, No. 4, July/Aug. 1997, pp. 20-27.
[4] A. Krstic, L. Chen, W-C. Lai, K-T. Cheng, and S. Dey, “Embedded software-based self-test for programmable core-based designs”, IEEE Design & Test of Computers, Vol. 19, Issue 4, Jul/Aug. 2002, pp. 18-27. [5] L. Chen and S. Dey, “Software-based self-testing methodology for pro-
cessor cores”, IEEE Transactions On Computer-Aided Design Of Inte- grated Circuits And Systems, Vol. 20, No. 3, March 2001, pp. 369-380. [6] A. M. Paschalis, D. Gizopoulos, N. Kranitis, M. Psarakis, and Y. Zorian,
“Deterministic software-based self-testing of embedded processor cores”, In Proc. Design, Automation & Test in Europe, 2001, pp. 92-96. [7] J-R. Huang, M. K. Iyer, and K-T. Cheng, “A self-test methodology for
IP cores in bus-based programmable SOCs”, In Proc. IEEE VLSI Test Symposium, 2001, pp. 198-203.
[8] M. K. Iyer and K-T. Cheng, “Software-based weighted random testing for IP cores in bus-based programmable ICs”, In Proc. IEEE VLSI Test Symposium, 2002, pp. 139-144.
[9] M. Nahvi and A. Ivanov, “A packet switching communication-based test access mechanism for system chips”, In Proc. IEEE European Test Work- shop, 2001, pp. 81-86.
[10] A. Larsson, E. Larsson, P. Eles, and Z. Peng, “Optimization of a bus- based test data transportation mechanism in system-on-chip”, In Proc. Euromicro Conference on Digital Systems Design, 2005, pp. 403-411. [11] F. A. Hussin, T. Yoneda, A. Orailoglu, and H. Fujiwara, “Power-
constrained SOC test schedules through utilization of functional buses”, In Proc. IEEE International Conference on Computer Design, 2006, pp. 230-236.
[12] K. K. Ryu, E. Shin, and V. J. Mooney, “A comparison of five different multiprocessor SOC bus architectures”, In Proc. Digital Systems Design Conference, 2001, pp. 202-209.
[13] W. O. Cesario, D. Lyonnard, G. Nicolescu, Y. Paviot, S. Yoo, A. A. Jer- raya, L. Gauthier, and M. Diaz-Nava, “Multiprocessor SOC platforms: A component-based design approach”, IEEE Design & Test of Computers, Vol. 19, Issue 6, Nov/Dec. 2002, pp. 52-63.
[14] V. Salapura, C. J. Georgiou, and I. Nair, “An efficient system-on-a-chip design methodology for networking applications”, In Proc. International Conference on Compilers, Architecture, and Synthesis for Embedded Systems, 2004, pp. 212-219.
[15] R. Rajsuman, “Design and test of large embedded memories: An overview”, IEEE Design & Test of Computers, Vol. 18, Issue 3, May/June 2001, pp. 16-27.
[16] E. J. Marinissen, R. Kapur, M. Lousberg, T. McLaurin, M. Ricchetti, and Y. Zorian, “On IEEE P1500 standard for embedded core test”, Journal of Electronic Testing: Theory and Applications, Aug. 2002, pp. 365-383. [17] E. Larsson and H. Fujiwara, “System-on-chip test scheduling with recon-
figurable core wrappers”, IEEE Trans. on VLSI Systems, Vol. 14, No. 3, March 2006, pp. 305-309.
[18] J. Pouget, E. Larsson, and Z. Peng, “Multiple-constraint driven system- on-chip test time optimization”, Journal of Electronic Testing: Theory and Applications, Vol. 21, 2005, pp. 599-611.
[19] Y. Huang, S. M. Reddy, W-T. Cheng, P. Reuter, N. Mukherjee, C-C. Tsai, O. Samman, and Y. Zaidan, “Optimal core wrapper width selection and SOC test scheduling based on 3-D bin packing algorithm”, In Proc. Inter- national Test Conference, 2002, pp. 74-82.
[20] E. J. Marinissen, V. Iyengar, and K. Chakrabarty, “A set of benchmarks for modular testing of SOCs”, In Proc. International Test Conference, 2002, pp. 519-528.