PILOT STUDY:
Optical Leak Detection & Measurement
Report Completed by:
Terence Trefiak
EXECUTIVE SUMMARY
An Optical Leak Detection and Measurement Pilot Study was performed at 22 CPC facilities from April-August 2006 by the HSE&SD Environmental
Stewardship group. This innovative study represents a strong knowledge sharing opportunity both within the company and across the industry. The study objective was to test new technology to address the upcoming CAPP Best Management Practice (BMP) on Fugitive Emissions Management (referenced in the updated EUB Directive 60). The BMP will be released by the end of 2006 with
implementation guidelines of one year. The study findings have been used to evaluate the possible benefits of using the technology to address a business unit wide application of a Fugitive Emission Management Plan for Canadian
operations.
The study identified 144 leaking components. Collectively, these leaks account 58.26 mmcf/y and $358,012.10 USD/year in lost product. The methane leak sources contribute 21,420.7 tonnes/year CO2e to GHG emissions. It is estimated
that 92% of the 144 fugitive sources are economical to repair. Implementing all economical repairs would result in a net present savings of $2,002,602.72USD.
Optical Leak Detection & Measurement Summary
TOTAL OF ALL SOURCES TOTAL OF ALL ECONOMIC REPAIRS
# of Sources
Total Yearly
Rate (mcf/year)
CO2e Emission
Rate (tonnes/year)
Savings Potential (US$/year)
Average Payback (years)
NPV (US$)
TABLE OF CONTENTS
EXECUTIVE SUMMARY……….i
TABLE OF CONTENTS………..…ii
1.0 INTRODUCTION………1-4 1.1 Scope………...1
1.2 Background………2-3 1.3 Detection Technology………..3
1.4 Measurement Technology………..4
2.0 RESULTS……….4-5 2.1 Source Summary………...4-5 2.2 Facility Comparison………..5
2.3 Economic Analysis………5
2.4 Division-wide Projection………..5
3.0 RECOMMENDATIONS / CONCLUSIONS…..………6
4.0 REFERENCES……….7
5.0 ACKNOWLEDGMENTS……….7
APPENDIX A – FACILITY COMPARISON GRAPHS………..…8-9 APPENDIX B – METHODOLOGY……….……...10-16 LIST OF FIGURES Figure 1.0 Facility List……….…...1
1.0 INTRODUCTION
1.1 Scope
This study was initiated to evaluate new leak detection and measurement technologies and determine actual facility fugitive emission rates. The results of this study also help to evaluate the potential for a Canadian business unit application of the technology. The main drivers for this study are:
– Increase production & reduce costs by recovering lost gas – CAPP Fugitive Emission Management BMP
– Increase operations Health & Safety – Reduce GHG emissions / Carbon Credits
– Part of CPC Energy Efficiency Program, Gas Star Program, and the
Best-in-Class Initiative
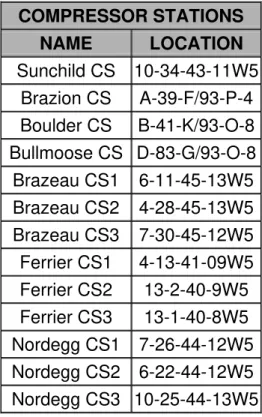
During the study, 22 facilities from various asset areas were assessed for fugitive emissions. This included 9 gas plants and 13 compressor stations (see Figure 1.0 – Facility List). The fugitive sources were identified, tagged and measured. For each source, the repair costs were determined and a cost benefit analysis was performed to determine the economic feasibility of the repair. The field assessments were preformed by two engineers from the HSE Environmental Stewardship Team (Terence Trefiak and Roxanne Pettipas). For detailed methodology, see APPENDIX B - METHODOLOGY.
Figure 1.0 Facility List
GAS PLANTS
NAME LOCATION
Elmworth GP 1-8-71-11W6
Morrin GP 8-11-31-21W4
Ring Border GP C-81-I/94-H-9 Alder Flats GP 10-9-45-8W5
Viking GP 13-31-48-12W4
South Ring GP C-81-I/94-H-10 Connersville GP 9-32-25-15W4
Vulcan GP 8-24-15-22W4
Majorville GP 4-31-18-19W4
COMPRESSOR STATIONS
NAME LOCATION
1.2 Background
As part of its Energy Efficiency Program, ConocoPhillips is developing various projects and initiatives to conserve energy, recover natural gas, and increase production. These projects are also important because they reduce GHG emissions which have added health and safety, environmental and economic benefits. This report contains the results of a Gas Recovery Pilot Study based on the identification, measurement and repair of fugitive emissions from CPC facilities.
In 2005, Burlington Resources purchased an infrared camera to study hydrocarbon leaks from gas processing facilites. The camera, GasfindIR, is an optical emission technology. It is an infrared video camera with hydrocarbon/VOC filter that provides visible images of hydrocarbon gas emissions in real-time. This application was applied to ConocoPhillips Canada including both heritage companies. ConocoPhillips Canada is the first upstream oil and gas company in Canada to use this technology for detecting and tracking fugitive emissions.
Fugitive emissions are natural gas leaks that are emitted to the atmosphere from gas processing equipment. The source of these emissions can either be
intentional (i.e. venting from tanks, controllers, comp. seals, stacks, etc.) or unintentional (i.e. equipment wear and tear / damage, improper or incomplete assembly of components, manufacturing defects, etc.) These emissions potentially cost industry millions of dollars in lost product and may pose safety risks to workers and the public. These fugitive emissions also account for a significant amount of the total inventory of greenhouse gases emitted by the Oil and Gas Industry.
On average, natural gas processing plants lose between 0.05 to 0.5% of their total production to fugitive emissions (based on CPC emissions inventory). These emissions have traditionally been classified as shrinkage; however, up to 96% of these emissions can be profitably prevented by identification and repair (Ref.1). Based on CPC production, fugitive gas loses may amount to between $2,000,000 and $20,000,000 USD per year in lost product (@ $5.50
USD/mmbtu). This provides a significant opportunity to increase production through fugitive emission reduction. Fugitive emissions exist because leaks are invisible, unregulated and usually go unnoticed.
about 25% of total GHG emissions. The reduction of these fugitives could have a significant impact on CPC’s total tonnage of GHG emitted.
There are currently no regulations that apply specifically to the control of emissions from fugitive equipment leaks from upstream oil and gas facilities in Canada. However, CAPP (Canadian Association of Petroleum Producers) has released a Best Management Practice (BMP) titled Management of Fugitive Emissions at Upstream Oil and Gas Facilities. The BMP identifies the typical key sources of fugitive emissions at UOG facilities, presents strategies for
achieving cost-effective reductions in these emissions and summarizes key considerations and constraints.
An effective Fugitive Emission Management Plan should entail a leak assessment program in order to identify, quantify, and remediate fugitive emissions. Conventional leak assessment programs check individual process components using handheld detectors. It is generally estimated that the majority of fugitive emissions arise from a minority of leaking components. Conventional leak assessment programs are very time consuming, because every connection must be assessed individually. A typical plant can have up to 500,000 points that must be checked manually with a ‘‘Gas Sniffer’‘ placed directly on the leak, which is an expensive and time consuming process. Currently CPC does not have a company-wide formal consistent fugitive emission management plan.
1.3 Detection Technology
Optical emission detection is a new technology that has been developed to provide rapid, accurate and safe identification of fugitive emissions. This technology enables the technician to “see” emissions of hydrocarbon vapours such as methane that are normally invisible. The camera provides visible images of a gas emission leak in real-time against the facility background. The image facilitates precise identification of the origin of the leak, essential for repair activities, and qualitatively the magnitude of the leak based on plume size and density. The GasFindIR infrared video camera is the first commercial optical leak detection camera and is priced at $75,000.00 USD.
The benefits of optical leak imaging include:
• Cost-effectively scan hundreds of components simultaneously
• Identify exact source of leaks in real-time with video record
• Assessments performed without interruption of operations
• Scan hard-to-reach components from a distance
1.4 Measurement Technology
After a leak is detected, it is then measured to determine the size of the leak using a HiFlow Sampler. The Leak Detection technician will first determine a qualitative measurement by estimating the severity of the leak (low, medium, high). A quantitative measurement is then performed using a HiFlow Sampler. The HiFlow Sampler is the primary method used to measure emission rates from leaking equipment components. Compared to conventional concentration/correlation measurement estimation methods, the HiFlow Sampler offers a much higher accuracy of measurement which allows an objective cost-benefit analysis of each repair opportunity. The uncertainties in the correlation estimations on an individual component basis are ± two orders of magnitude and the use of stratified emission factors is even less reliable. In comparison, the results of HiFlow Sampler contain certainties of only about ±10 to 15 percent. The HiFlow Sampler cost $14,000.00 USD.
2.0 RESULTS
2.1 Source Summary
The study identified a total of 144 fugitive emission sources within the facilities.
The leaks had an average size of 0.77 cfm with a total cumulative annually amount of 58.26 mmcf/y.
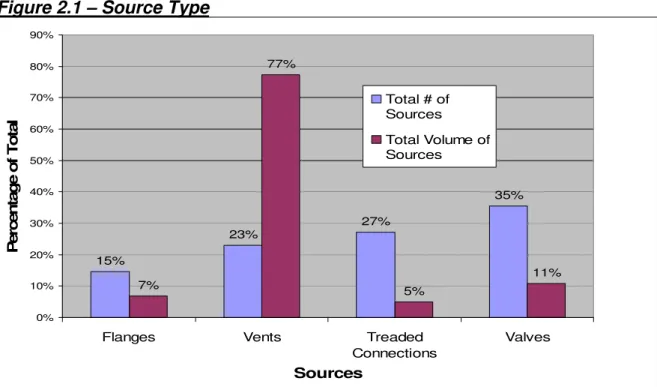
The graph below represents the distribution of leak source types (i.e. threaded connections, flanges, valves and vents) and total associated leak volumes.
15% 23% 27% 35% 7% 77% 5% 11% 0% 10% 20% 30% 40% 50% 60% 70% 80% 90%
Flanges Vents Treaded
Connections Valves Sources P e rc e n ta ge of Tot a l
Total # of Sources
The majority of the sources were process gas (75%), followed by fuel gas (21%) and propane (4%). Most of the sources were found in Compressor Buildings (72%), followed by Process Buildings (20%). The remaining sources were located at outside piping (4%) and tanks (4%).
The study results show that the largest sources were, compressor seal and controller vents, distance piece doors, fuel gas lines and regulators and vent stacks
The leaks identified pose a moderate to high safety risk as they may contribute to higher levels of hydrocarbon within the facilities. These leaks may create levels that exceed 10% of the Lower Explosive Limit within the direct area of the leak (0-50 cm)
2.2 Facility Comparison
In this study, there was no evidence of a correlation between facility throughput and leak rate. There was, however, some correlation between facility age and leak rate (see APPENDIX A – FACILITY COMPARISON GRAPHS).
2.3 Economic Analysis
It is estimated that 92% (132) of the leaks are economical to repair resulting in a potential savings of $358,012.10USD/year (@ $5.50 USD/mmbtu), a net present savings of $2,002,602.72 USD (@ 13% discount rate) and GHG emission reduction of 21,420.7 tonnes CO2e/year. The average payout period is 0.37
years. Based on an average Carbon Credit value of $25 USD/tonne CO2e (from
the draft corporate estimate on CO2 pricing), these methane leaks could be worth an additional $535,518.25 USD/year.
2.4 Canadian Business Unit Projection
An estimation of total economic benefit of a business unit wide fugitive assessment implementation has been developed using the results of the study. This estimation is based on the total number of gas plants and compressor stations currently owned by CPC (64 gas plants and 580 compressor stations). Note that this estimation could grow significantly by the addition of oil batteries and wellsites (which were not included in this study). From the study, the average potential yearly savings is $16,000.00 USD, and the average cost of the assessment and all repairs is $8,000.00 USD. This translates to a total gross estimated annual savings of $10,400,000.00 USD and a corresponding NPV of
$58,000,000.00 USD.
The recovered gas would equate to a yearly reduction of 630,000 tonnes CO2e,
3.0 RECOMMENDATIONS / CONCLUSIONS
From the results of this pilot study it is recommended that a business unit wide Fugitive Management Plan be implemented. This would entail the development of an assessment schedule to address each facility. The CAPP Fugitive Emission Management BMP suggests a four year implementation plan. The BMP bases facility priority on total throughput. Applying this practice to CPC would entail assessing an average of 150 facilities/year, which would incur approximately 70 assessment days/year. If a more aggressive program is determined to be preferential, it is feasible that the BMP schedule could be doubled to 140 assessment days/ year, which would complete all facilities in 2 years. The resources for performing assessments are currently being evaluated and will be determined by the Environmental Stewardship group to address the proposed program.
Following the initial assessments, a 2-year rotational maintenance schedule should be implemented. The facility assessments during the maintenance schedule should generally incur less time and cost due to reduced leak rates. The maintenance phase of the Fugitive Management Plan also includes the involvement of Facility Operators and Facility Design. Operations will be responsible to assess high priority components (identified in the BMP and from assessments) using a handheld TVA “Sniffer” and soap solution on an ongoing schedule. Maintenance schedules should include connection torque checks. The design of facilities should also be influenced by the use of equipment that reduce or eliminate fugitive sources (i.e. low-bleed pneumatics, vent and flare flow meters, vapour recovery units, etc.)
Through industry studies, gas pipeline leaks have been identified as high contributors to fugitive emissions. Optical leak detection has successfully been used in pipeline assessments in the United States (Ref. 3) Therefore; it is recommended that a pipeline leak assessment pilot study be conducted to evaluate the benefits of adding pipeline surveys into the CPC Fugitive Emission Management Plan.
The results of this study have identified that there are significant benefits to the use of optical emission detection and measurement with CPC. The
4.0 REFERENCES
1. EPA Natural Gas Star Lessons Learned From Natural Gas STAR Partners: “DIRECTED INSPECTION AND MAINTENANCE AT GAS PROCESSING PLANTS AND BOOSTER STATIONS” October 2003
2. John Squarek(Canadian Association of Petroleum Producers), Michael Layer (Environment Canada) and David Picard (Clearstone Engineering Ltd.) “DEVELOPMENT OF A BEST MANAGEMENT PRACTICE IN CANADA FOR CONTROLLING FUGITIVE EMISSIONS AT UPSTREAM OIL AND GAS FACILITIES”. Presentation. September 14-16, 2005.
3. EPA Natural Gas Star “PARTNER UPDATE” Fall 2005.
5.0 ACKNOWLEDGMENTS
• Mike Frampton (CPC HSE VP and former Burlington EH&S Manager) inspired the research of the optical emission technology and supported the development of the pilot study.
• Lloyd Visser (Manager Environment) has provided guidance and support to the study and has helped to promote company-wide implementation.
• Roxanne Pettpas (CPC Air Emissions Coordinator) helped to schedule and perform the facility assessments. Without her help and valuable input, the study would have taken considerably longer to complete.
• The following CPC Field Operations staff supported the fugitive assessments at their facilities and provided valuable assistance, knowledge sharing and guidance:
- Dale Gobin - Terry Hoogenboom - Jim Pask - Ken Leschert
APPENDIX A
Graph #1 – Throughput vs. Potential Savings
0.00 20000.00 40000.00 60000.00 80000.00 100000.00 120000.00 Elm w ort h G P Sou th R ing G P R ing Bo rd er GP Viking GP Morrin G P A lde r Fl ats G P Vu lc an G P Ma jorvi lle G P C onne rs vill e GP Facility Thr oughput ( m m c f/ year ) $-$10,000.00 $20,000.00 $30,000.00 $40,000.00 $50,000.00 $60,000.00 P o te nt ia l S avi ng s ( U S D /yea r)
Graph #2 – Facility Age vs. Potential Savings
0 5 10 15 20 25 30 35 40 45 50 V ulc
an G P M orrin G P V ikin g G P C on ne rs ville G P Elm w orth GP M ajo rv
ille G P
A ld
er Fla ts G
P R
in g B
orde r GP
S ou
th R
in g GP
APPENDIX B
LEAK DETECTION & MEASUREMENT METHODOLOGY
This section describes the methodology used by the assessment team to identify and measure fugitive emissions at upstream oil and gas facilities.
1.0 EMISSION DETECTION & MEASUREMENT
The main purpose of the site assessment includes the following:
• screening of equipment components to detect leaks
• measurement of emission rates from identified leaking equipment
• cost-benefit analysis of the identified opportunities
Please note that the term “leak” in this report refers to all fugitive
hydrocarbon emissions that may be accidental (i.e. leaking connection) or intentional (i.e. vents). Whether accidental or intentional leaks, these assessments are meant to determine the size of emission and suggest possible solutions to recover product.
1.1 Health Safety and Environment
All work performed during Leak Detection Assessments follow all applicable:
• Health Safety and Environmental Regulations
• ConocoPhillips HSE Policies and Procedures
• A customized set of Safe Operating Procedures
Note: If at any point during the assessment a safety hazard is identified that may affect the health and safety of the Leak Detection Operators, the assessment is stopped, the Site Operator is informed and a hazard assessment is preformed. The leak detection assessment will only proceed after the hazards have been assessed and controlled.
1.2 Detection Technology
The assessments are performed using an optical emission technology known as the GasFindIR infrared video camera. Optical emission detection is a new technology that has been developed to provide rapid, accurate and safe identification of fugitive emissions. This technology enables the operator to “see” emissions of methane and volatile organic compounds (VOC’s) that are normally invisible. The camera provides visible images of a gas emission leak in real-time against the facility background. The image facilitates precise identification of the origin of the leak, essential for repair activities, and qualitatively the magnitude of the leak based on plume size and density.
The benefits of optical leak imaging include:
• Cost-effectively scan hundreds of components simultaneously
• Access directly with portable, battery-powered camera
• Assessments performed without interruption of operations
• Scan hard-to-reach components from a distance
• Conduct aerial leak surveys over large areas
1.3 Leak Detection Screening
Leak detection screening is performed on all hydrocarbon systems (fuel gas, gas and light- liquid). The types of components surveyed include (but not limited to) flanged and threaded connections (i.e., connectors), valves, pressure-relief devices, open-ended lines, blow-down vents, instrument fittings, regulator and actuator diaphragms, compressor seals, engine and compressor crankcase vents, sump, drain tank vents and tank hatch seals.
Prior to conducting the assessment, a facility map or site tour is obtained via the Site Operator. An assessment plan is then developed which determines the order at which each facility process will be assessed. The plan may be based on the priority of the process building/site or simply on the accessibility (layout) of each process.
Each process building/site is scanned in two phases. The first phase is an exterior scan looking at external equipment. The second phase is an internal scan which inspects all equipment within the facility building. The scanning methodology follows a general path of scanning each piece of relevant
equipment working form one end of the process to the other. Where applicable, each piece of equipment is scanned from at least two separate view points to increase the probability of spotting a leak. Generally, each piece of equipment is first scanned form a wide angle (a larger view point) and then a more detailed scan is performed at a more focused depth (smaller/ closer viewpoint). During the detailed scan, the camera operator will usually scan over the same area a number of times to ensure a high probability of leak detection.
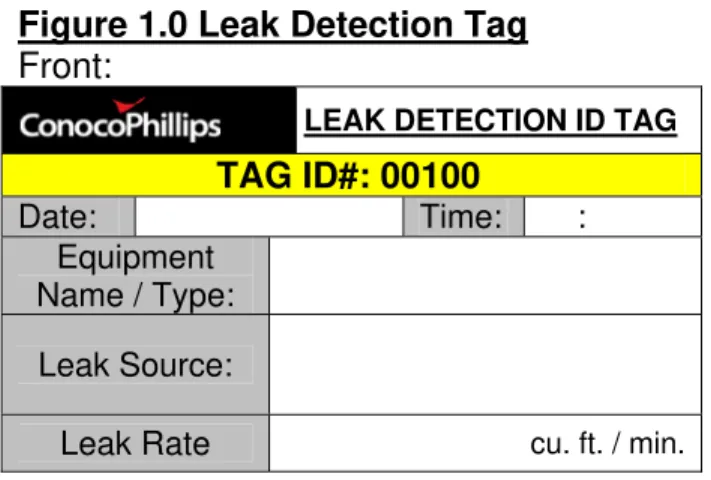
When a leak is detected, a video record is taken at an angel and range which optimizes the visibility of the leak. The video record is at a minimum of 10 seconds in length. When applicable, after identification with the camera, a bubble test is performed on the detected leak to confirm the leak source. The leak details are then recorded and the leak is then marked with a Leak
Detection ID Tag (See Figure 1.0). The tag is placed as close to the leak source as safely possible. In certain instances, the location or conditions of the
equipment prevents a tag form being placed close to the leak source. In this case, the tag is placed in the nearest safe location. All tags are left in place to allow for follow-up action by facility personnel and may be removed by operations when the identified source is repaired.
Figure 1.0 Leak Detection Tag
Front:
LEAK DETECTION ID TAG
TAG ID#: 00100
Date: Time: : Equipment
Name / Type:
Leak Source:
Leak Rate cu. ft. / min.
Back:
CAUTION
DO NOT REMOVE THIS LEAK ID TAG UNTIL EQUIPMENT IS REPAIRED AND
REASSESSED WITH OPTICAL LEAK DETECTION
NOTE: Upon repair of this leak contact Terence Trefiak @ (403) 233-3371
1.4 Leak-Rate Measurements
1.4.1 HiFlow Sampler
After a leak is detected it is then measured to determine the size of the leak in cubic feet per minute (cfm). The Leak Detection Operator will first determine a qualitative measurement by estimating the severity of the leak (low, medium, high). A quantitative measurement is then performed using a HiFlow Sampler. The HiFlow Sampler is the primary method used to measure emission rates from leaking equipment components. Compared to conventional
concentration/correlation measurement estimation methods, the HiFlow offers a much higher accuracy of measurement which allows an objective cost-benefit analysis of each repair opportunity. The uncertainties in the correlation
estimations on an individual component basis are ± two orders of magnitude and the use of stratified emission factors is even less reliable. In comparison, the results of HiFlow contain certainties of only about ±10 to 15 percent. The
reliability and use of the HiFlow Sampler has been demonstrated in a number of studies.
A dual-element hydrocarbon (methane) detector (i.e., catalytic-oxidation/thermal conductivity), inserted directly in the main sample line within the HiFlow,
methane, the leak rate is estimated based on a visual qualitative estimate, the HiFlow rate, and correlations based on gas concentration (US EPA Method 21).
A background sample-collection line and hydrocarbon detector allows the sample readings to be corrected for ambient gas concentrations, which is particularly important in buildings and confined areas. A vane anemometer, also inserted directly into the main sample line, monitors the mass flow rate of the sampled air-hydrocarbon gas mixture. The sample and background air-hydrocarbon detectors in the HiFlow Sampler were calibrated to 100 percent methane and 2.5 percent methane-in-air to cover both ranges of the dual-element detector system. Zeroing of the detectors is performed using ambient air upwind of the facilities. The
calibrations are performed prior to use of the HiFlow Sampler at the site, and then periodically during the measurement work to ensure that no significant drift had occurred. The HiFlow Sampler is also calibrated periodically by releasing known flow rates of methane into the sampler inlet and comparing the leak rate measured by the HiFlow .
Leak rates are measured at two separate flow rates (high and low) to ensure that an accurate sample is taken. Generally, the higher leak rate of these two
measurements will be used as the final leak rate number. The HiFlow Sampler data logs all saved leak rates, which are transferred to an electronic spreadsheet. The recorded leak rate may be lower than the actual leak rate due to inability to capture the leak. In these cases the actual leak rate is estimated based on the recorded rate and the leak video record. In addition, not all leak rates are saved to the HiFlow data logger, some leak rates are only recorded on hard copy.
The HiFlow Sampler is intrinsically safe and is equipped with a grounding wire to dissipate any static charge that may accumulate as air passes through the
sample collection line and instrument.
Specific cases where the HiFlow Sampler is not used include any components leaking at rates above the upper limit of the unit (i.e. above about 14 m3/h or 500 ft3/h) and equipment in inaccessible or unsafe locations. Alternative
measurement techniques in which the HiFlow Sampler can not be used are discussed in the next section.
1.4.2 Alternative Measurement Techniques
When flow rates are encountered higer than the capabuility of the HiFlow Sampler, emission rates are measured using an appropriate flow-through measurement device (i.e., a precision rotary meter, diaphragm flow meter, or rotameter, depending on the flow rate)
When measuring flows from vents, a distinction is made between continuous and intermittent vent systems. Emissions from intermittent vents during inactive periods are defined as leakage. Emissions from continuous vent systems and intermittent vent systems during venting events are defined as venting emissions.
1.5 Emission Control Guidelines
There are currently no regulations that apply specifically to the control of emissions from fugitive equipment leaks from upstream oil and gas facilities in Canada. However, CAPP (Canadian Association of Petroleum Producers) has released a Best Management Practice (BMP) titled Management of Fugitive Emissions at Upstream Oil and Gas Facilities. The BMP identifies the typical key sources of fugitive emissions at UOG facilities, presents strategies for
achieving cost-effective reductions in these emissions and summarizes key considerations and constraints.
2.0 COST BENEFIT ANALYSIS
Each fugitive equipment leak is identified and assessed on a source-by-source basis. It is assumed that any opportunities to economically repair or control a source will be implemented and that repairs will be done as soon as is practical, or scheduled for the next plant turnaround if a plant shutdown is required to perform the work.
The information and assumptions regarding estimated repair cost and repair life, the value of the gas lost, and other financial considerations used in this analysis are summarized below.
2.1 Repair Cost/Life Estimating
The basic cost to repair or replace a leaking equipment component is estimated based on the type and size of the component, typical service billing rates and the estimated amount of materials/equipment required. When possible, the actual cost of repair is obtained by the Facility Operator.
It is assumed that a leak, once repaired, will remain fixed for a finite period of time, and then will reoccur. The mean time between failures is dependent on the type, style and quality of the component, the demands of the specific application, component activity levels (e.g., number of valve operations) and individual
2.2 Value of Natural Gas and Process Gas
The value of natural gas and propane used is taken from corporate forecasting values. The 2006 value of gases is based on a forecast of $5.50/mmBTU. This gives a natural gas value of $5.58/mcf and a propane value of $13.68/mcf. When available, the actual cost of purchased propane is obtained from the Facility Operators.
2.3 Financial Values and Assumptions
2.3.1 Financial Discount Rate
The discount rate and opportunity cost of equity in the gas industry is 13%.
2.3.2 Net Present Value (NPV)
The net present value of each target control option is the present value of
benefits minus the present value of costs. The analysis period in each case is the expected life of the control measure (e.g., the average repair life or mean time between leak occurrences).
2.3.3 Payout Period
The payout period of each target control option is the number of periods (years) required to payout the repair costs based on annual payments equal to the value of the net benefit of repairs.
2.3.4 Annual Value
The annual value of each leak is expressed as the amount of gas, in one year, which would be conserved if the leak were to be repaired.
2.3.5 CO2e Calculations
The amount of CO2e is calculated by totaling the annual methane amount
(tonnes) of the emissions and multiplying this number by the Global Warming Potential of CH4 of 21. The methane tonnage was calculated using an average