Description of The Data and Sampling Strategy
Kazushi Takahashi, Takayuki Higashikata, Kazunari Tsukada
This is to explain our data set. The questionnaire is available on this web, even
though it is written only in Indonesia.
The data come from several field surveys in Gresik district, East Java province,
Indonesia, conducted by authors in collaboration with Yayasan Bina Swadaya. Gresik
is located on the north-western of Surabaya, the capital city of East Java province and
the second largest city in Indonesia. The preliminary survey was conducted in May and
September 2007 and the main household interviews were undertaken in December 2007
and January 2008. The total number of sample households was 500, covering both
potential clients and non-clients of Bank Perkreditan Rakyat (BPR) Kebomas. In
addition, the follow-up survey was conducted in July-August 2008.
BPR Kebomas is a microfinance institution operated in Gresik since 2003 and it
has significantly expanded outreach year by year: the number of clients increased from
50 to approximately 3500 between 2003 and 2007.
The main objective of the household survey in December 2007 and January 2008 was
to collect the baseline information of households prior to borrowings. For this purpose,
we excluded the tenured clients from the target.
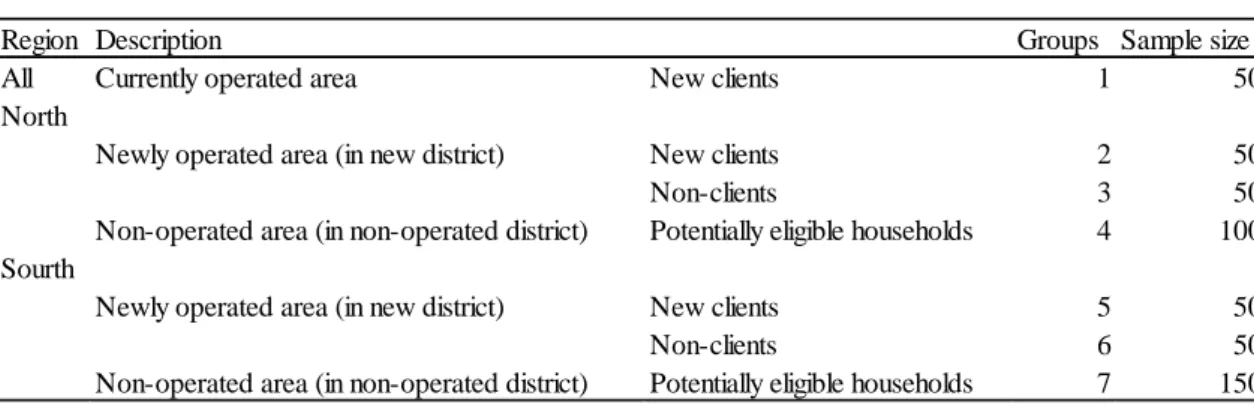
Table 1. Sampling Structure in 2007
The composition of the 500 households was as follows: Group 1 consists of “new
clients in waiting list” in currently operated areas. We refer “new clients in waiting list”
as those who have already started mandatory savings but not borrowings yet at the time
of the baseline household survey. Among currently operated villages, 50 households
who meet this criterion are selected at random.
Group 2 and Group 5 consist of “new clients in waiting list” in newly operated
Region Description Groups Sample size
All Currently operated area New clients 1 50
North
Newly operated area (in new district) New clients 2 50
Non-clients 3 50
Non-operated area (in non-operated district) Potentially eligible households 4 100 Sourth
Newly operated area (in new district) New clients 5 50
Non-clients 6 50
areas in the northern part and the southern part, respectively. We divided the
geographic areas into two, i.e., the northern and southern part, because occupational
structures are different across these two areas. Then, for each area, we selected
non-applicants living in the same villages as new clients at random (Group 3 in the
north and Group 6 in the south) and potentially eligible households living in the
non-operated villages (Group 4 in the north and Group 7 in the south).
To increase the matching probability, we conducted a purposive survey for 300
households, randomly selected from non-operated areas in the north and for 200 in the
south areas. The contents of the purposive survey are very similar to the one used by
BPR Kebomas when it selects clients from applicants. After the survey, we asked staff
of BPR to choose potentially eligible households who are creditworthy. We consider
possible counterfactual for “new clients in waiting list” if respondents of the purposive
survey are clarified as “creditworthy” and for non-participants if respondents are
clarified as “not creditworthy”. Through this procedure, sample households in Group