Development of X-ray Dark-Field
Imaging for Early Clinical Diagnosis
of Arthropathy
Daisuke SHIMAO
DOCTOR OF PHILOSOPHY
Department of Materials Structure Science
School of High Energy Accelerator Science
The Graduate University for Advanced Studies
2005
Contents
Contents 1
List of figures 4
List of tables 10
Chapter
1. Introduction 11
2. Rheumatoid arthritis – On behalf of arthropathy – 18
3. Theoretical consideration of X-ray refraction at an object
and X-ray DFI 27 3.1 X-ray refraction at an object ・・・・・・・・・・・・・・・ 27
3.2 X-ray DFI by Laue geometry ・・・・・・・・・・・・・・・ 31
4. Experiment of X-ray DFI for articular cartilage
towards clinical application 47
4.1 Design of experimental setup ・・・・・・・・・・・・・・ 47
4.2 Simulation of rocking curves for the designed setup
to realize X-ray DFI ・・・・・・・・・・・・・・・・・ 48
4.3 Object and consideration of the best setting of the object
to visualize articular cartilage ・・・・・・・・・・・・・・ 51
4.4 Experiment of X-ray DFI for visualization of articular cartilage・ 52
4.4.1 Preliminary experiment of PIP joint imaging
by X-ray DFI at Photon Factory BL14B ・・・・・・・ 52
4.4.2 Further detailed experiment of PIP joint imaging
by X-ray DFI at Photon Factory BL14C1 ・・・・・・・ 54
4.4.3 Experiment for the clinical application of X-ray DFI
at Photon Factory BL14B ・・・・・・・・・・・・・ 56
4.4.3.1 Dosimetry in X-ray DFI ・・・・・・・・・・・ 56
4.4.3.2 Imaging of normal PIP and PIP with lesion
by non screen and film/screen system ・・・・・・ 58
4.4.4 Estimation of spatial resolution for X-ray DFI ・・・・・ 59
5. Results 77
5.1 Results of the preliminary experiment of PIP joint imaging
by X-ray DFI at Photon Factory BL14B ・・・・・・・・・・ 77
5.2 Results of the further detailed experiment of PIP joint imaging
by X-ray DFI at Photon Factory BL - 14C1 ・・・・・・・・・ 79
5.3 Results of the experiment for clinical application of X-ray
DFI at Photon Factory BL14B ・・・・・・・・・・・・・ 80
5.4 Results of the estimation of spatial resolution for X-ray DFI・・ 81
6. Magnetic Resonance Imaging of PIP joint articular cartilage 98
7. Discussion 109
8. Concluding remarks 131
Acknowledgements 135
References 137
List of figures
Figure page
1. Conception diagram representing the effects of pharmacotherapy on rheumatoid arthritis. --- 22
2. Schemas of (a): joint structure and (b): function of the
immunosystem. --- 23 3. Process of joint destruction due to rheumatoid arthritis. --- 24
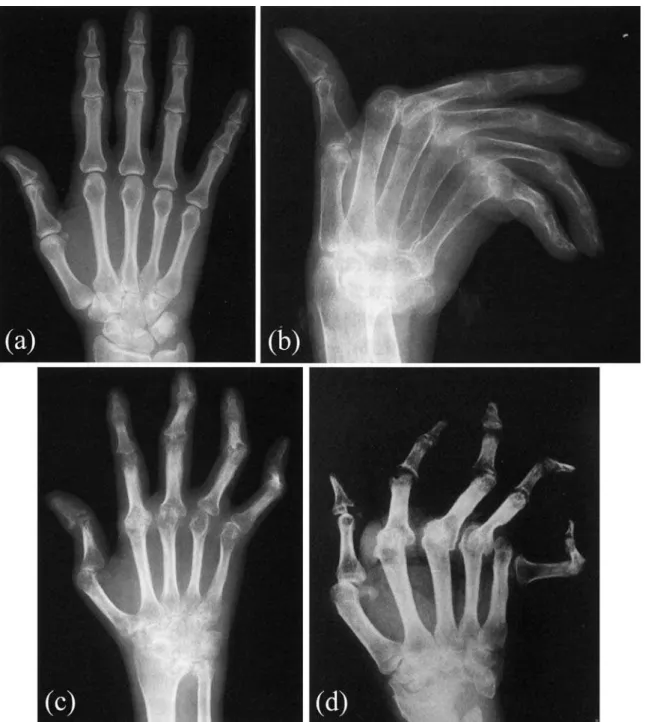
4. Photographs of typical appearances of the hands of patients suffering from rheumatoid arthritis in (a): early stages and
(b)-(d): advanced stages. --- 25
5. Typical X-ray absorption contrast images of the hands of patients suffering from rheumatoid arthritis in (a): early stages and
(b)-(d): advanced stages. --- 26
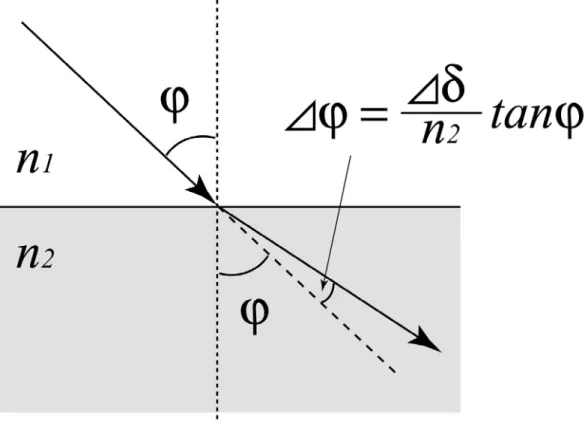
6. Refraction of X-rays at a flat boundary between media with
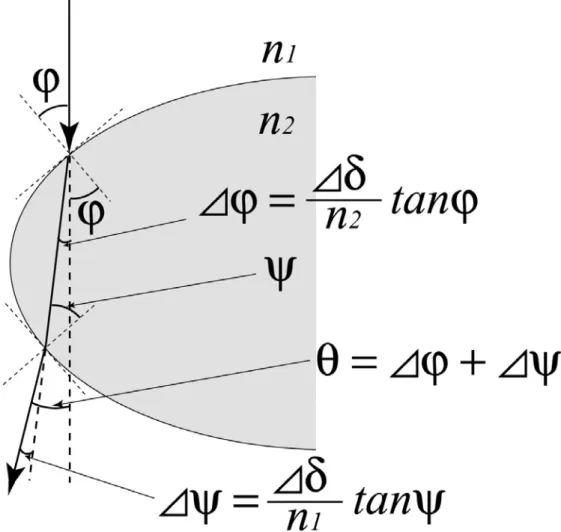
refractive indices n1 and n2. --- 36 7. Refraction of X-rays at an elliptical boundary between media
8. Refraction of X-rays at a circular boundary between media
with refractive indices n1 and n2. --- 38 9. Values of ϕ for the circular boundary around the point where
X-rays are tangentially incident. --- 40
10. Relationship between incident angle ϕ of 35 keV X-rays and deviation angle θ for the boundary between synovial fluid and
articular cartilage. --- 41 11. Comparison of Bragg geometry (a) and Laue geometry (b) in
obtaining an equivalent field of view. MC: monochro-collimator, O: object, A(B): Bragg case analyzer, A(L): Laue case analyzer, D: diffracted X-rays, and FD: forward diffracted X-rays. --- 42 12. Analyzer thickness H dependency of IO with H decreased by
15 μm to 60 μm when the incident X-ray energy is fixed. --- 43 13. Analyzer thickness H dependency of IO with H increased by
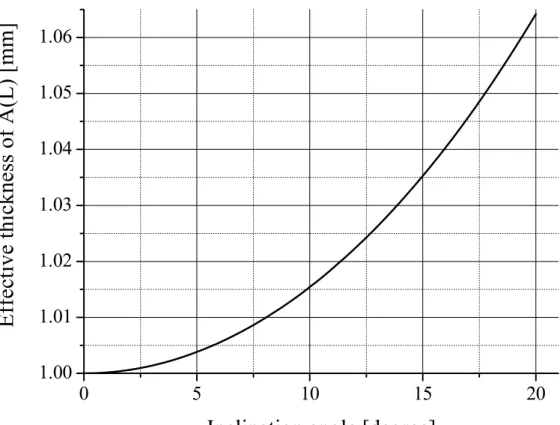
15 μm to 60 μm when the incident X-ray energy is fixed. --- 44 14. Relationship between inclination angle and effective thickness
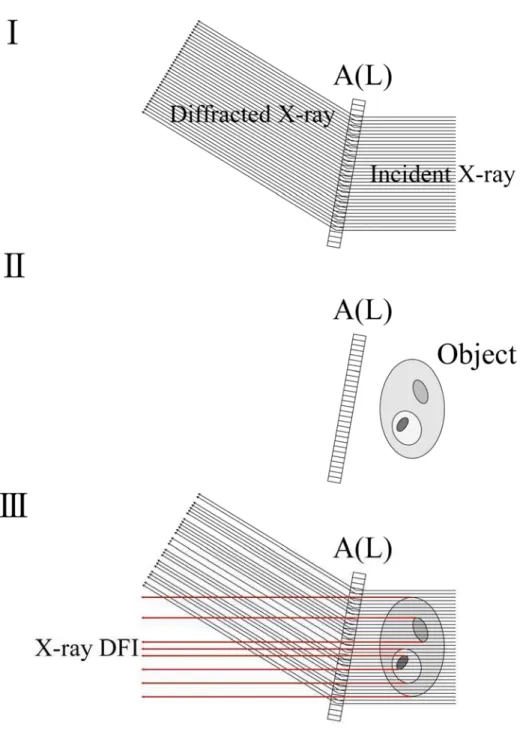
of 1-mm-thick Laue case analyzer. --- 45 15. Steps involved in acquiring X-ray DFI. --- 46 16. Photograph of MC. --- 61
A(L) at incident X-ray energy of 35keV when thicknesses are varied by approximately 30 μm. (a) 1147 μm, (b) 1175 μm,
(c) 1205 μm, (d) 1235 μm, and (e) 1265 μm. --- 63-65 20. Coloured volume-rendered 3D X-ray CT images displayed
with various opacities. --- 66
21. Volume-rendered 3D X-ray CT images of bones viewed from
various angles. --- 67
22. Photograph of the experimental apparatus at BL14B. --- 68
23. Representative measured rocking curves of forward diffraction
and diffraction by A(L) without an object at BL14B. --- 69
24. Representative measured rocking curves of forward diffraction
and diffraction by A(L) without an object at BL14C1. --- 70
25. Points of angles of A(L) offset from the just Bragg condition by 0.04, 0.08, and 0.10 arcsec to either higher or lower angular
positions. --- 71
26. Setup for the measurement of entrance surface dose. --- 72
27. Photograph of 6 cm3 ion chamber; 10X5-6 with model 9015
monitor (Radcal Corporation). --- 73
28. Representative measured rocking curves of forward diffraction and diffraction by A(L) without an object at BL14B at operating mode with 3 GeV and 200 mA. --- 74
29. Points of angles of A(L) offset from the just Bragg condition by 0.04, 0.08, and 0.12 arcsec to either higher or lower angular
30. Optical photograph of the phantom used for the measurement
of spatial resolution for refraction contrast. --- 76
31. Photomicrograph of the phantom used for the measurement
of spatial resolution for refraction contrast. --- 76
32. X-ray images of PIP joint taken at BL14B as a preliminary experiment. White arrows indicate articular cartilage on the
head of the proximal phalanx. --- 83
33. (a): Photograph of the whole object. (b): Magnified view of
the area enclosed by the white rectangle in (a). --- 84
34. Areas X-rays are incident on for the measurement of rocking curves for soft tissues (A) and bone (B). Areas are both 5 mm
square. --- 85
35. Normalized rocking curves for estimating the X-ray beam
divergences. --- 86 36. X-ray images of the PIP joint taken at BL14C1 as a detailed
experiment. --- 87-88 37. X-ray images of normal PIP joint without an intensifying
screen. --- 89-90 38. X-ray images of normal PIP joint with an intensifying
screen. --- 91-92
intensifying screen. --- 95-96 41. (a): X-ray DFI and (b): X-ray BFI acquired simultaneously using
the phantom for measuring spatial resolution. White arrows show the minimum distinguishable points of the two lines. --- 97
42. T1 weighted images of the normal PIP joint. --- 103
43. T2 weighted images of the normal PIP joint. --- 104
44. T1 weighted images of the normal PIP joint using microscopic
coil. --- 105
45. T2 weighted images of the normal PIP joint using microscopic
coil. --- 106
46. T1 weighted images of the PIP joint with lesion using
microscopic coil. --- 107
47. T2 weighted images of the PIP joint with lesion using
microscopic coil. --- 108
48. Cross-section of an acrylic plate with scratched line showing the process of beam deformation producing a spot that is composed
of locally deviated X-rays. --- 119
49. (a): Process of beam (spherical wave) diffraction in the forward diffraction and diffraction directions accompanied by Borrmann fan. (b): Relative intensity profile of forward diffraction. (c): Relative intensity profile of diffraction. (d): Image formed on
forward diffraction. (e): Image formed on diffraction. --- 120
50. Enlarged cross-section of an acrylic plate with scratched line.
deviated at the edge A and B. The distance between A and B
is 60-80 μm. --- 121
51. Relationship between deviation angle θ and distance from
tangential incident point D. --- 122 52. Magnified views of the head of the proximal phalanx shown in
Figs. 32 (a), (b), (f), and (h). --- 123
53. Photographs of the object with lesion used in experiment 4.4.3.2 following dissection. --- 124
54. Magnified views of the head of the proximal phalanx shown in Figs. 39 (a), (b), (f), and (h). White arrows A and B correspond
to the lesions indicated in Fig. 53. --- 125
55. Images with surviving articular cartilage and irregular contour of subchondral bone painted blue and red, respectively: (b).
(a) accompanies (b) for the purpose of comparison. --- 126 56. (a): Photograph of a sliced finger. (b): T1 and (c): T2 weighted
MRI of finger. --- 127 57. Comparison of (a): X-ray DFI with (b): T1 weighted MRI taken
using the microscopic coil with regard to the depiction ability
for the articular cartilage lesion of the PIP joint. --- 128
List of tables
Table page 1. ρ and δ values of representative tissues and water for 35 keV
X-rays. --- 39
2. Representative entrance surface dose per diagnostic radiographic examination for each part of the body, as from a general hospital in Japan, and guidance levels for medical exposure issued by the International Atomic Energy Agency (IAEA). --- 129
3. Representative entrance surface dose for fluoroscopy from a general hospital in Japan, and dose rate guidance levels for
fluoroscopy issued by the IAEA. --- 130
Chapter 1
Introduction
X-rays are widely applied in different scientific fields as a non-destructive examination for the observation of internal structures. Especially in the field of clinical medicine, X-ray absorption contrast images are easily interpreted and have proved to be useful in medical diagnosis as projection image or computer tomography (CT). Projection images are used to visualize bone for diagnosing bone fractures and bone alignment, for observing the condition of the chest, and for abdominal imaging; angiography, urography, arthrography and digestive tract imaging are undertaken using contrast medium. In using these methods, however,
soft tissues are sufficiently large to provide contrast but insufficient to provide adequate contrast between different soft tissues. Contrast between tissues with small differences in μ can only be detected using lower incident X-ray energy. Mammography, which utilizes low X-ray energy from a dedicated X-ray tube, is the only imaging method that aims to depict soft tissue.
So far several kinds of X-ray imaging have been developed based on the slight differences in the refractive index n:
n=1-δ (1) of an object [1-29] using synchrotron radiation [7-9, 12, 14-19, 21-29] and have been studied with a view to their medical application [30-65]. Here δ is the unit decrement of the refractive index
A Z N mc
e ρ
π δ λ
2
2 2
= 2 (2)
where e2/mc2 is the classic electron radius, λ is the wavelength, N is the Avogadro number, ρ is the medium density and Z and A are the medium atomic number and weight, respectively. Therefore, δ is proportional to ρ and λ2 and is approximated as follows [31],
2
1011
35 .
1 ρλ
δ ≅ × × (3) Three major techniques for detecting the effect of refraction by an object have been attempted for medical applications. The simplest method is in-line holography [4, 5, 7-11, 13-15, 19, 20, 32-34, 37, 41-43, 51, 61,
65]. The method works with both monochromatic and polychromatic X-rays, and differs from conventional X-ray absorption contrast imaging only in that a gap is introduced between the object and the detector to allow sufficient distance for refracted and non-refracted X-rays to interfere and produce contrast. Fine edge enhancement of the borders between objects is produced, with relatively large differences in their refractive indices. The technique has been performed using both conventional microfocus X-ray sources [4, 5, 10, 11, 13, 20] and synchrotron radiation [7-9, 14, 15, 19, 32-34, 37, 41-43, 51, 61, 65] and has been studied for medical applications in mammography [34, 61] and the imaging of bone [33, 37, 41], articular cartilage [51], the chest [42, 65] and foreign bodied [43].
The second method for detecting refraction effects exploits the narrow angular acceptance of Bragg diffraction in a perfect silicon crystal. In practice, this is realized using monochromatic synchrotron X-rays. An analyzer crystal is positioned behind an object and resolves those X-rays refracted by the object. Two types of crystal geometry for diffraction have been studied: Bragg and Laue case methods. The Bragg case method has been actively researched internationally using a line-scanning method to obtain the necessary field of view (FOV), which needs scanning the object
form an image. This method has been applied to imaging of the breast [31, 34, 53], articular cartilage and/or tendons [38, 39, 44, 58]. If the analyzer crystal is prepared sufficiently thin that forward diffracted X-rays are transmitted, two kinds of images are formed on diffracted and forward diffracted X-rays [24, 29]. The Laue case method using X-rays was first applied to imaging by Ingal et al. [6]. The authors demonstrated the principles of the technique and took images of aquarium fish and test samples made of Plexiglas containing air and 5% KBr solution on the forward diffracted X-rays using laboratory X-ray source. Lately, supporting their idea I have applied this method to the imaging of ligaments and articular cartilage using synchrotron X-rays [45, 47, 51]. X-ray Dark-Field Imaging (DFI) utilizing Laue geometry has recently been proposed by Ando et al. [21, 22, 23]. This novel method differs from that of by Ingal et al. [6] in terms of introducing tuning of incident X-ray energy and the thickness of analyzer crystal; this allows the intensity of forward diffracted X-rays to approach zero at the Bragg condition. Consequently, X-rays that are non-refracted at an object no longer pass through in the forward diffraction direction. Higher image contrast related to refraction by an object can be expected with DFI, as minute contrast can be detected with almost no background illumination. DFI has been applied to the imaging of bone [21, 23, 48, 49], articular cartilage [48, 49, 50, 55, 60] and breast
specimens [52, 55, 60]. Imaging that utilizes Laue geometry is basically performed by two-dimensional (2D) single-shot method.
The third method is X-ray interferometry, which offers phase contrast images based on the phase shift of X-rays at an object. An X-ray interferometer with three or four blades is usually fabricated from a single block of silicon. An interference pattern is obtained when the beam passing through an object interferes with a reference beam that is divided from the incident beam incident on the object and that has the same phase as the incident beam. This interference is generated by the X-ray interferometer. An advantage of this method is that it allows the introduction of known phase shifts into the reference beam, which then enables phase map of the object to be obtained directly from the interference patterns. A detailed description of this method can be found in Momose et al. [16, 17, 30, 35, 36, 40]. Fine phase contrast images have been acquired of specimens including such as liver [30, 36], blood vessels [35, 40], and brain [40]; however, this method is the most complex to realize experimentally because minute changes in room temperature and/or vibration of the device are detrimental to the sequential measurements required to acquire a phase map.
medicine, however, synchrotron X-rays have fixed incident direction, which necessitates rotation of the object (patient) during image acquisition. As rotation of the patient, which tends to induce patient movement, is unrealistic in terms of patient care, only the 2D one-shot projection imaging method is applicable to clinical imaging.
Conventional plane radiography is currently used for the detection of joint abnormalities such as osteoarthritis and rheumatoid arthritis; however, as cartilage shows little X-ray absorption contrast, diagnosis of joint abnormalities is undertaken by detecting bone erosion and/or measuring the joint space width on the images [66-75]. This method is sensitive only to advanced cases, and cannot detect early-stage structural abnormalities of cartilage. It is therefore desirable to develop a technique that enables the detection of cartilage with high spatial resolution, as this will lead to new treatment strategies for the early stages of cartilage defects. For this reason, many researchers have studied the depiction of cartilage using magnetic resonance imaging (MRI) [76-93], but such a technique remains to be firmly established, and there is demand for an alternative technique.
For the purposes of clinical imaging of articular cartilage, Laue geometry is adopted, as it offers a larger 2D one-shot field size than Bragg geometry using the same size of analyzer crystal; the X-ray DFI technique was introduced to acquire fine contrast of articular cartilage. The object
imaged in the present study was an intact human finger, unsliced and with skin on while sliced and/or naked or skin stripped objects had been used in almost all of the similar studies by other refraction detection techniques. In a projection image, it is difficult to depict articular cartilage located inside an intact object because of the interference of numerous surrounding soft tissues such as skin, adipose tissues and muscles. The main goal of the current study is to overcome this difficulty in order to apply refraction imaging of articular cartilage to a clinical use.
This thesis consists 8 chapters. Chapter 2 summarizes rheumatoid arthritis, one of the most promising clinical applications of X-ray DFI, and the importance of its early image diagnosis. In Chapter 3, X-ray refraction and X-ray DFI are described from a theoretical perspective. The main subject of this thesis deals with the application of X-ray DFI to the early diagnosis of arthropathy. Experiments related to the clinical application of X-ray DFI and experimental results are presented in chapter 4 and 5, respectively. MRI is the current standard examination for the investigation of abnormalities of articular cartilage. In chapter 6, images of the same object acquired by MRI are presented for comparison with X-ray DFI. Based on the results of this study, the applicability of X-ray DFI to the
Chapter 2
Rheumatoid arthritis
– On behalf of arthropathy –
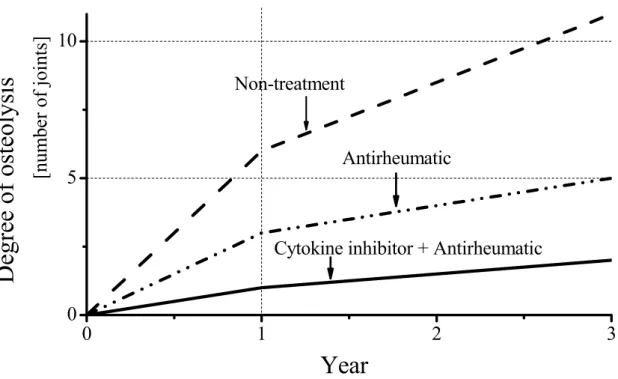
The term ‘arthropathy’ encompasses rheumatoid arthritis (RA), osteoarthritis (OA), neuropathic arthropathy, infectious arthritis and so on. Among them RA reduces Quality of Life (QOL) as it progresses [94, 95]. Furthermore, some studies from rheumatology clinical settings indicate that patients with RA die earlier than expected in comparison with individuals in the general population of the same age and sex but without the disease [95-98]. Recent pharmacotherapy developments for the treatment of RA using a biologic agent such as cytokine inhibitors have reported that prognosis improves dramatically provided that the biologic agent is used together with the usual antirheumatic [99]. A conception diagram that represents the effects of pharmacotherapy on RA is shown in Fig. 1. If RA
is treated using a cytokine inhibitor and an antirheumatic in the early stage of the disease, dissemination is restrained and the patients’ QOL is preserved. Therefore, early diagnosis and treatment are of great importance.
RA is a common systemic autoimmune disease that is prevalent in approximately 1% of the population worldwide. It is multifunctional in origin and is characterized by the inflammation of the membrane lining joints. Its occurrence is more frequent in females than males, which suggests that sex hormones are influential in its etiology. RA occurs most commonly in the fingers and toes, and progressively disseminates to joints throughout the body in later stages of the disease. The diagnosis of RA is based primarily on clinical, radiological, and immunological features. Current laboratory-based serological tests measure factors such as rheumatoid factor (RF). Despite offering reasonable sensitivity, as a diagnostic tool this parameter has poor specificity. It has been recognized for several years that antibodies to anti-perinuclear factor (APF) and keratin (AKA) are highly specific for RA. The antigen of both these antibodies has recently been identified as epidermal filaggrin, an intermediate filament-associated protein involved in the cornification of the epidermis [100, 101]. Profilaggrin which is present in the keratohyaline
enzyme peptidylarginine deiminase (PAD) [102].
In 1998, Schellekens et al. [103] reported that antibodies that are reactive with synthetic peptides that contain the unusual amino acid citrulline are present in 76% of RA sera. Furthermore, these antibodies display a specificity of 96% for RA. The antibodies in patients with RA that recogniz the citrulline containing epitopes are predominantly of the IgG class and of relatively high affinity. A subsequent paper by the same group reported that an ELISA test based on cyclic citrullinated peptide (CCP) showed superior performance to the linear version in the detection of antibodies to RA [104]. It has also been observed that anti-CCP antibodies can be detected very early in RA and appear to have a high prognostic value as a marker, with good discriminating power between erosive and non-erosive RA.
As described above, immunological researches in this field is currently active, while radiological research is inactive. This inactivity may reflect the fact that conventional X-ray absorption images can reveal bone structure alone. If minute changes in articular cartilage were able to be detected by X-ray, the situation would be different.
Schemas of the joint structure and the function of immunosystem are shown in Fig. 2 (a) and 2 (b), respectively. A typical joint consists of two opposing bones, the tips of which are covered with articular cartilage. Joints are wrapped in articular capsule, which is lined with synovial
membrane and filled with synovial fluid. When bacteria or viruses invade in a joint, they are attacked by antibodies produced in response to the invasion. In the joints of patients suffering from RA, however, antibodies are produced because of immunodeficiency, without the invasion of foreign bodies, and this leads to the destruction of a joint. Figure 3 shows schemas of this process. Figure 3 (a) shows a normal joint. Antibodies produced because of immunodeficiency stimulate synovial membrane (Fig. 3 (b)). Synovitis progresses with swelling of the joint, which leads to the erosion of bones and articular cartilage (Fig. 3 (c)). Articular cartilages disappear and the joint is destroyed (Fig. 3 (d)). Typical photographs and X-ray absorption contrast images of the hands of patients suffering from RA are shown in Fig. 4 and Fig. 5, respectively. Figures 4 (b)-(d) and 5 (b)-(d) show advanced stages that cannot be cured. These findings correspond to the stage of Fig. 3 (d) and easily observed on X-ray absorption contrast images. Relatively early-stage RA showing bone erosion can also be detected by X-ray absorption contrast images, although articular cartilage cannot be depicted; this corresponds to the stage shown in Fig 3 (c). The early diagnosis of RA will be possible with the successful detection of minute changes in articular cartilage and bone surface specific to RA at an
0 1 2 3 0
5 10
Degree of osteolysis
[number of joints]Year
Non-treatment
Antirheumatic
Cytokine inhibitor + Antirheumatic
Figure 1. Conception diagram representing the effects of pharmacotherapy on rheumatoid arthritis.
23
24
25
Figure 5. Typical X-ray absorption contrast images of the hands of patients suffering from rheumatoid arthritis in (a): early stages and (b)-(d): advanced stages.
Chapter 3
Theoretical consideration of X-ray refraction
at an object and X-ray DFI
3.1 X-ray refraction at an object
When X-rays pass through an object, refraction of the beam occurs at the border that separates various media, and absorption takes place according to the absorption coefficients of their components. As soft tissues of biomedical objects have only slight differences in density values, they are barely distinguishable by absorption contrast images. It is therefore open to discussion whether X-ray images based on refraction can reveal
with different refractive indices n1 and n2 (Fig. 6). When an X-ray is incident on the flat boundary at an angle ϕ, it deviatesΔϕ from its initial direction according to Snell’s Low as follows:
1 2
) sin(
sin
n
= n Δ + ϕ ϕ
ϕ (4)
This equation is modified by Taylor’s expansion [105] for the function sinϕ/sin(ϕ+Δϕ) as follows:
1 2
cos sin
sin
n
≅ n Δ
⋅
+ ϕ ϕ
ϕ
ϕ (5)
Following manipulation of this equation, we have: ϕ
ϕ tan
2 2 1
n n n −
≅
Δ (6)
From Eq. (1), Eq. (6) finally takes the form: δ ϕ
ϕ tan
n2
≅ Δ
Δ (7)
Here, Δδ = n1- n2 =δ2 - δ1, where δ1 and δ2 are unit decrements of media n1 and n2, respectively. The deviation angle can become sufficiently large in the case of a circular boundary because of the large value of the possible incident angle. Let us suppose an elliptical boundary where X-rays are incident on the surface at angle ϕ (Fig. 7). In this case, X-rays are deviated once more when exiting the object. If the angle of incidence at the boundary on the opposite side is ψ, deflection angle Δψ is calculated as
follows:
2 1
) sin(
sin
n
= n Δ
− ψ ψ
ψ (8)
2 1
cos sin
sin
n
≅ n Δ
⋅
− ψ ψ
ψ
ψ (9)
ψ
ψ tan
1 2 1
n n n −
≅
Δ (10)
δ ψ
ψ tan
n1
≅ Δ
Δ (11)
After propagating through an elliptical object, the incident X-rays attain a total deflection angle of θ :
ψ ϕ θ ≅ Δ +Δ
1 2
tan tan
n n
ψ δ ϕ
δ + Δ
= Δ
) tan tan
( 1 2
2 1
ψ δ ϕ
n n n
n +
= Δ (12)
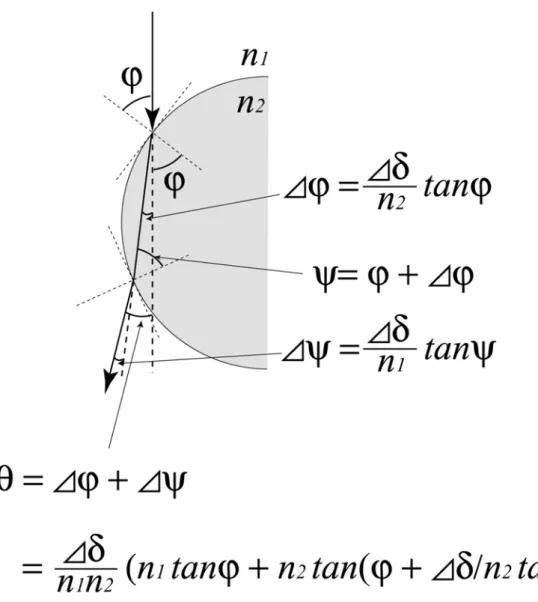
To simplify the geometrical consideration, let us suppose a circular boundary, as shown in Fig. 8. Because of its symmetrical shape, ψ can be expressed as follows:
)) tan tan(
tan (
2 2
1 2 1
δ ϕ ϕ δ ϕ
θ nn n n n
+ Δ Δ +
≅ (14)
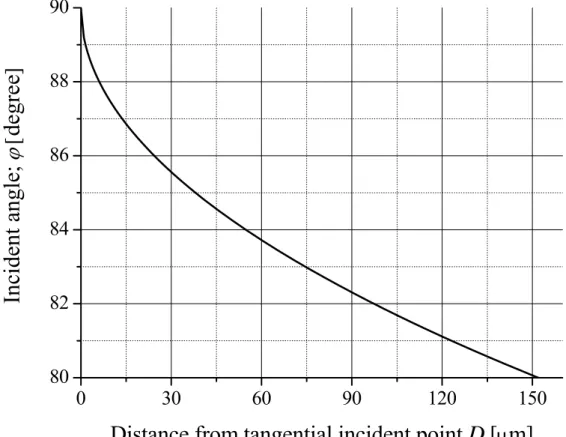
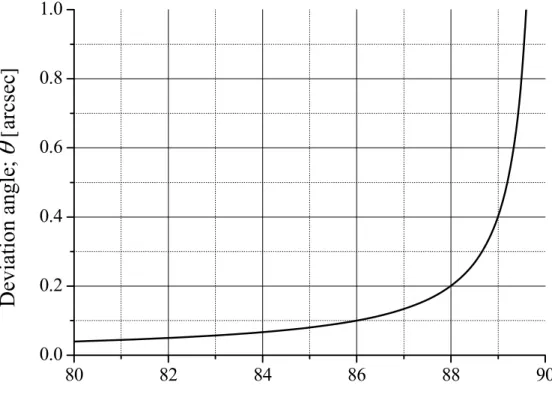
To estimate θ, the δ of the two media that comprise a boundary are required; these values are calculated from their densities ρ and wavelength of the incident X-rays λ (see Eq. (3)). As an incident X-ray energy of approximately 35 keV was adopted in our experiments aimed for clinical use, we calculated the δ of representative tissues and that of water for this X-ray energy; the results are shown in Table 1 [31, 106]. We also calculated the ϕ values for the circular boundary around the point where the X-ray is tangentially incident; this is shown in Fig. 9. In this instance, the circular boundary was assumed to be the arc of a circle with a radius of 10 mm. ϕ tends to 90° close to the point where the X-ray beam is tangentially incident, and diminishes to 80° at the point of 150 μm from the tangentially incident point along the radius direction. Here, let us suppose a circular boundary of water and articular cartilage with a radius of 10 mm. Water is assumed as the synovial fluid within the articular capsule. The relationship between the incident angle ϕ of the 35 keV X-ray beam and the deviation angle θ for this case is shown in Fig. 10. The gradient of the curve increases sharply around a ϕ value of 86°. This angle of ϕ corresponds to a distance of 25 μm from the tangentially incident point along the radius direction.
3.2 X-ray DFI by Laue geometry
3.2.1 Bragg geometry or Laue geometry?
Angular resolving analyzer imaging from refraction at an object has been actively studied over the last 10 years. There are two types of analyzer arrangement: those that utilize Bragg geometry and those that utilize Laue geometry. The Bragg case analyzer was first developed by Chapman et al. in 1997 [12] using an analyzer of relatively large thickness; this method is termed diffraction enhanced imaging (DEI). The Laue case analyzer was developed by Ingal et al. in 1995 [6], using a thin analyzer. In 2001, Ando et al. modified Laue type analyzer imaging to enable the detection of weak signals related to refraction at an object, with almost no background illumination, by tuning the incident X-ray energy and thickness of the analyzer [21]. This technique is termed dark-field imaging (DFI). Hirano et al. then applied a thin Bragg case analyzer to DFI in 2002 [24].
The aim of the present study is the application of these imaging methods to clinical use; therefore, the choice of either Bragg or Laue
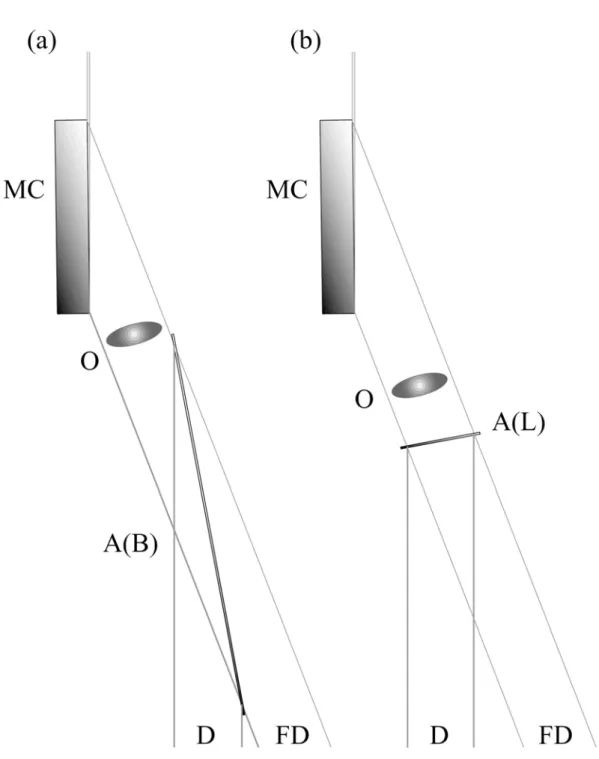
characteristic of this method will also enable us to observe an object dynamically under fluoroscopy. Laue geometry is more suitable for clinical use than Bragg geometry because it offers a larger field size for a given size of analyzer crystal. Figure 11 demonstrates that for Bragg geometry, the analyzer must be five-times larger than that required for Laue geometry to obtain the same field size. It is anticipated that larger 2D single-shot field sizes will be readily obtained by Laue geometry in the future; these will enable the imaging of larger objects.
3.2.2 Theory of X-ray DFI by Laue case
The combination of a monochro-collimator (MC) and a Laue case analyzer A(L), both of which are manufactured from perfect silicon crystal, is a key technological factor for 2D one-shot X-ray DFI. An MC enlarges the size of the incident X-ray beam and also improves its angular divergence. The cut surface is oriented at an appropriate angle α to the reflecting planes. An asymmetric factor b [107] is defined as sin (θB – α) / sin (θB + α). Here, θB is the Bragg angle. The MC, with an asymmetric factor b, enlarges the incident beam 1/b times to the reflecting direction and improves its angular divergence by a factor of b1/2. An A(L) works as a kind of angle-resolving filter for the incident X-ray, and has a thickness of several millimeters. IO and IG in the Laue case diffraction are defined as the
beam intensity in the directions of forward diffraction and diffraction, respectively. Considering negligible absorption for simplicity, these terms are defined as follows:
1
) / 1 (
cos
2 2 2
2
+
Λ +
= +
W W H
IO W π (15)
1
) / 1 (
sin
2 2 2
+
Λ
= +
W W
IG πH (16)
Λ=λcosθB /P χG (17) IO +IG =1 (18)
where H is A(L) thickness, and W is the normalized angular deviation from the center of the Bragg peak. Λ is the extinction distance as defined in Eq. (17), where λ is the X-ray wavelength, P the polarization factor, and χG the electric susceptibility.
Although Eqs. (15) and (16) are realized under the condition that there is no absorption by A(L), they are useful for observing the oscillations of peak intensities for IO and IG at W = 0. When W = 0, Eqs. (15) and (16) are expressed as follows:
(
Λ)
= cos2 H /
I π (19)
angular range of ± 4 about W for decreasing and increasing thickness of H (at 15 μm intervals), respectively, from the base thickness H to 60 μm. The curves of IG are found by reversing the corresponding curve of IO, which is clear from the Eq. (18). The key manipulation for X-ray DFI is to make the reflectivity of IO at W = 0 approximately equal to 0. This condition can be easily realized by increasing the incident X-ray energy (see Fig. 12) or by inclining A(L) to increase its effective thickness (see Fig. 13). In practice, the inclination of A(L) is limited to about 15°, which corresponds to up to approximately 35 μm correction of effective thickness for a 1-mm-thick A(L). Figure 14 shows the relationship between the inclination angle and effective thickness. The curve ‘e’ in Fig. 12 and 13 is desirable to realize the X-ray DFI. IO outside |W| = 1 maintains a high reflection percentage, while IO inside |W| = 1 is low, and is close to 0 at |W| = 0. One can easily observe that X-rays refracted by |W| > 1 at an object will have a high reflectivity of IO, while those with |W| < 1, or non-refracted X-rays, show low reflectivity if the imaging is performed with A(L) set at exactly the Bragg angular position, that is, |W| = 0. As a result, X-rays refracted by larger than |W| = 1 will be highly contrasted with non-refracted X-rays in the forward diffracted X-ray direction. Accordingly, IO = 0 at |W| = 0 realizes X-ray DFI, which is formed solely out of X-rays refracted at the object, with a low level of background illumination that is derived from X-rays non-refracted at the object.
The steps involved in acquiring X-ray DFI are as follows:
.Tune the effective thickness of A(L) and incident X-ray energy, and fix the A(L) to the Bragg condition.
. Close the shutter and position an object in front of the A(L). . Open the shutter and detect the forward diffracted X-rays.
The top view of this process is illustrated in Fig. 15. The different gray levels on the object indicate the different X-ray refractive indices for each of the four areas. Note that true X-ray DFI is composed only of X-rays refracted at an object.
Figure 6. Refraction of X-rays at a flat boundary between media with refractive indices n1 and n2.
Figure 7. Refraction of X-rays at an elliptical boundary between media with refractive indices n1 and n2.
Figure 8. Refraction of X-rays at a circular boundary between media with refractive indices n1 and n2.
Tissue ρ[kg/m3] δ
Skin 1090 1.84×10⁻⁷
Adipose tissue 950 1.61×10⁻⁷
Articular cartilage 1100 1.86×10⁻⁷
Muscle skeletal 1050 1.78×10⁻⁷
Breast
(Mammary gland) 1020 1.73×10⁻⁷
Kidney 1050 1.78×10⁻⁷
Liver 1060 1.79×10⁻⁷
Lung(Deflated) 1050 1.78×10⁻⁷
Lung(Inflated) 260 0.44×10⁻⁷
Cortical bone 1920 3.25×10⁻⁷
Spongiosa 1180 2.00×10⁻⁷
Water 1000 1.69×10⁻⁷
Table 1. ρ and δ values of representative tissues and water for 35 keV X-rays.
0 30 60 90 120 150 80
82 84 86 88 90
Incident angle; ϕ[degree]
Distance from tangential incident point D [μm]
Figure 9. Values of ϕ for the circular boundary around the point where X-rays are tangentially incident.
80 82 84 86 88 90 0.0
0.2 0.4 0.6 0.8 1.0
Deviation angle;
θ
[arcsec]Incident angle;
ϕ
[degree]Figure 10. Relationship between incident angle ϕ of 35 keV X-rays and deviation angle θ for the boundary between synovial fluid and articular cartilage.
Figure 11. Comparison of Bragg geometry (a) and Laue geometry (b) in obtaining an equivalent field of view. MC: monochro-collimator, O: object, A(B): Bragg case analyzer, A(L): Laue case analyzer, D: diffracted X-rays, and FD: forward diffracted X-rays.
-4 -2 0 2 4 0.0
0.2 0.4 0.6 0.8 1.0
a : H
b : H - 15μm c : H - 30μm d : H - 45μm e : H - 60μm
Reflectivity
W
Figure.12. Analyzer thickness H dependency of IO with H decreased by 15 μm to 60 μm when the incident X-ray energy is fixed.
-4 -2 0 2 4 0.0
0.2 0.4 0.6 0.8 1.0
Reflectivity
W
a : H
b : H + 15μm c : H + 30μm d : H + 45μm e : H + 60μm
Figure 13. Analyzer thickness H dependency of IO with H increased by 15 μm to 60 μm when the incident X-ray energy is fixed.
0 5 10 15 20 1.00
1.01 1.02 1.03 1.04 1.05 1.06
Effective thickness of A(L) [mm]
Inclination angle [degree]
Figure 14. Relationship between inclination angle and effective thickness of 1-mm-thick Laue case analyzer.
Figure 15. Steps involved in acquiring X-ray DFI.
Chapter 4
Experiment of X-ray DFI for articular cartilage
towards clinical application
4.1 Design of experimental setup
An incident X-ray energy of around 35 keV was selected for this experiment to reduce the exposure dose towards clinical use. Note that the incident X-ray energy must be tuned within the range of 2 keV to realize X-ray DFI. The MC and A(L) were both manufactured from perfect silicon crystal. Mechano-chemical polishing was carried out for the MC but not
and A(L) are shown in Figs. 16 and 17, respectively. The selected diffracting planes of the MC and A(L) are Si(440), as the width of the rocking curve under this condition is considered to be a suitable for the refraction angle at soft tissue. The surface of the MC (size 45 mm (V) by 120 mm (H)) was cut at α = 9.9° from the Si (440) diffracting planes. The size of the A(L) was 40 mm (V) by 70 mm (H), and approximately 1.2 mm thick. Under this condition, the incident X-rays are expanded to approximately 40 mm horizontally, and the vertical length is the same as that of the incident X-rays. The experimental setup design is shown in Fig. 18, where a human finger was positioned between the MC and A(L) as an object.
4.2 Simulation of rocking curves for the designed setup to
realize X-ray DFI
Absorption of X-rays by the A(L) cannot be disregarded for the case of a prepared A(L) with a thickness of approximately 1.2 mm and incident X-ray energy of around 35 keV. In simulating the rocking curve of forward diffraction and diffraction, X-ray absorption must therefore be taken into account.
The intensities of the forward diffracted and diffracted X-rays for a
Laue case crystal of thickness H, when taking account of absorption, are explained in detail for example in refs. [108] and [109]. According to ref. [109], the intensities are summarized roughly as follows. The forward diffracted and diffracted intensities for σ-polarization IO(W,H) and IG(W,H), expressed as functions of W and H, are given by:
(
W,H)
D(
z H)
2I O
O G
O =γ =
γ (21)
(
W,H)
D(
z H)
2I G
O G
G =γ =
γ (22)
Here, DO (z = H) and DG (z = H) are the amplitudes of the forward diffracted and diffracted X-rays, respectively, and are given by:
(
z H) [ (
i k H) (
i k H) ]
DO (1) 1 (2) ξ(2)exp 2π δ z(1) ξ(1)exp 2π δ z(2) ξ
ξ − −
=
= (23)
(
z H) [ (
i k H) (
i k H) ]
DG (2) (1) z(1) z(2)
) 2 ( ) 1 (
2 exp 2
exp πδ πδ
ξ ξ
ξ
ξ −
= −
= (24)
) ( j
kz
δ and ξ( j)can be written as
( ) ( ) ( )
O O O
G j G
z
ik iK ig
W ig
W K
k γ
χ γ
γ δ χ
1 2 2
" 2
2 '
⎥⎦−
⎢⎣ ⎤
⎡ + ± + + +
−
= (25)
( ) ( ) ( )
⎥⎦⎤⎢⎣⎡ + ± + + +
− +
= 2 2
)
( 1
1
1 W ig W ig ik
ik G
j O
γ
ξ γ (26)
Eqs. (25) and (26), W ,g and k are given by
( ) ( ) ⎥
⎦
⎢ ⎤
⎣
⎡
⎟⎟⎠
⎜⎜ ⎞
⎝
⎛ − +
−
=
O G O B B
G O G
W γ
χ γ θ θ
γ θ γ
χ 2 sin 2 1
2
1 '
' 0 (27)
⎟⎟
⎠
⎞
⎜⎜
⎝
⎛ −
=
O G G O G
g O
γ γ γ γ χ χ
'
"
2
(28)
'
"
G
k G
χ
= χ (29)
θ0 is the angle of incidence in the Laue case. χO' , χO" andχG' , χG" are the
real and imaginary components of the electric susceptibility χOandχG for the forward diffracted and diffracted beams, respectively.
To understand the change in the shapes of the rocking curves, the curves were simulated under the following conditions: the thickness of the A(L) was incrementally varied by a minute amount, while the incident X-ray energy remained constant at 35 keV. XOP 2.1 Beta 3 (X-ray Oriented Programs), which is provided freely by the European Synchrotron Radiation Facility (ESRF), was utilized in the simulation. The results are shown in Figs. 19 (a)-(e).
The results demonstrate that the reflectivity of forward diffracted X-rays at 0 arcsec (deviation from the Bragg angle) shows a period of approximately 120 μm. The condition of Fig. 19 (c) is therefore ideal for X-ray DFI. If the initial shape of the rocking curve approximates that shown in Fig. 19 (b), it is possible to realize the ideal shape for X-ray DFI
by adjusting the effective thickness of A(L). If the initial shape of the rocking curve is close to that shown in Fig. 19 (d), however, the incident X-ray energy has to be tuned to slightly higher. Note that the tuning range for the incident X-ray energy is limited to a few keV because the angle from the diffracting plane of MC, α, is fixed.
4.3 Object and consideration of the best setting of the object
to visualize articular cartilage
The object is a human finger amputated from a cadaver at metacarpophalangeal joint (MP joint) and fixed by formalin. Coloured volume-rendered 3D X-ray CT images displayed with various object opacities are shown in Fig. 20. These images were acquired using a conventional X-ray CT device for clinical use (HITACHI MEDICO). The target area is the articular cartilage on the head of the proximal phalanx. To investigate the structure of the proximal interphalangeal joint (PIP joint), volume-rendered 3D X-ray CT images of bones viewed from various angles were acquired using the same 3D CT date set as those in Fig. 20;
articular cartilages of both condyle cannot be visualized simultaneously, and they must be selected individually as the target. Slight pronation of the upper limb with slight flexion of the PIP joint is the best position for revealing the articular cartilage on the medial condyle of the proximal phalanx.
4.4 Experiment of X-ray DFI for visualization of articular
cartilage
4.4.1 Preliminary experiment of PIP joint imaging by X-ray
DFI at Photon Factory BL14B
The preliminary experiment for X-ray DFI, with the aim of imaging articular cartilage, was performed at beamline BL14B. This experiment utilized vertical polarization synchrotron radiation from the 5 Tesla superconducting wave shifter of the Photon Factory, which is in operation with 2.5 GeV and 450 mA, with a lifetime of 3000 min. A Si(111) double crystal monochromator is installed in this beamline and utilized for 10-20 keV X-rays by Si(111), 30-60 keV by Si(333), and 40-80 keV by Si(444) diffracting planes. The incident X-rays were monochromated to 34.8 keV, and a beam size of approximately 15 mm (V) and 3mm (H) was acquired.
The experimental apparatus was the same as that shown in Fig. 18, and the setup is shown in Fig. 22. Once incident X-ray energy was fixed to 34.8 keV, b was calculated to 0.04. This condition magnifies the beam size 25-times horizontally and improves its angular divergence by a factor of 0.2 by MC. As a result, the acquired field size was 15 mm (V) and 40 mm (H). For this combination of prepared MC and A(L), an incident X-ray energy of 34.8 keV with 5° inclination of A(L) represents optimum conditions for X-ray DFI. The rocking curves of forward diffraction and diffraction by A(L) without an object were then measured, and representative ones are shown in Fig. 23. The Object was set 200 mm in front of the A(L) in air.DFI and subordinate Bright-Field Image (BFI) on the diffracted X-ray were taken under the just Bragg condition. Inaddition, pseudo-DFIs and subordinate BFIs were acquired with the A(L) set off the just Bragg condition by approximately 0.05 arcsec to either a higher or lower angular position. The absorption contrast image was also taken with the analyzer set at 5 arcsec lower than the just Bragg condition. All of the images were stored on mammography film (Kodak Min-R 2000) without an intensifying screen to acquire images with high spatial resolution. The exposure time was 90 sec at a ring current of approximately 400 mA.
4.4.2 Further detailed experiment of PIP joint imaging by
X-ray DFI at Photon Factory BL14C1
A subsequent, more detailed, experiment with the aim of imaging articular cartilage using X-ray DFI was performed at beamline BL14C1 based on the result of the preliminary experiment 4.4.1. This beamline is branched off from the same trunk of BL14B. A Si(220) double crystal monochromator is installed in this beamline to utilize 12-66 keV X-rays. The experimental setup was identical to that of 4.4.1. In this beamline, incident X-rays of 34.8 keV are extracted more stably and with a larger photon flax density than those of BL14B, as fundamental harmonic reflection can be utilized. Additionally, the vertical dimension of the incident X-rays is approximately 30 mm, providing a field size of 30 mm (V) and 40 mm (H). The rocking curves of forward diffraction and diffraction by A(L) without an object were measured and representative ones are shown in Fig. 24.
The results of 4.4.1 reveal that articular cartilage unable to be depicted by X-ray absorption contrast imaging is clearly visualized by X-ray DFI and pseudo-DFIs. To avoid the observed effect of skin wrinkles superimposed over the articular cartilage, which may lead to incorrect diagnosis, the object was immersed in water. From another point of view, there was a strong dependency on the angular position of the A(L) in terms of the appearance of articular cartilage. Thorough research was performed
by taking images with the A(L) offset from the just Bragg condition by 0.04, 0.08, and 0.10 arcsec at both higher and lower angular positions, as well as at the just Bragg condition. Subordinate BFIs on the diffracted X-rays were taken for comparison at the same time. Absorption contrast images were also taken with the analyzer set 5 arcsec lower than the just Bragg condition. The points of the offset angles of the A(L) are shown in Fig. 25. The rocking curve of forward diffraction under these experimental conditions was simulated by the Eq. (30) (see ref. 110). The intensity:
−
I is expressed as follows:
⎪⎭
⎪⎬
⎫
⎪⎩
⎪⎨
⎧
⎟⎟⎠
⎞
⎜⎜⎝
⎛
− +
⎟⎟ −
⎠
⎞
⎜⎜⎝
⎛ + +
− =
1 1 /
exp cos 1 4 1
1
2
"
" 2
2 W
H W
I W G O
B
χ χ θ
μ
⎪⎭
⎪⎬
⎫
⎪⎩
⎪⎨
⎧
⎟⎟⎠
⎞
⎜⎜⎝
⎛ + +
⎟⎟ −
⎠
⎞
⎜⎜⎝
⎛
− + +
1 1 /
exp cos 1 4 1
1
2
"
" 2
2 W
H W
W G O
B
χ χ θ
μ (30)
In this equation, the oscillations were averaged over each period because their periods were extremely short. This suits the detectable rocking curve experimentally because of the low precision of detector. All of the images were stored on mammography film (Kodak Min-R 2000) without an intensifying screen to acquire images with high spatial resolution. The exposure time was 90 sec at a ring current of approximately 400 mA. To
that was transmitted through both only the soft tissues and both soft tissues and bone.
4.4.3 Experiment for the clinical application of X-ray DFI
at Photon Factory BL14B
Based on the results of the previous two experiment (4.4.1 and 4.4.2), experiments were then performed on exposure dose and depiction ability for a lesion, with a view towards clinical application.
4.4.3.1 Dosimetry in X-ray DFI
The dose evaluation for a clinical radiograph is usually performed by measuring the entrance surface dose for the skin, D0 [Gy], which is expressed as follows [111]:
2
0 ⎟
⎠
⎜ ⎞
⎝
⋅⎛
⋅
⋅
⋅
= SSD
B SCD e f
X W
D air (31)
Xair: exposure [C/Kg]
W: mean energy to form an ion pair [J]
e: elementary charge [C]
f : ratio of
(
μen/ρ)
med to(
μen/ρ)
airB: back scatter coefficient
SCD: source-chamber distance [m]
SSD: source-surface distance [m]
Xair is a value measured by the setting shown in Fig. 26, using an ion chamber. The international standard value of 33.97 J/C is used for W/e. f is dependent on both material and X-ray energy and is calculated as follows:
( )
( )
air meden en
ρ μ
ρ μ
/
/ (32)
(
μen/ρ)
med: mass energy absorption coefficient of a certain medium(
μen/ρ)
air: mass energy absorption coefficient of the airFor example, (μen/ρ)med for skin is 8.69×10⁻³ and (μen/ρ)air is 9.01×10⁻³ at X-ray energy of 36 keV. f is then calculated to be 0.964. B is dependent on both X-ray energy and the irradiated field size. B is approximately 1.16 at the effective X-ray energy of 36 keV from the X-ray tube for a circular field with a diameter of 32 mm, which is a similar condition to the present experiment [112, 113]. For reference, we generally use 45 kVp X-rays obtained form an X-ray tube and field size of 2×4 cm2 clinically, under which condition B is 1.13. The difference in B for these varied calculations is only 2.6 %. The last element in Eq. (30), (SCD/SSD)2, corresponds to the
to compare the air absorbed dose Dair [Gy],
air
air X
e D W ⎟⋅
⎠
⎜ ⎞
⎝
=⎛ (33)
of X-ray DFI and conventional clinical imaging to obtain a rough estimation of the required dose. From the above discussion, Dair represents the entrance surface dose of the air regardless of the backscatter factor. For dose estimation, Dair was measured by a 6 cm3 ion chamber, 10X5-6 with a model 9015 monitor (Radcal Corporation) shown in Fig. 27, in each following imaging condition.
4.4.3.2 Imaging of normal PIP and PIP with lesion by non
screen and film/screen system
The ability of X-ray DFI to detect lesions of articular cartilage was tested using a different imaging object that contained small lesions on its articular cartilage. An intensifying screen (Kodak Min-R 2000 screen) was introduced to the imaging system to reduce the radiation dose. The spatial resolution of the film/screen system (Kodak Min-R 2000/ Kodak Min-R 2000 screen) was estimated 80 - 90 μm. This system was used to determine whether the ability to depict articular cartilage can be maintained with the introduction of an intensifying screen.
These experiments were performed at beamline BL14B at operating mode with 3 GeV and 200 mA. The experimental apparatus was identical
to that of the previous two experiments, but employed an incident X-ray energy of 36 keV. A slight adjustment of X-ray energy was necessary to obtain a sufficient enlargement rate; this may have resulted from the change in operation mode. b was then calculated to be 0.02. In this case, 15° inclination of the A(L) was the optimum condition for X-ray DFI. The representative measured rocking curves of forward diffraction and diffraction by A(L) without an object were shown in Fig. 28. The imaging was performed with the A(L) offset the just Bragg condition by 0.04, 0.08, and 0.12 arcsec to either a higher or lower angular position, in addition to the just Bragg condition. The points of the offset angles of the A(L) are shown in Fig. 29, as in Fig. 25. Subordinate BFIs on the diffracted X-ray were taken at the same time to enable a comparison. Absorption contrast images were also taken with the analyzer set 5 arcsec lower than the just Bragg condition. All of the images were stored on mammography film (Kodak Min-R 2000) with and without an intensifying screen (Kodak Min-R 2000 screen). The exposure times were 150 sec for non-screen imaging and 3 sec for imaging incorporating an intensifying screen at a ring current of approximately 190 mA.