Asian International
Input-Output Project
Institute of Developing Economies
Japan External Organization
ASIAN INTERNATIONAL
INPUT-OUTPUT TABLE
2005
- TECHNICAL NOTES -
CONTENTS
Project Personnel for the 2005 Asian International Input-Output Table
1
I.
GENERAL OUTLINE
7
II.
SCHEMATIC IMAGE OF THE ASIAN INTERNATIONAL INPUT-OUTPUT TABLE
7
III. CODING SYSTEM AND SECTOR CLASSIFICATION
10
1. Coding System
10
1
― ―
Project Personnel for
the 2005 Asian International Input-Output Table
(As of the completion of the table)
CHINA
State Information Center
Fan Jianping
Chief Economist
Zhang Yaxiong
Assistant Director-General
Economic Forecasting Department
Zhao Kun
Vice-Chief
Economic Forecasting Department
Liu Yu
Associate Research Fellow
Economic Forecasting Department
Li Jifeng
Associate Research Fellow
Economic Forecasting Department
Zhang Peng
Vice-Chief
Economic Forecasting Department
Cheng Weili
Senior Economist
Economic Forecasting Department
Tao Liping
Senior Economist
Economic Forecasting Department
INDONESIA
Badan Pusat Statistik (Statistics Indonesia)
Slamet Sutomo
Deputy Director General
National Accounts and Statistics Analysis
Supriyanto
Director
Directorate of Production Accounts
Mufti Swaghara
Chief of Subdirectorate
2
― ―
viii
Suryadiningrat
Chief of Section
Consolidation of Cross-sector Account
Widdia Anggraini
Chief of Section
Consolidation of Quarterly GDP
KOREA
The Bank of Korea
Kim, Chong Gui
Head
Input-Output Statistics Team
National Accounts Office
Economic Statistics Department
Jung, Chang Duck
Head
Input-Output Statistics Team
National Accounts Office
Economic Statistics Department
Lee, Woo Ki
Head
Input-Output Statistics Team
National Accounts Office
Economic Statistics Department
Heo, Nam Su
Senior Economist
Input-Output Statistics Team
National Accounts Office
Economic Statistics Department
Lee, In Gue
Economist
Input-Output Statistics Team
National Accounts Office
Economic Statistics Department
Park, Seong Bin
Economist
3
― ―
Yun, Young Jin
Junior Economist
Input-Output Statistics Team
National Accounts Office
Economic Statistics Department
Kim, Bo Keong
Junior Economist
Input-Output Statistics Team
National Accounts Office
Economic Statistics Department
Jung, Young Ho
Junior Economist
Input-Output Statistics Team
National Accounts Office
Economic Statistics Department
Ha, Ji Won
Junior Economist
Input-Output Statistics Team
National Accounts Office
Economic Statistics Department
Yun, Seung Wan
Junior Economist
Input-Output Statistics Team
National Accounts Office
Economic Statistics Department
Bae, Ji Hyun
Junior Economist
Input-Output Statistics Team
National Accounts Office
Economic Statistics Department
MALAYSIA
Department of Statistics, Malaysia
Abdul Rahman Hasan
Chief Statistician
Abd. Latib Talib
Director
Economic Indicators Division
Roslawati Yahya
Deputy Director
Economic Indicators Division
Norhayati Shuja’
Assistant Director
4
― ―
x
Komathi Pindaya
Assistant Director
Economic Indicators Division
TAIWAN
Taiwan Research Institute
Tsai-Yi Wu
President
Pi Chen
Deputy Director
Hung-Chyn Chen
Deputy Director
Po-Lu Chen
Associate Research Fellow
Fang-Yi Wu
Project Associate Research Fellow
THE PHILIPPINES
National Statistics Office
Carmelita N. Ericta
Administrator
Estela T. De Guzman
Director
Industry and Trade Statistics Department
Rosie B. Sta. Ana
Chief
Economic Indices and Indicators Division
Katrina G. Esclamad
Chief
Business and Services Statistics Division
Elsie B. Solidum
Chief
Statistical Sampling and Operations Division
Dulce A. Regala
OIC-Chief
Industry Statistics Division
Ma. Julieta P. Soliven
Statistician IV
Foreign Trade Statistics
Juanita B. Soriano
Statistician IV
5
― ―
Apolinar F. Oblea
Statistician IV
Business and Services Statistics Division
Karen F. Villaquer
Statistician III
Economic Indices and Indicators Division
Dulce Joy Z. Sorino
Statistician III
Economic Indices and Indicators Division
Soraya C. De Guzman
Statistician III
Foreign Trade Statistics
SINGAPORE
Business Research Consultants LLP
Chow Kit Boey
Director
Lee Kee Beng
Consultant
Ong Chin Huat
Consultant
Chan Cheong Chiam
Managing Director
(Webilite Technology)
THAILAND
National Economic and Social Development Board
Arkhom Termpittayapaisith
Secretary General
Porametee Vimolsiri
Deputy Secretary General
Nopporn Manoonpol
National Account Director General
Prapasri Pongwattana
Director of Input-Output Section
Kingkamon Lertthitinunkul
Assistant Director of Input-Output Section
6
― ―
xii
JAPAN
Applied Research Institute, Inc.
Masatoshi Yokohashi
Chief Economist
Maki Tokoyama
Researcher
Institute of Developing Economies
Chiharu Tamamura
Chief Senior Researcher
Development Studies Center
Satoshi Inomata
Director
International Input-Output Analysis Studies Group
Development Studies Center
Hiroshi Kuwamori
Deputy Director
International Input-Output Analysis Studies Group
Development Studies Center
Hajime Sato
Research Fellow Sent Abroad (London, Delhi)
Yoko Uchida
Researcher
International Input-Output Analysis Studies Group
Development Studies Center
Bo Meng
Researcher
International Input-Output Analysis Studies Group
Development Studies Center
Technical Advisor
Takao Sano
Former Professor
3
I. GENERAL OUTLINE
The 2005 Asian International Input-Output Table is designed to depict the industrial network extended
over the ten countries, namely, China, Indonesia, Korea, Malaysia, Taiwan, the Philippines, Singapore,
Thailand, Japan and the United States of America, and gives a minute picture of input composition and
output distribution of each domestic industry vis-à-vis home as well as foreign countries’ industries.
On the assumption of stable (or linear) technical correlation between input and output, the table also
serve as an effective tool for the study of economic repercussion and forward and backward linkages
among the countries of concern. Since the
Asian International Input-Output Table was already made
available for years of 1985, 1990, 1995 and 2000, and partly available even for the year of 1975 (China
and Taiwan excluded), the 2005 table is expected to contribute to the studies on technological changes that
took place among these countries for decades.
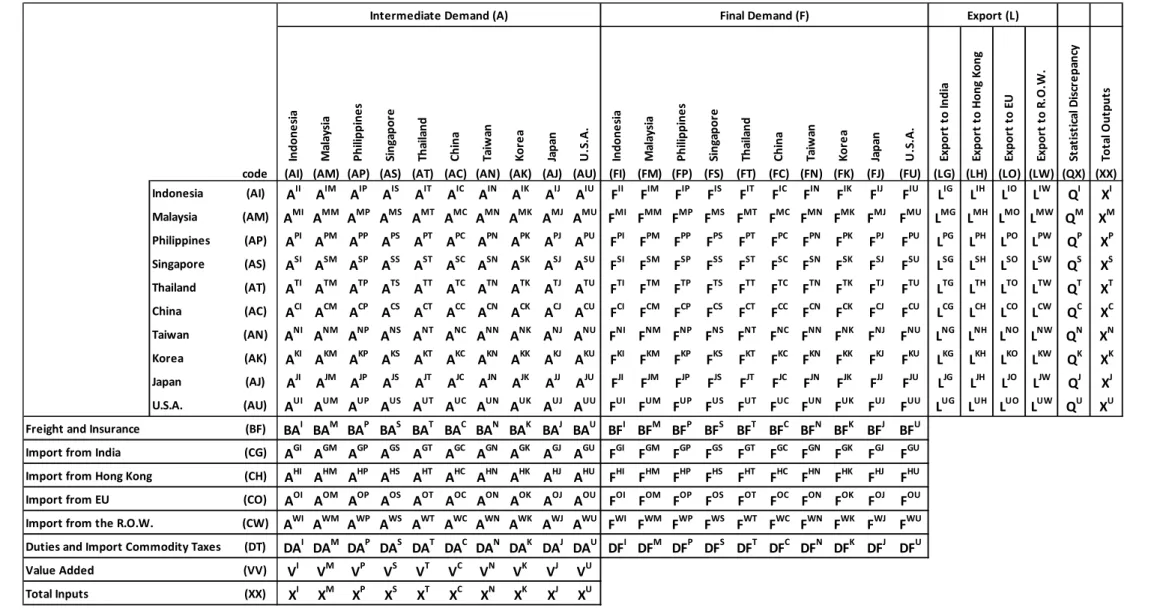
II. SCHEMATIC IMAGE OF THE ASIAN INTERNATIONAL INPUT-OUTPUT TABLE
The whole picture of the
2005 Asian International Input-Output Table is given in Figure 1. As seen
column-wise, each cell in the table shows the input composition of the industries of respective country.
�
��, for example, shows the input compositions of Indonesian industries vis-à-vis domestically produced
goods and services.
�
��, on the other hand, shows input composition of Indonesian industries for the
imported goods and services from Malaysia.
1The cells
�
��,
�
��,
�
��,
�
��,
�
��,
�
��,
�
��and
�
��allow the same interpretation for imports from other countries.
The transaction values thus tabulated are all given at producers’ prices of the countries of origin.
International freight and insurance paid by Indonesian industries for these imported transactions are all
recorded in the row vectors
��
�.
�
��,
�
��,
�
��and
�
��are input compositions of Indonesian
industries vis-à-vis imported goods and services from India, from Hong Kong, from EU and from the Rest
of the world, presented in CIF value.
2Import duties and import commodity taxes levied on all Indonesian
imports are recorded in the row vector
��
�.
Turning to the 11
thcolumn from the left side of the table, it shows the compositions of goods and
services that have gone to final demand sectors of Indonesia.
�
��and
�
��, for example, maps the inflow
into Indonesian final demand sectors, of goods and services domestically produced and of those imported
from Malaysia, respectively. The rest of the column is read in the same manner as is done for the 1
stcolumn of the table.
Seen in row-wise direction, the table shows the output distributions of the commodities produced by
domestic industries, to Malaysian industries, to the Philippines industries, and so on.
�
��is the
distribution of Indonesian goods and services to final demand sectors of Indonesia, and
�
��is to the final
demand sectors of Malaysia, and so on.
1
For imports of services, only imports of “Wholesale and retail trade” and “Transportation” are recorded in each
country’s import matrix. All other imports of services are treated as imports from the Rest of the world.
2
EU (
�
) in the 2005 Asian table consists of 25 member countries in 2005: Austria, Belgium, Cyprus, Czech
8
― ―
4
�
��,
�
��,
�
��and
�
��are Indonesia’s export to India, to Hong Kong, to EU, and to the Rest of the
world.
�
�is the statistical discrepancies and
�
�shows the gross outputs of Indonesian industries.
9
― ―
Figure 1. Layout of the
2005 Asian International Input-Output Table
In do ne sia M al ay sia Ph ili pp in es Si ng ap or e Th ai la nd Ch in a Ta iw an Ko re a Ja pa n U .S .A . In do ne sia M al ay sia Ph ili pp in es Si ng ap or e Th ai la nd Ch in a Ta iw an Ko re a Ja pa n U .S .A . Ex po rt �to �In di a Ex po rt �to �H on g� Ko ng Ex po rt �to �E U Ex po rt �to �R .O .W . St at ist ica l�D isc re pa nc y To ta l�O ut pu ts
code (AI) (AM) (AP) (AS) (AT) (AC) (AN) (AK) (AJ) (AU) (FI) (FM) (FP) (FS) (FT) (FC) (FN) (FK) (FJ) (FU) (LG) (LH) (LO) (LW) (QX) (XX) Indonesia (AI) AII AIM AIP AIS AIT AIC AIN AIK AIJ AIU FII FIM FIP FIS FIT FIC FIN FIK FIJ FIU LIG LIH LIO LIW QI XI Malaysia (AM) AMI AMM AMP AMS AMT AMC AMN AMK AMJ AMU FMI FMM FMP FMS FMT FMC FMN FMK FMJ FMU LMG LMH LMO LMW QM XM Philippines (AP) API APM APP APS APT APC APN APK APJ APU FPI FPM FPP FPS FPT FPC FPN FPK FPJ FPU LPG LPH LPO LPW QP XP Singapore (AS) ASI ASM ASP ASS AST ASC ASN ASK ASJ ASU FSI FSM FSP FSS FST FSC FSN FSK FSJ FSU LSG LSH LSO LSW QS XS
Thailand (AT) ATI ATM ATP ATS ATT ATC ATN ATK ATJ ATU FTI FTM FTP FTS FTT FTC FTN FTK FTJ FTU LTG LTH LTO LTW QT XT China (AC) ACI ACM ACP ACS ACT ACC ACN ACK ACJ ACU FCI FCM FCP FCS FCT FCC FCN FCK FCJ FCU LCG LCH LCO LCW QC XC Taiwan (AN) ANI ANM ANP ANS ANT ANC ANN ANK ANJ ANU FNI FNM FNP FNS FNT FNC FNN FNK FNJ FNU LNG LNH LNO LNW QN XN Korea (AK) AKI AKM AKP AKS AKT AKC AKN AKK AKJ AKU FKI FKM FKP FKS FKT FKC FKN FKK FKJ FKU LKG LKH LKO LKW QK XK Japan (AJ) AJI AJM AJP AJS AJT AJC AJN AJK AJJ AJU FJI FJM FJP FJS FJT FJC FJN FJK FJJ FJU LJG LJH LJO LJW QJ XJ U.S.A. (AU) AUI AUM AUP AUS AUT AUC AUN AUK AUJ AUU FUI FUM FUP FUS FUT FUC FUN FUK FUJ FUU LUG LUH LUO LUW QU XU Freight�and�Insurance (BF) BAI BAM BAP BAS BAT BAC BAN BAK BAJ BAU BFI BFM BFP BFS BFT BFC BFN BFK BFJ BFU
Import�from�India (CG) AGI AGM AGP AGS AGT AGC AGN AGK AGJ AGU FGI FGM FGP FGS FGT FGC FGN FGK FGJ FGU Import�from�Hong�Kong (CH) AHI AHM AHP AHS AHT AHC AHN AHK AHJ AHU FHI FHM FHP FHS FHT FHC FHN FHK FHJ FHU Import�from�EU (CO) AOI AOM AOP AOS AOT AOC AON AOK AOJ AOU FOI FOM FOP FOS FOT FOC FON FOK FOJ FOU Import�from�the�R.O.W. (CW) AWI AWM AWP AWS AWT AWC AWN AWK AWJ AWU FWI FWM FWP FWS FWT FWC FWN FWK FWJ FWU (DT) DAI DAM DAP DAS DAT DAC DAN DAK DAJ DAU DFI DFM DFP DFS DFT DFC DFN DFK DFJ DFU
Value�Added (VV) VI VM VP VS VT VC VN VK VJ VU
Total�Inputs (XX) XI XM XP XS XT XC XN XK XJ XU
Intermediate�Demand�(A) Final�Demand�(F) Export�(L)
10
― ―
6
III. CODING SYSTEM AND SECTOR CLASSIFICATION
1. Coding System
Row
Column
Description
AI001
AI001
|
|
Intermediate sectors, Indonesia
AI076
AI076
AI900
AI900
Sub-total (AI001 to AI076)
AM001
AM001
|
|
Intermediate sectors, Malaysia
AM076
AM076
AM900
AM900
Sub-total (AM001 to AM076)
AP001
AP001
|
|
Intermediate sectors, Philippines
AP076
AP076
AP900
AP900
Sub-total (AP001 to AP076)
AS001
AS001
|
|
Intermediate sectors, Singapore
AS076
AS076
AS900
AS900
Sub-total (AS001 to AS076)
AT001
AT001
|
|
Intermediate sectors, Thailand
AT076
AT076
AT900
AT900
Sub-total (AT001 to AT076)
AC001
AC001
|
|
Intermediate sectors, China
AC076
AC076
AC900
AC900
Sub-total (AC001 to AC076)
AN001
AN001
|
|
Intermediate sectors, Taiwan
AN076
AN076
AN900
AN900
Sub-total (AN001 to AN076)
AK001
AK001
|
|
Intermediate sectors, Korea
AK076
AK076
11
― ―
1. Coding System (Continued)
Row
Column
Description
AJ001
AJ001
|
|
Intermediate sectors, Japan
AJ076
AJ076
AJ900
AJ900
Sub-total (AJ001 to AJ076)
AU001
AU001
|
|
Intermediate sectors, U.S.A.
AU076
AU076
AU900
AU900
Sub-total (AU001 to AU076)
BF001
International freight and insurance
CG001
|
Intermediate input from India (C.I.F. prices)
CG076
CG900
Sub-total (CG001 to CG076)
CH001
|
Intermediate input from Hong Kong (C.I.F. prices)
CH076
CG900
Sub-total (CH001 to CH076)
CO001
|
Intermediate input from European Union (C.I.F. prices)
CO076
CO900
Sub-total (CO001 to CO076)
CW001
|
Intermediate input from the Rest of the World (C.I.F. prices)
CW076
CW900
Sub-total (CW001 to CW076)
DT001
Import duties and import commodity taxes
12
― ―
8
1. Coding System (Continued)
Row
Column
Description
VV001
Wages and salary
*1VV002
Operating surplus
VV003
Depreciation of fixed capital
*2VV004
Indirect taxes less subsidies
VV900
Sub-total (VV001 to VV004)
FI001
|
Final demands
*3, Indonesia
FI004
FI900
Sub-total (FI001 to FI004)
FM001
|
Final demands, Malaysia
*4FM005
FM900
Sub-total (FM001 to FM005)
FP001
|
Final demands, Philippines
*5FP005
FP900
Sub-total (FP001 to FP005)
FS001
|
Final demands, Singapore
*4FS005
FS900
Sub-total (FS001 to FS005)
FT001
|
Final demands, Thailand
FT004
FT900
Sub-total (FT001 to FT004)
FC001
|
Final demands, China
*6FC005
13
― ―
1. Coding System (Continued)
Row
Column
Description
FN001
|
Final demands, Taiwan
FN004
FN900
Sub-total (FN001 to FN004)
FK001
|
Final demands, Korea
FK004
FK900
Sub-total (FK001 to FK004)
FJ001
|
Final demands, Japan
FJ004
FJ900
Sub-total (FJ001 to FJ004)
FU001
|
Final demands, U.S.A.
FU004
FU900
Sub-total (FU001 to FU004)
LG001
Export to India
LH001
Export to Hong Kong
LO001
Export to European Union
LW001
Export to the Rest of the World
LX900
Sub-total (LH001 to LW001)
QX001
Statistical Discrepancies
XX600
XX600
Total input or total output
Notes: *1
In Malaysia part, VV001 includes “Wages and Salary” and VV002 include “Operating surplus”,
“Depreciation” and “Indirect taxes less subsidies”.
*2
In U.S.A. part, “VV003 Depreciation” is included in “VV002 Operating surplus” as the “Gross
operating surplus” and not recorded independently.
*3
Common final demand items are as follows:
001 Private consumption expenditure
002 Government consumption expenditure
003 Gross fixed capital formation
004 Changes in stocks
005 Adjustment item (This item exist for China, Malaysia, the Philippines and Singapore)
*4
FM005 for Malaysia and FS005 for Singapore are the balancing items in converting the valuation
14
― ―
10
from basic price to producer’s price; and (2) domestic trade margins and domestic transport cost
(TTM) on exported goods, which came out of the adjustment process of export vector from F.O.B.
to producer’s price.
*5
FP005 for the Philippines is established to record the discrepancy between production and
expenditure in the national account statistics.
15
― ―
2. Sector Classification of the 2005 Asian International Input-Output Table
7 Sectors
26 Sectors
76 Sectors
(2000, 2005)
78 Sectors
(1985*, 1990, 1995)
Code Description Code Description Code Description Code Description
INTERMEDIATE SECTORS
001 Agriculture, 001 Paddy 001 Paddy 001 Paddy livestock, 002 Other agricultural 002 Other grain 007A Other grain forestry and products 003 Food crops 002 Cassava
fishery 004 Sugar cane and beet
005 Oil palm and coconuts 007B Other food crops 004 Non-food crops 003 Natural rubber
006 Fiber crops
008 Other commercial crops 003 Livestock and
poultry
005 Livestock and poultry 009 Livestock and poultry
004 Forestry 006 Forestry 010 Forestry 005 Fishery 007 Fishery 011 Fishery 002 Mining and
quarrying
006 Crude petroleum and natural gas
008 Crude petroleum and natural gas
012 Crude petroleum and natural gas
007 Other mining 009 Iron ore 015A Iron ore 010 Other metallic ore 013 Copper ore
014 Tin ore
015B Other metallic ore 011 Non-metallic ore and
quarrying
016 Non-metallic ore and quarrying
003 Manufacturing 008 Food, beverage and 012 Milled grain and flour 018 Milled rice
tobacco 019 Other milled grain and flour
013 Fish products 021A Fish products 014 Slaughtering, meat and
dairy products
021B Slaughtering, meat and dairy products 015 Other food products 017 Oil and fats
020 Sugar
021C Other food products 016 Beverage 022A Beverage
017 Tobacco 022B Tobacco 009 Textile, leather, and 018 Spinning 023 Spinning
the products thereof 019 Weaving and dyeing 024 Weaving and dyeing 020 Knitting 025 Knitting
021 Wearing apparel 026 Wearing apparel 022 Other made-up textile
products
027 Other made-up textile products
023 Leather and leather products
16
― ―
12
2. Sector Classification of the 2005 Asian International Input-Output Table (Continued)
7 Sectors
26 Sectors
76 Sectors
(2000, 2005)
78 Sectors
(1985*, 1990, 1995)
Code Description Code Description Code Description Code Description
INTERMEDIATE SECTORS
003 Manufacturing 010 Wooden furniture 024 Timber 029 Timber and other wooden 025 Wooden furniture 030A Furniture
products 026 Other wooden products 030B Other wooden products 011 Pulp, paper and 027 Pulp and paper 031 Pulp and paper
printing 028 Printing and publishing 032 Printing and publishing 012 Chemical products 029 Synthetic resins and
fiber
033A Synthetic resins and fiber
030 Other basic industrial chemicals
033B Other basic industrial chemicals
031 Chemical fertilizers and pesticides
034 Chemical fertilizers and pesticides
032 Drugs and medicine 035A Drugs and medicine 033 Other chemical
products
035B Other chemical products
013 Petroleum and petrol products
034 Petroleum and petrol products
036 Refined petroleum and its products
014 Rubber products 036 Tires and tubes 037 Tires and tubes 037 Other rubber products 038 Other rubber products 015 Non-metallic mineral
products
038 Cement and cement products
039 Cement and cement products
039 Glass and glass products
040 Glass and glass products
040 Other non-metallic mineral products
041 Other non-metallic mineral products 016 Metals and metal 041 Iron and steel 042 Iron and steel
products 042 Non-ferrous metal 043 Non-ferrous metal 043 Metal products 044 Metal products 017 Industrial machinery 044 Boilers, engines and
turbines
045E Engines and turbines
045 General machinery 045C-2 Ordinary industrial machinery 046 Metal working
machinery
045B-1 Specialized industrial machinery
045C-2 Ordinary industrial machinery
047 Specialized machinery 045A Agricultural machinery 045B-2 Specialized industrial
17
― ―
2. Sector Classification of the 2005 Asian International Input-Output Table (Continued)
7 Sectors
26 Sectors
76 Sectors
(2000, 2005)
78 Sectors
(1985*, 1990, 1995)
Code Description Code Description Code Description Code Description
INTERMEDIATE SECTORS
003 Manufacturing 018 Computers and electronic equipment
050 Electronic computing equipment
046A Electronics and electronic products
051 Semiconductors and integrated circuits 052 Other electronics and
electronic products 019 Other electrical
equipment
048 Heavy electrical equipment
045D Heavy electric machinery
049 Television sets, radios, audios and
communication equipment
046A Electronics and electronic products
053 Household electrical equipment
046B Other electric machinery and appliance
054 Lighting fixtures, batteries, wiring and others
020 Transport equipment 055 Motor vehicles 047A Motor vehicles
056 Motor cycles 047B-1 Motor cycles and bicycles (Motor cycles)
057 Shipbuilding 048B Shipbuilding 058 Other transport
equipment
047B-2 Motor cycles and bicycles (Bicycles)
048A Aircrafts
048C Other transport equipment 021 Other manufacturing 035 Plastic products 050A Plastic products
products 059 Precision machines 049 Precision machines 060 Other manufacturing
products
050B Other manufacturing products
004 Electricity, gas 022 Electricity, gas and 061 Electricity and gas 051 Electricity, gas and water supply and water supply water supply 062 Water supply
005 Construction 023 Construction 063 Building construction 052A Building construction 064 Other construction 052B Other construction 006 Trade and transport 024 Trade and transport 065 Wholesale and retail
trade
053A Wholesale and retail trade
18
― ―
14
2. Sector Classification of the 2005 Asian International Input-Output Table (Continued)
7 Sectors
26 Sectors
76 Sectors
(2000, 2005)
78 Sectors
(1985*, 1990, 1995)
Code Description Code Description Code Description Code Description
INTERMEDIATE SECTORS
007 Services 025 Other services 067 Telephone and telecommunication
054A Telephone and telecommunication 068 Finance and insurance 054B Finance and insurance 069 Real estate 054D-1 Other services
070 Education and research 054C Education and research 071 Medical and health
service
054D-2 Medical and health service
072 Restaurants 054D-3 Restaurants 073 Hotel 054D-4 Hotel 074 Other service 054D-5 Other service 076 Unclassified 056 Unclassified
026 Public administration 075 Public administration 055 Public administration
FINAL DEMAND SECTORS
001 Private consumption expenditure
001 Private consumption
expenditure 001 Private consumption expenditure 001 Private consumption expenditure
002 Government consumption expenditure
002 Government consumption expenditure
002 Government consumption expenditure
002 Government consumption expenditure 003 Gross fixed capital
formation 003 Gross fixed capital formation 003 Gross fixed capital formation 003 Gross fixed capital formation 004 Changes in stocks 004 Changes in stocks 004 Changes in stocks 004 Changes in stocks 005 Adjustment item 005 Adjustment item 005 Adjustment item - -
VALUE ADDED SECTORS
001 Wages and salaries 001 Wages and salaries 001 Wages and salaries 001 Wages and salaries 002 Operating surplus 002 Operating surplus 002 Operating surplus 002 Operating surplus 003 Depreciation 003 Depreciation 003 Depreciation 003 Depreciation 004 Indirect taxes less
subsidies
004 Indirect taxes less subsidies
004 Indirect taxes less subsidies