1
Growth Theory:The Economy
in the Very Long Run
•Solow growth model
•Growth accounting
CHAPTER 7~8 Summary
CHAPTER 7~8 Summary
G.Mankiw / macroeconomics 5
thedition
ンキュ クロ経済学Ⅱ 応用編
―第 章 経済成長
2
Solow growth model
Solow growth model
• Why our national income growth?
• Why some economic grow faster than others?
To explain these questions,
we must broaden our analysis
so that it describes change in the economy over time.
Solow growth model
• Saving
• Population growth
• Technological progress
How affect the level of an
economy’s output and its growth
over time.
3
The Accumulation of Capital
The Accumulation of Capital
1
ststep: The Supply for goods
The Supply of Goods The Supply of Goods
and the Production Function and the Production Function
Y = F(K,L) zY = F(zK,zL)
Set z = 1/L Y/L = F(K/L,1)
Set y = Y/L ← output per worker k = K/L ← capital per worker
y = f(k)
Where we define f(k) = F(K,1) MPK = f(k+1)-f(k)
*The
Production function has constant
returns to scale.
*Y/L is a function of the
amount of capital per worker K/L .
Diminishing marginal product of
capital
Output, f(k)
1
MPK
*MPK: Marginal product of capital
The slope of production function is MPK. y
4
The Accumulation of Capital
The Accumulation of Capital
2
ndstep: The Demand for goods
The Demand for Goods The Demand for Goods and the Consumption Function and the Consumption Function
y = c+i
Set s is saving rate c = (1-s)y
To see what this consumption function implies for investment, substitute (1-s)y for c in the national income
Accounts identity. y = (1-s)y+i
i = sy
Investment = Saving
*The demand for goods in the solow model comes from consumption and investment.
5
The Accumulation of Capital
The Accumulation of Capital
3
rdstep: Growth in the Capital Stock and the Steady State
The Capital Stock is key determination of the economy output.
•Investment: expenditure on plant and equipment.
c=f(k)-sf(k)
i y
Output, f(k)
Investment, sf(k) Output
per worker, y
Capital per worker, k
figure2: Output, Consumption and Investment
c=f(k)-sf(k)
i y
Output, f(k)
Investment, sf(k) Output
per worker, y
Capital per worker, k
figure2: Output, Consumption and Investment
Investment = Saving i = sy
By substituting
the production function for y, we can express investment per worker as a function of the capital stock per worker.
i = sf(k)
This equation relates the existing stock of capital k to the accumulation
of new capital i.
6
The Accumulation of Capital
The Accumulation of Capital
4
thstep: Growth in the Capital Stock and the Steady State
The Capital Stock is key determination of the economy output.
•Depreciation: wearing out of old capital; causes capital stock to fall.
figure3: Depreciation
Depreciation, δk
Capital
per worker, k Depreciation
per worker,δ
figure3: Depreciation
Depreciation, δk
Capital
per worker, k Depreciation
per worker,δ
Depreciation
We assume that a
certain fraction
δ of the capital stock wears
the depreciation rate.
7
The Accumulation of Capital
The Accumulation of Capital
5
thstep: Growth in the Capital Stock and the Steady State
The Capital Stock is key determination of the economy output.
•Investment: expenditure on plant and equipment.
•Depreciation: wearing out of old capital
;causes capital stock to fall.
Relationship between Investment & Depreciation
Investment = Saving
i = sf(k)
Change in capital stock = Investment-Depreciation
⊿k = i-δk
⊿k = sf(k)-δk
Where ⊿k is change in the capital stock between one year and the next.
The higher the capital stock The higher the capital stock The Greater amount of the The Greater amount of the
output & investment. output & investment.
Yet greater the amount of depreciation. Yet greater the amount of depreciation.
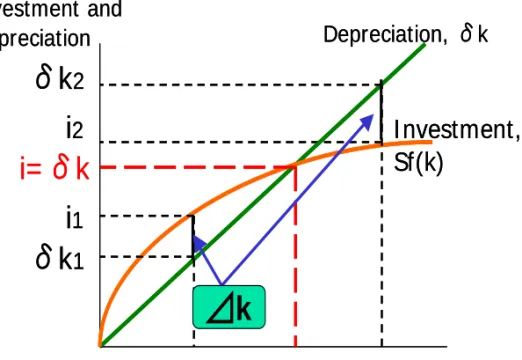
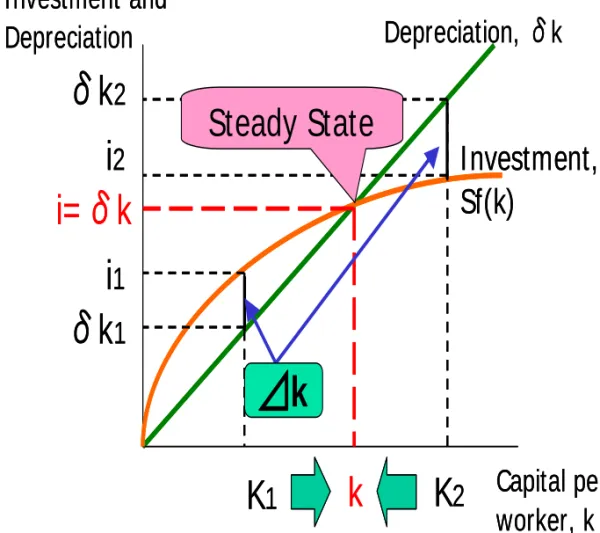
figure 4: investment, Depreciation,and the Steady State
Capital per worker, k I nvestment and
Depreciation
K1 k K2
δk2
δk1 i2
i=δk i1
Depreciation, δk
I nvestment, Sf(k)
figure 4: investment, Depreciation,and the Steady State
Capital per worker, k I nvestment and
Depreciation
K1 k K2
δk2
δk1 i2
i=δk i1
Depreciation, δk
I nvestment, Sf(k)
⊿k
8
figure 4: investment, Depreciation,and the Steady State
Capital per worker, k Investment and
Depreciation
K1 k K2
δk2
δk1 i2 i=δk
i1
Depreciation, δk
Investment, Sf(k)
figure 4: investment, Depreciation,and the Steady State
Capital per worker, k Investment and
Depreciation
K1 k K2
δk2
δk1 i2 i=δk
i1
Depreciation, δk
Investment, Sf(k)
⊿k
Steady State
The Accumulation of Capital
The Accumulation of Capital
(At k) Investment = Depreciation sf(k) =δk
⊿k = sf(k)-δk = 0
We therefore call k
the steadysteady--state level of capital.state
(At k1) Investment > Depreciation sf(k) >δk
⊿k = sf(k)-δk > 0
(At k2) Investment < Depreciation sf(k) <δk
⊿k = sf(k)-δk < 0.
6
thstep:Steady State
9
The Accumulation of Capital
The Accumulation of Capital
7
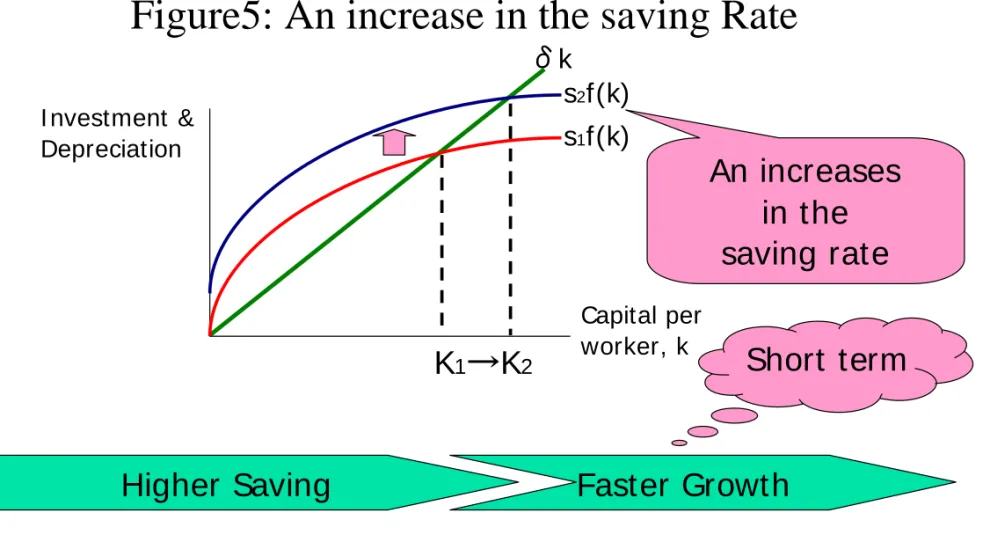
thstep: How Saving Affects Growth
Example:Japanese & German growth after World War Ⅱ
Figure 4-5: An I ncrease in the Saving Rate
I nvestment & Depreciation
Capital per worker, k
s1f(k)
K1 K2
s2f(k) δk
An increases in the
saving rate
Higher Saving Faster Growth
Short term
Figure5: An increase in the saving Rate
10
Population Growth
Population Growth
1
ststep: Population Growth
Figure 6: Population Growth in the Solow Model
Investment, break-even investment
K*
Break-even
investment, (δ+ n)k
Investment, Sf(k)
The Steady State
Capital per worker,k
Figure 6: Population Growth in the Solow Model
Investment, break-even investment
K*
Break-even
investment, (δ+ n)k
Investment, Sf(k)
The Steady State
Capital per worker,k Investment,
break-even investment
K*
Break-even
investment, (δ+ n)k
Investment, Sf(k)
The Steady State
Capital per worker,k
Thus,
k = K/L is capital per worker, and y = Y/L is output per worker.
⊿k = Investment
-(Depreciation+population growth)
= i-(δ+n)k
n is the rate of population growth (δ+n)k is breakbreak--even investment.even investment
11
2
ndstep: The Effects of Population Growth
Population Growth
Population Growth
Figure 7: The Impact of Population Growth
(δ+ n2)k
k2*
I nvestment, break-even investment
k1*
Investment, Sf(k)
Capital per worker,k
(δ+ n1)k
Down
Figure 7: The Impact of Population Growth
(δ+ n2)k
k2*
I nvestment, break-even investment
k1*
Investment, Sf(k)
Capital per worker,k
(δ+ n1)k
Down
An increase in the rate of population growth
reduces the steady state capital stock.
Population growth
Lower level of capital per worker Lower income
12
The Higher Saving Rate
The Higher Saving Rate
& Population Growth
& Population Growth
The higher rate of saving The higher stock of capital
+
The higher level of output The higher income
Population growth
Lower level of capital per worker Lower income
When the economy reaches its steady state, output per worker stops growing.
We cannot explain long economic growth.
We cannot explain long economic growth.
13
1
ststep: The Efficiency of Labor
Technological Progress
Technological Progress
in the Solow Model
in the Solow Model
Y = F(K,L)
The model is modified to include exogenous technological progress.
E: efficiency of labor
Y = F(K,L × E)
L×E is
effective workers. effective workers.
The simple assumption The simple assumption about technological progress about technological progress
E glows at some constant rate g.
g: the rate of labor-augmenting technological progress
14
Technological Progress
Technological Progress
in the Solow Model
in the Solow Model
2
ndstep: The Effects of Technological Progress
Figure8: Technological progress in the Solow Growth Model
I
I
δ
Steady State
k
Capital per effective worker Capital per effective worker
k = K/(L × E)
Output per effective worker Output per effective worker
y = Y/(L × E)
change in the capital stock between one year and the next
⊿ k = sf(k)-( δ +n+g)k
15
Technological Progress
Technological Progress
in the Solow Model
in the Solow Model
y y
= y = Y L =
Y = y×L
y
y y
= ×
y = Y ×L =
Y = y× g
Y = y× ×L
y
y y
= y = Y L =
Y = y×L
y
y y
= ×
y = Y ×L =
Y = y× g
Y = y× ×L
y
3rd step: The Effects of Technological Progress
We can explain long economic growth.
We can explain long economic growth.
Technological progress
Technological progress
16
The Golden Rule Steady State
The Golden Rule Steady State
Golden rule level of capital
Steady-state output, depreciation and
investment per effective worker
Steady-state capital per effective worker,k*
(δ+ n+ g)k*
K*gold c*gold
i*gold
f(k* )
S gold f(k* ) Steady-state
output, depreciation and
investment per effective worker
Steady-state capital per effective worker,k*
(δ+ n+ g)k*
K*gold c*gold
i*gold
f(k* )
S gold f(k* )
Figure 9: steady state consumption Consumption = output – Investment
c = f(k) – sf(k)
Maximizes Consumption
c* = f(k*)-( δ +n+g)k*
At this point
MPK = δ +n+g
MPK- δ = n+g
17
Policies to Promote Growth
Policies to Promote Growth
• Change in the Rate of Saving
– Budget Deficit – Budget Surplus – Pension
• Allocating the Economy’s Investment
– Are there some types of investment that policy should especially encourage?
– Learning by doing
• Technological externally
• Knowledge spillover
• Social profit > Personal profit
– Infrastructure
18
The Worldwide Slowdown in
The Worldwide Slowdown in
Economic Growth
Economic Growth
• Measurement Problem
• Oil Price
• Worker Quality
• The Depletion of Idea
19
Beyond the Solow Model:
Beyond the Solow Model:
Endogenous Growth Theory
Endogenous Growth Theory
• ソロ モ ル 超え 技術進歩 説明 モ ル
– Y =
– Y 産出 資本 ック 資本 単 当た 生産
• ソロ モ ル 違 い 資 本 単 追 加 A 単 産出 た 資本 対 収益逓減 い
– ⊿ = Y δ 資本蓄積 変化 表わ – ⊿Y Y = ⊿ = δ
• 経済 所得 永続的 成長 説明
20
A Two
A Two - - Sector Model Sector Model
• 以上 生産部門 持 モ ル 展開
• 部門 経済 仮定 製 企業 研究大学
– u: 大学出身 労働力 占 割合
– 1-u: 製 業 労働力 割合
– E: 知識 ック 割合 労働 効率性 決定
• 場合 生産関数
– Y = F [K, (1-u)EL] 製 企業 生産関数
– ⊿E = g(u)E 研究大学 生産関数
– ⊿K = sY – δK 資本蓄積
• 持続的 成長 内生的 観測 大学 知識
創 決 減 い
21
The Micro Economics of
The Micro Economics of
Research and Development
Research and Development
• 部門 内生的成長モ ル 技術進歩 完全 理解 い い
– 研究開発 過程 実
• 知識 ほ 公共 あ そ 多く 利潤動機 駆 企
業 い
• 研究 利潤 発生 特許制度 企業
一時的 そ 分 い 独占 あ
• ひ 企業 行 た革新 次 企業 更 革新 た
• 内生的成長モ ル 長所
– 技術革新 仮定 完全 描写 い
• 研究 行 う 行 わ い ?
– 正 外部性 先人 優 た知識 利用
– 外部性 他人 領域侵害
– 正 外部性 大 い場合補助金 政政策 妥当 あ
22
Accounting for the Sources of
Accounting for the Sources of
Economic Growth
Economic Growth
Real GDP in the United
States has grown an average of 3%
per year over the past 40
years.
What explains this growth?
Reference: “74th Annual Report 1 April 2003 – 31 March 2004” Bank for International Settlements, 2004
23
Growth Accounting
Growth Accounting
• 生産要素 増加
– Y = F(K,L)
– 資本 増加
• MPK = F(K+1,L)-F(K,L)
• 資本 ⊿K単 増加 た 産出 近似的 MPK×⊿K 増加
– 労働 増加
• MPL = F(K,L+1)-F(K,L)
• 労働 ⊿L単 増加 た 産出 近似的 MPL×⊿L 増加
– 資本 労働 増加
• ⊿Y = (MPK×⊿K)+(MPL×⊿L)
•
• ( )
L L K
K Y
Y
L L Y
L MPL K
K Y
K MPK Y
Y
− Δ Δ +
Δ =
⎟ Δ
⎠
⎜ ⎞
⎝
⎛ ×
Δ +
⎟⎠
⎜ ⎞
⎝
⎛ ×
Δ =
α α 1
24
• 技術進歩
– Y = AF(K,L)
• A: TFP(Total Factor Productivity)
•
•
• ⊿A/A ソロ 残差(Solow residual) 呼 あ
• TFP 測定 た投入 産出 間 関係 変え あ そ う
含ま
Growth Accounting
Growth Accounting
( )
( )
LLK K Y
Y A
A
A A L
L K
K Y
Y
− Δ Δ −
Δ − Δ =
+ Δ
− Δ Δ +
Δ =
α α
α α
1 1
25
Case Study:
Case Study: “ “ The Myth of the Asia The Myth of the Asia ’ ’ s s
Miracle
Miracle ” ”
• Paul Krugman (Stanford University)
• 1950 年代 ソビエ 経済
著 く成長 遂 た
タ 信頼性 疑問 あ
• 成長 大 資本 労働力 投入
た 必然的 起 た あ
た
• ソロ モ ル 簡単
説明
26
• 近年 東ア ア 成長 当時
ロ ア 同 言え ???
Case Study:
Case Study: “ “ The Myth of the Asia The Myth of the Asia ’ ’ s s
Miracle
Miracle ” ”
27
中国 へ向 う ?
中国 へ向 う ?
• 中国経済 特徴
– 安い労働賃金 い生産コ 国際
競争力 維持 中国 一人あた GDP 日
本 1/30
– 急 資本蓄積
• 投資率 固定資本形成 対GDP比
– 中国 % 年
– 日本 % 年代初頭
» 中国 家計 日本以上 貯蓄率 高い
» % 年 中国 家計貯蓄率
» 対内直接投資 急増 高度成長期 日本 外資 完全 閉 出 いた
28
中国 日本
生産 生産要素 年 年
実質GDP
労働者数
実質資本 ック
労働生産性
資本労働比率
総要素生産性
出展:経済セ ナ 月号 P
非 次産業 成長率 分解:中国 日本
29
タ い 私 見解
• 実際 TFP い ?
– 計測 問題
• 中国 国土 広いた 測定 困難
• ソロ モ ル 残差 日本 先進国
技術 流出 い
– 中国国内 開発 た技術 い???
• 政治的 問題
– 意図的 タ 改 い ?
• 共産主義国 ソビエ 意図的 タ 水増 いた
• 共産党一等支配 正当化 た